The soccer Pythagorean probably never had enough life in the first place for it to be considered dead but its torpid state was given a little rattle last week when Soccermetrics put up a post evaluating EPL teams by their Pythagorean points expectations to date.
For those not familiar, the Pythagorean Win Expectation was developed by Bill James while working as a night watchman at a bean cannery. That's not a joke. James himself is more or less the reason Liverpool fans have the term 'Moneyball' to misuse. Anyway, he found that a baseball team's win percentage was equal to:
The exponent has since been adjusted to 1.8 but the formula tracks remarkably well with actual results. Similar formulas have since been developed for basketball and football (to avoid confusion, I'll stick with the American convention where 'football' is 'soccer' and 'football' is 'football').
How is it useful?
If you're a baseball GM at the All-Star Break (roughly midway through the season) and you're wondering wether to start moving players and dumping salaries, or if you should instead go add another bat to make a run at the playoffs, simply calculating your team's Pythagorean win probability is a strong indicator of how much the team can expect to win (or lose) before even making any personnel decisions.
There is room for legitimate debate on its usefulness in soccer with it's 38 game schedule—MLB has 162 games, the NBA has 82—but even in the NFL where there are only 16 games, it is still useful predicting year-on-year performances.
As Football Outsiders noted: "[NFL] teams that win a minimum of one full game more than their Pythagorean projection tend to regress the following year; teams that win a minimum of one full game less than their Pythagoerean projection tend to improve the following year."
So even for smaller game-per-seasons sports where you might not get reliable and meaningful results until the season is over, it can still be a useful tool in evaluating something like, "Should we fire Roberto Martinez?" But soccer's attempts to fit win expectation into a similar formula to have been a little less tidy. There are examples here, here and here, the latter being the Soccermetric version, derived by Howard Hamilton. The formula itself is below.
It's not anything a casual fan would use.
In one of his posts Hamilton goes so far as to claim that a more conventional Pythagorean for soccer simply isn't possible. Even some attempts that are decidedly simpler generally abandon the thing that probably gave James the impetus to name it the 'Pythagorean' in the first place—that every term had the same exponent (2 in his formulation).
That's not just a nice aesthetic characteristic.
There's a bit in that formulation which conforms to basic intuition about sports. Specifically, that if a team scores as many points as it gives up over the course of the season, it will likely end up winning as many games as it loses. For now just think about a binary win-loss game, like basketball or baseball.
There's no tying in baseball. That .500 winning percentage is built into James' formula. If Runs Scored (RS) is equal to Runs Allowed (RA), and we have a uniform exponent, then without even plugging any numbers in you can see that it's x/2x, which is .500. Even among the "simpler" models linked above, best-fitting soccer Pythagoreans end up having three unique exponents. That looks something like this ('goalsaway' should almost certainly be 'goalsagainst'):
That's Martin Eastwood's formula. Let me be clear: I have used this formula in the past and it generally gives totally acceptable results. But think about a weird situation where a team scores, oh, exactly 19 goals and gives up exactly 19 goals. They win half of their games—freakishly having 19 1-0 and 0-1 results—to collect the maximum number of points possible, 57.
By the Eastwood Pythagorean, Team 19-19 projects to pick up 69.0 points. Sure, that's an outlier of a season in a couple of ways but something something Leicester. Point is, that's a non-trivial 12-point miss on what we'd think should be the most easily predictable outcome (on average). That and there is no chance of remembering 1.22777, 1.072388 and 1.27248 if you're working on the back of a napkin.
So we want a Pythagorean that's easy to use, easy to remember and we would like for it to fit a the basic intuition about scoring and results. Oh, and we want it to accurately measure the thing we're trying to measure: which teams over- or underperformed. Really we just want something that looks like the original. Baseball has one, basketball has one, even other football has one. Why can't soccer? It can. Mostly.
There are two tricks we first have to use. The first isn't really a trick. It's more of the obvious response to the fact that there are draws in soccer. And because of that, winning percentages are much lower in soccer than baseball or basketball. So instead, we set up to predict the percentage of points taken from the max available. Again, this is a pretty self-evident and not-at-all-original workaround. The other attempted James-like soccer Pythagoreans I came across also did this.
The second trick is a little less obvious.
We have to pretend time stopped somewhere around 1994. While England was an early adopter of awarding 3 points for a win in the early 80s, it wasn't until its usage in the 1994 World Cup that the rest of the world finally decided to play along. By 1995 it was pretty much the standard everywhere.
Prior to that though, teams received two points for a win and one for a draw. If we reconfigure the league tables to look like something from the 80s we can build a single exponent Pythagorean that quickly satisfies our third condition (fitting intuition).
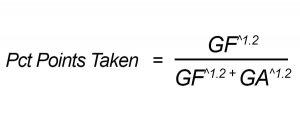
Now if a team scores as many goals as it gives up, it'll probably pick up half of the total points available. (2*W + 1*D)/2* Number of Matches = Percentage of Points Taken = GF^c/GF^c + GA^c It's the Jamesian Pythagorean, even if we don't yet have an exponent (or even know if we can get one; spoiler: we can). If GF = GA, again we end up with x/2x and our equation predicts we'll pick up half the total points available. Under the old 2-points method, there were 76 max points available. Say you scored 50 and gave up 50.
Maybe something bizarre happens and you drew all 38; or you won 10, lost 10 and drew 18; or won 15, lost 15 and draw 8. As long as you win and lose the number of games (you necessarily have to draw the rest), you'll pick up 38 points. Half the max total. As for the other requirements. Yeah, it's pretty simple. Once you do the math you get an exponent of 1.2 (this is very much in line with others' results). So our Soccer Pythagorean is:
Again, this assumes that wins are still worth just 2 points. How well does it work? Pretty well. Using the 2010-2011 through 2014-2015 tables from La Liga, Serie A and the EPL (I skipped the Bundesliga so that we had uniform 38-game leagues in the sample), we're off by 2.74 points.
That's root mean squared error, which, if you're not familiar is just what it reads as. So, take the predicted percentage of points (the results of our Pythagorean above), multiply that by the total points available (76).
That gives us the predicted total points for a team's season. Now take the difference between the predicted points and the actual points (the ones teams collected in real games). That gives us 300 predictions and measures of how far off we were from those predictions. Here's what that looks like in some raw R output.
The 'Pythagorean_%' column is what we calculate from the above formula. 'Available_Points' are the old school max available points (2 * 38 = 76). Multiply those together to get our 'Predicted_Points'. 'Adjusted_Points' are what we get when we take actual, real world points and convert them to 2-point wins (or Pts - W). Subtract 'Adjusted_Points' from 'Predicted_Points' and you get the 'Difference', or your errors. For RMSE, work backwards; grab all your errors, square them, take the mean, then take the square root of that mean. That's where the 2.74 comes from. Going back to Hamilton's model he says that the RMSE for his soccer Pythagorean ends up somewhere between 4 and 5 (although for the single season he does on that page he gets 3.81; for the one from last week it's 4.5). Eastwood does 10 seasons, all of the EPL, and gets 4.08.
Another way to look at it is that in our 300 seasons, for 90 of them our prediction is within +/- a single point. So we're doing much better, right? Well, even though the formula 'works' with a 76-point season, time actually moves forward pretty relentlessly and current, actual seasons are 114-point seasons. That leaves us with two problems. First, we're going to have to figure out how to map the 76-point season to the 114-point season.
That almost certainly will increase our errors. Not even almost, it does.
Second we're going to lose some of the elegance that makes pretending time stopped so delightful in ways that has nothing to do with aging. Take the first problem first. Say a team accumulated six points in the 2-point world. They could do that by winning three games, by winning two games and drawing two, or by winning one and drawing four. In the 3-point world those translate to nine, eight and seven points respectively.
There is no way to perfectly translate from one to the other. But it's close. Just an ordinary least squares regression gives us a good formula for translating from the past to the present.
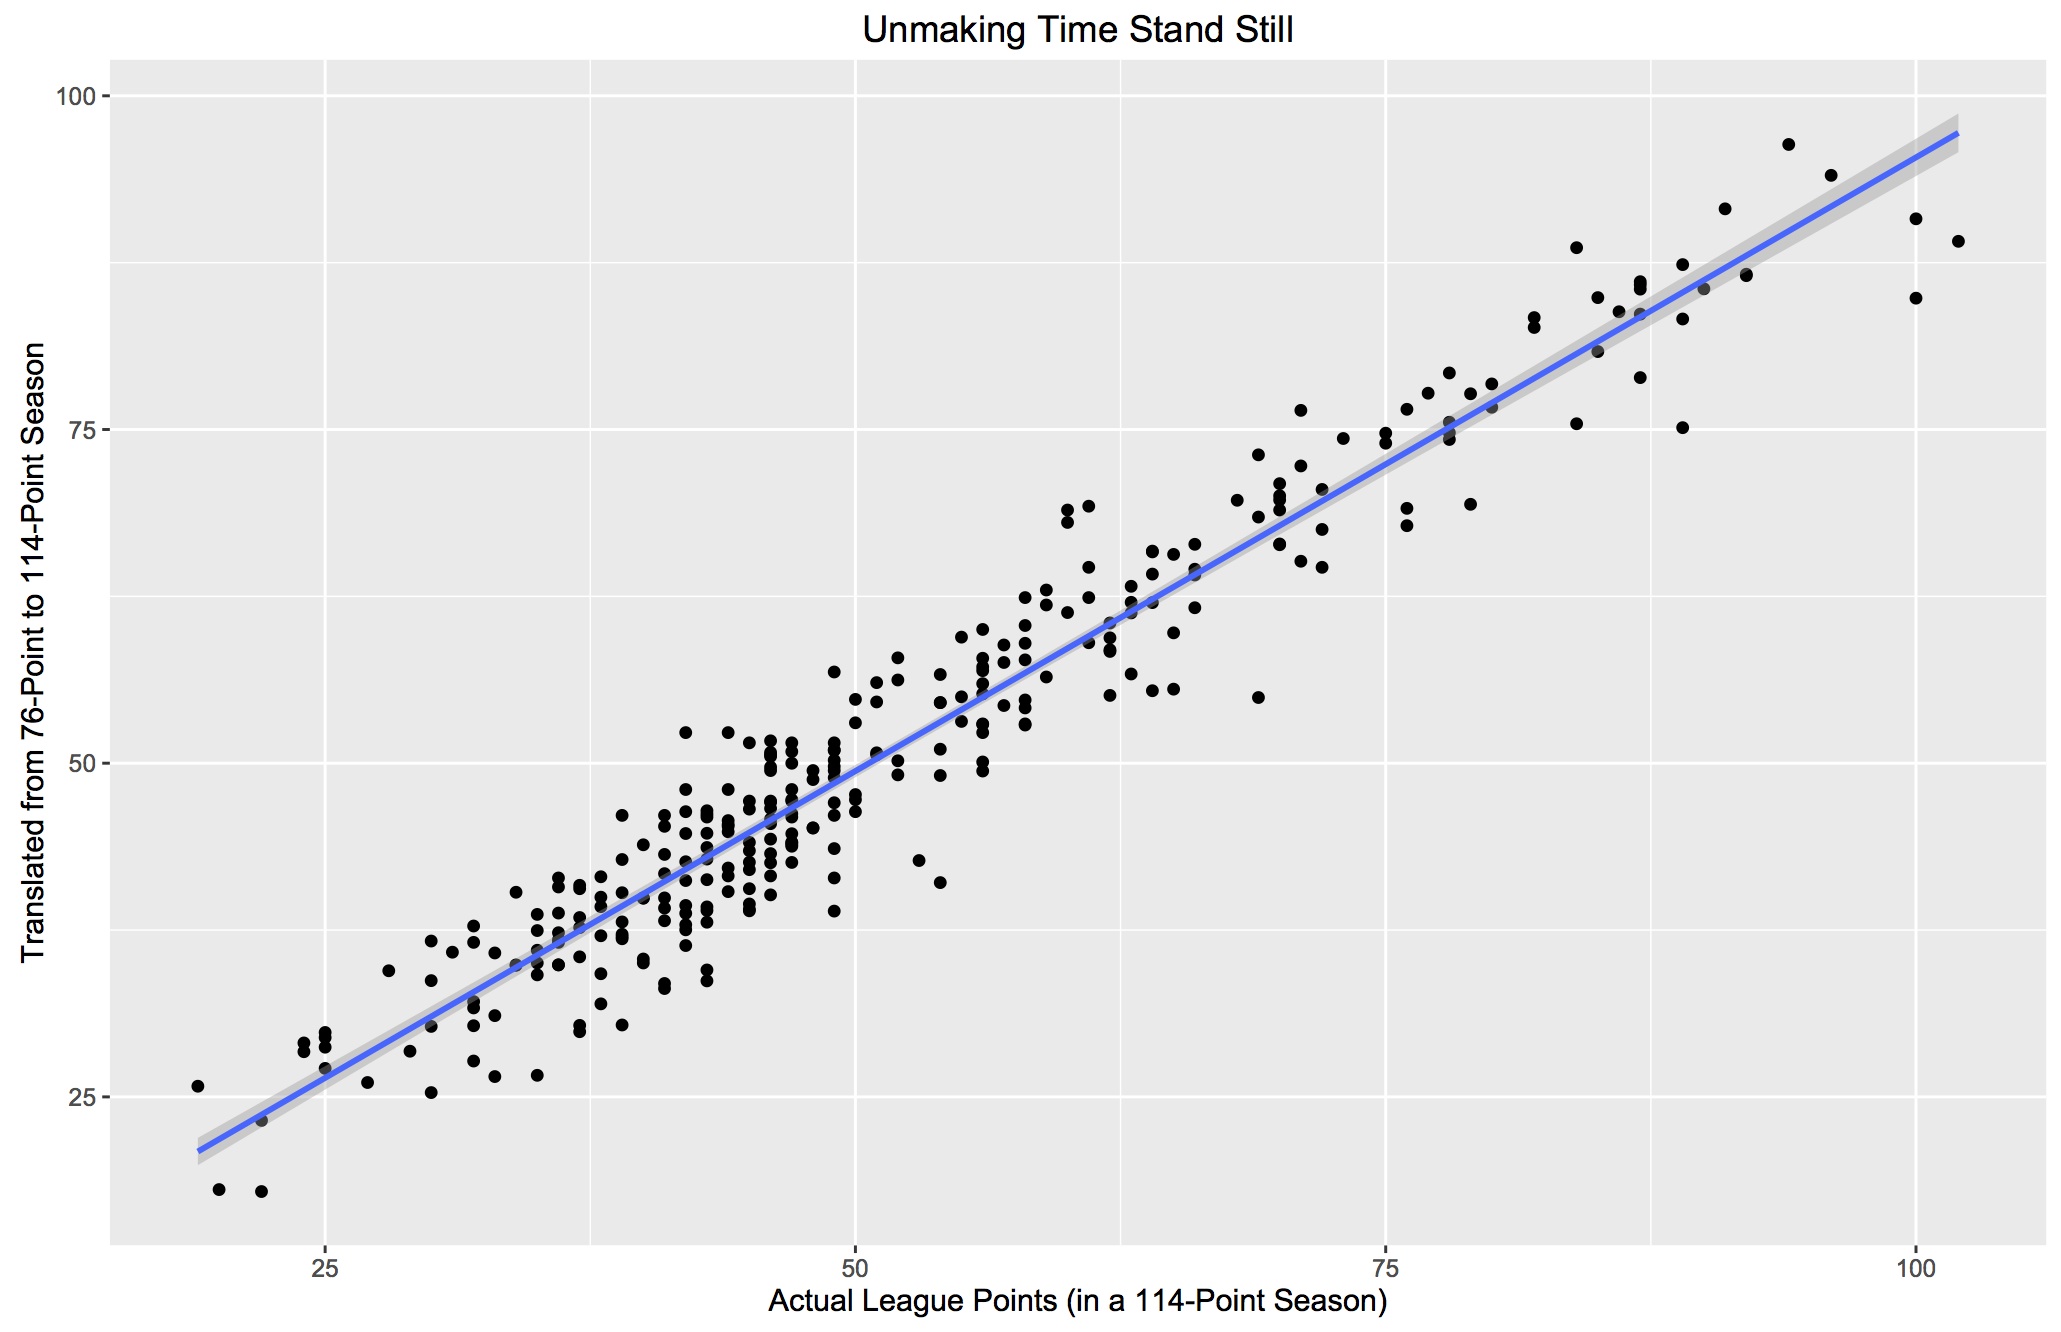
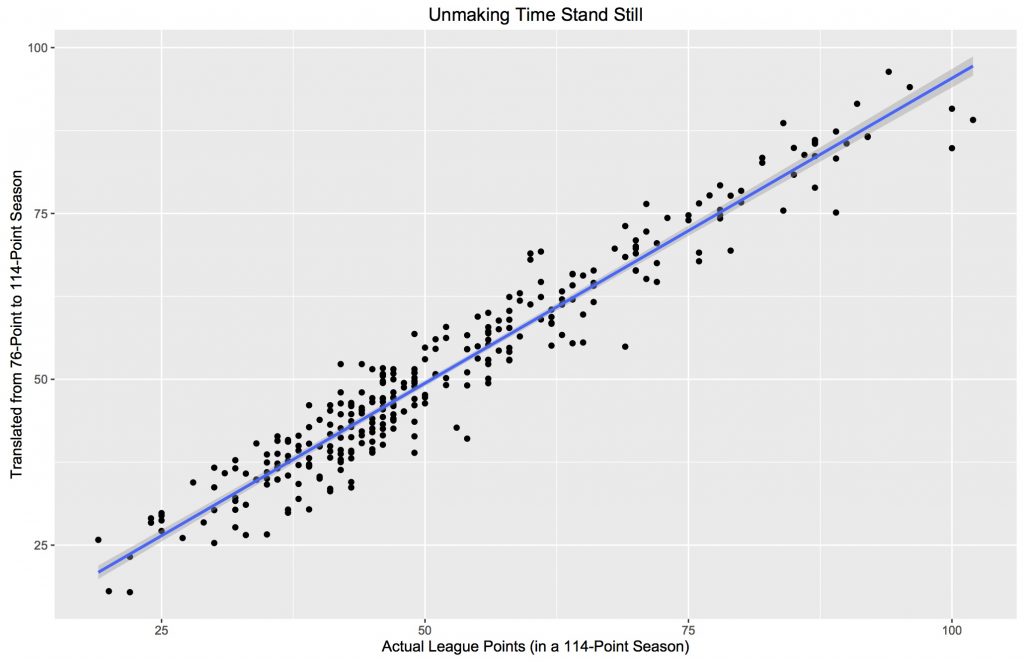
This is what our actual 300 team seasons look like compared to their values converted from 76-point seasons to 114-point seasons (our R-squared here is .992 but because this is derived from our sample, it's not immutable and a larger set might give us something slightly different).
Now after we transform our predictions to conform to the passage of time, we get a RMSE of 4.35, which is not terrible.
It's not great but 61 of all our predictions (just over 20%) are still within +/- one point. We're not entirely done, though. There's a way to take a James-like Pythagorean and convert it to a linear formula. You can read the paper here, but it involves a Taylor series and taking derivatives and some math you probably don't want to deal with.
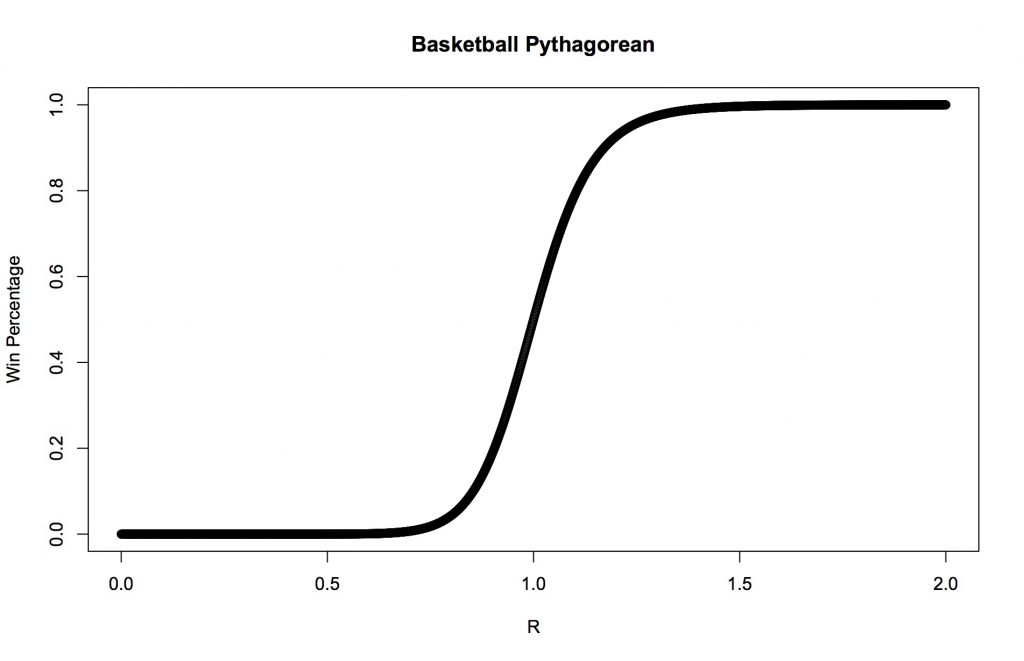
Putting aside all the calculus you've forgotten, there's an easy visual explanation to show why we can approximate something so non-linear with just a straight line. This works better with basketball, where the Pythagorean exponent is 13.9. The plot below is of the win percentage as a ratio of PF and PA.
The best teams in basketball outscore the mean by about 110% and the worst teams underscore it at 90%. So the ratios are actually narrow around 1. If you notice, the curve is pretty close to a straight line over that range. After you ignore all the math in the paper linked above and just scroll to the bottom you find the linear approximation to the
Again, we have to turn our two tricks. We use percentage of total points taken instead of win percentage. And we pretend that wins are still worth two points. Gamma is our Jamesian exponent (1.2), and Rave is our average runs, which makes no sense in soccer. They don't score runs, they score goals. Use the average goals scored in a season across all teams.
We still have to update to 3-point totals, but because we're running one linear formula, then dumping the results into another linear formula, we can just perform a little substitution and combine them to get a single linear formula. Once you do that, voila (GD is our goal difference, if that's not obvious): 
Pretty cool, and simple and nice and it's based on a win being 3-points. It does have one huge caveat1. It's kind of meaningless until the season is over. Just look at it. Say you play your first game of the season and win it 1-0. That formula says you'll have about 53 points. You'll actually have three. Hell just from last week to this week in the EPL, the RMSE across all 20 teams dropped from well over 8 (admittedly terrible) to a little over 7 (thanks, Stoke, for not even bothering... twice!). This season is weird, though. Fortunately, just eyeballing the GD, points and remaining schedules, a few of the biggest errors have a decent chance of coming way more in line with their predicted points. Except Everton. The Gods are using Everton for their own amusement.
Overall the fit on completed seasons isn't too bad. Our RMSE is 4.7. Not great. Not terrible, but we're not really doing substantially worse than any of the other options (although our mean absolute error, which doesn't punish you quite so much for the large misses on the ends, is just 3.57). Of our 300 team seasons in the sample, 92 are +/- 1 point; so about 30% of the time our predictions are within a single point of a team's actual points. Also, we are neither over or under-predicting as 152 of our errors, almost exactly half, are above zero. For a 38-game season (less than half the NBA, and not even a quarter of an MLB season) that seems surprisingly decent.
Moreover, it turns out it's almost entirely Spain's fault we're not fitting better (and probably measurably so). Here are our eight worst misses by over-prediction: Barcelona, Barcelona, Real Madrid, Real Madrid, Manchester City, Siena (?), Barcelona, Real Madrid. With a smaller coefficient (13.9 vs. 1.2), the soccer line is approximately linear over a wider range than in our basketball illustration above, but not one wide enough to accommodate scoring 110 goals and giving up just 21 with any precision. Stupid Barca. On the other end, the worst under-predictions are almost entirely one man's fault: Paco Jemez. I love just everything about Jemez and Rayo, except for what his attacking philosophy does to this model.
If you think it's better to lose 9-1 than to stop attacking at 4-0 and minimize the GD damage, you're going to engineer anomalous point totals relative to goal differences. And of the five biggest misses, Rayo is responsible for three of them. Math doesn't like heretics. So the idea that we can't do a simple soccer Pythagorean, I'm going to go ahead and disagree with that one. You can make a decent single-exponent Jamesian Pythagorean for soccer with acceptable results. You do have to cheat and make some bad assumptions about space time, but even after correcting for that, we're in the same neighborhood error-wise as things that are far more complicated.
Moreover, we can reduce our two-step Pythagorean to a single, one-step linear approximation. With nothing more than a team's goal difference, you can do better than a back-of-the-envelope job finding if a team under- or over-performed. That's kinda cool. Admittedly, if you're just typing a single line of code into a stats app, then calling any of the other, more complicated functions is in some sense no more or less arduous than what we've done here.
And if you really want to shave off that extra .5 of RMSE, then knock yourself out. But I've got almost no chance of recalling some of the other formula off the top of my head or being able to derive them in a pinch. But our simplest formula? It's very, very close to: (2/3 * GD) + 52. I can commit that to memory easily. And even if I forget it, as long as I can remember 1.2, I can rebuild it in just a couple of minutes. I'm probably biased (read: definitely), but something I can easily access is slightly more useful, even if it's still not totally elegant. @bertinbertin 1
Okay, maybe the caveat is a little less huge. Danny Page suggests the following, making me feel incredibly stupid for not thinking of it. The tweet is here. But the meat of it is: "Regarding the huge caveat what if you included games played? (0.677(GD)+52.39)*(GP/38)" I hadn't. And doing so, quickly brings results more in line with, well, all the other results. There is also a spreadsheet with his results here.


