Back in November we applied a clustering algorithm to find out which Premier League clubs had similar attacking styles. We wanted to see what we could find using match summary stats that anyone with an internet connection could get hold of. Our main rule was that we wanted to avoid using pure outcome stats, e.g. shots on target, completed passes, completed crosses, goals, assists etc. We thought we'd run the risk of just clustering teams together on how good/lucky they'd been so far. We didn't use anything too fancy, just per game stats based on the way teams attempt to attack; shots from outside the box, inside the box, open play, set pieces, short passes, long passes, dribbles, crosses and how much they use the wide areas when they attack.
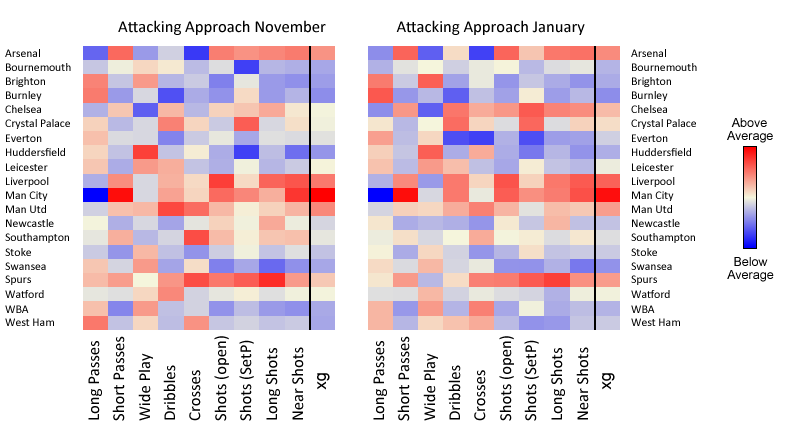
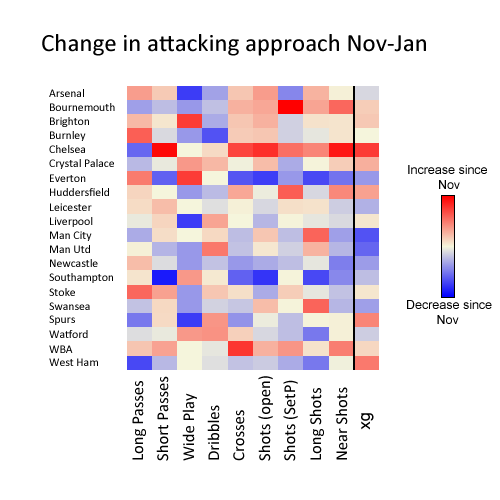
We were happy with the results, for a start they made sense, 6 of the top 7 teams at the time were in the same meta-cluster and were generally teams you'd expect to spend matches on the front foot. So this was a good first step but we knew at the time the real test would be to use exactly the same method later on in the season to see whether a) we got similar, stable clusters and b) to see how attacking styles had changed over the season. You can see in the picture below how attacking styles looked in November (after 11 games) and now (after 22 games). We still get 6 main attacking clusters and most teams have kept a similar attacking style across the season but some have changed and we discuss this below. You can see the main diagram comparing attacking style clusters below and we discuss cluster changes in the rest of the article. A quick note is that the heatmap summaries now include xG per game but this wasn't entered into the clustering model.
Updated attacking clusters from November to January
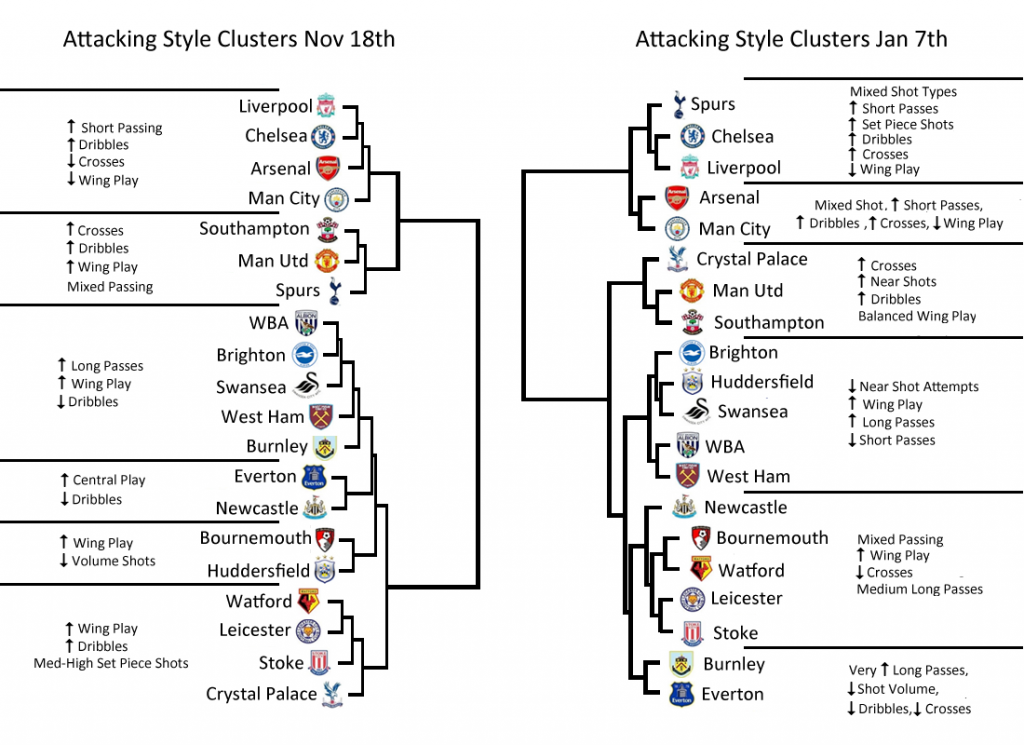
The first thing to notice is that in both the left (November analysis) and right (January analysis) cluster trees we see at the start everything splits into 2 branches. The best way to describe this is the analysis immediately spots a ‘Top 6’ and ‘Rest of table’ style difference. This might provide a bit of an explanation for why we don’t see ‘clear’ mid table teams anymore (as discussed in this article.) It seems a lot of it could be explained by attacking approach.
(Most of) the top 6; Chelsea, Spurs, Liverpool, Arsenal and City
Clusters 1 (98% certainty) & 2 (91% certainty) -
(average xG per game= 2 , average points per game= 2.1)
Unsurprisingly the top teams here are pretty similar in that they all play attractive front foot football; a lot of short passes, dribbles, crosses and a lot of attempts on goal. They can be split into smaller clusters though on one main stat, City and Arsenal don't generate nearly as many shots from set pieces as Spurs, Chelsea and Liverpool. Maybe a missed opportunity? (Not that it's affecting City too much.)
Out of these clusters City and Liverpool have probably changed the least, their figures are around the same as they were in November except they are having more shots from range. Perhaps that's due to teams moving ever further towards a strategy of setting up to be compact and deny space inside the box. This has worked somewhat as City's xG per game has dropped slightly. Liverpool haven't changed much either except they've also shown less focus on playing wide and their xG hasn't changed much either.
Over the last couple of months Spurs appear to have had slightly less of a focus on width and dribbling and played fewer long balls, they haven't been mixing up their passing as much as they did earlier this season. Arsenal have changed in the opposite way, they've slightly increased their number of long balls, crosses and dribbles per game implying that they have been slightly more direct, and while it has increased the number of shots per game that they are having it hasn't shifted their xG per game much.
Chelsea have been the standout changers within this cluster, after a slow start they've shown increases across pretty much every attacking stat. They have played more short passes, crosses and generated more shots in all situations and distances. Their increase in xG and rise in league position appears to well reflect this sharpened attack.
The Manchester United - Southampton (and Palace) Axis
Cluster 3 (96% certainty)
(average xG per game= 1.5, average points per game= 1.35)
Manchester United and Southampton belong to the same cluster together once again but now Crystal Palace join them. Although United and Southampton don't produce a huge number of attempts from open play they have both done quite well from set pieces, Apart from that their play is fairly balanced between the wings and central areas and they have a slight focus on short passes compared to the league average. Within the cluster Southampton have seen a drop in efforts on goal per game and Manchester United have also seen a small drop in close range efforts on goal per game, while both have shown a drop in xG. Palace on the other hand have shown an increase in xG.
Direct and Wide: Brighton, Huddersfield, Swansea, West Ham and West Brom
Cluster 4 (98% certainty)
(average xG per game= 0.9 , average points per game= 0.92)
Most of the teams here focus on playing wide, playing long passes and generate more shots than average from set pieces. Despite a wide focus, they don't put a lot of crosses in and generally don't attempt many shots per game whether from close or long range. Although their attacks aren't generating a lot of shots, Brighton, Huddersfield and West Brom are having slightly more shots from open play and set pieces than they were in November so they are moving in the right direction. Brighton are showing more of a focus on playing wide than they were earlier this season. One thing that unifies these teams is that although they've all seen an increase in xG per game since November none has a prolific attacking threat, they are all at least a good finisher away from safety.
Flexible Passing and Balanced Width: Bournemouth, Newcastle, Leicester, Watford and Stoke
Cluster 5 (90% certainty)
(average xG per game= 1.1 , average points per game= 1.07)
The core of this cluster has stayed the same as it was in November: Leicester, Watford and Stoke but now Bournemouth and Newcastle have joined. They are similar to the teams in cluster 4 in that they focus on more direct passing but they generate slightly more shots per game and focus slightly less on playing wide than the teams in cluster 4. Most of these teams haven't changed a lot since November apart from Newcastle have been attempting more dribbles and long passes than they did earlier this season and Bournemouth who are generating a lot more shots in all situations since November. Perhaps that has something to do with the return of Callum Wilson?
Defensive teams: Burnley and Everton
Cluster 6 (83% certainty)
(average xG per game= 0.9 , average points per game= 1.39)
It's fair to say that the clustering of these two teams together possibly depends more on the defensive statistics that we haven't included in the analysis than the attacking stats that we have. In fact both (along with Leicester) are the only top half teams with negative expected goals per game differences. Both teams play a high proportion of long balls and don't generate a lot of shots, but the ones they do generate they seem to use well. Quite a big surprise is that both teams are below average on shots from set pieces and considering they look safely in the top half of the table already, if they added goals from set pieces to the mix then maybe we'd be able to enjoy watching Barcelona vs Burnley in the Champions League next year.
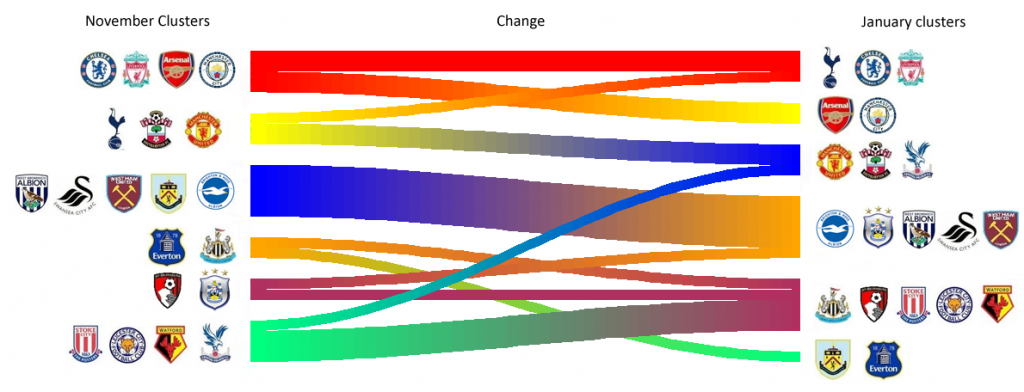
How much cluster change from November - January?
If the clustering method we used can find changes in attacking style then we'd expect it to see some changes in the flowchart below from November to January although if the clusters are reliable then most teams will stay together in clusters (unless every team undergoes extreme tactical changes). The diagram shows how teams have changed in similarity of attack since November. The main thing to notice is that generally the same teams that clustered together in November cluster together now. There have been a couple of big changers style wise, Palace are now in the same attacking style cluster as Man United and Southampton rather than more direct lower table teams. Everton now occupy the same attacking style cluster as Sean Dyche's Burnley matching both managers extreme pragmatism.
A focus on teams that changed manager
It's worth focusing on the teams that have changed manager so far his season because if anyone is likely to have drastically changed styles it would be them. We're not including Swansea or Stoke in this discussion as they only changed managers a couple of games ago but the others are summarised below.
Everton stand out because the Big Sam effect has meant that they've toned down their whole attack showing reductions in everything across the board apart from the fact that they now play more long balls and play wider. Looking at the cluster diagram they now are most similar in style to Burnley who have also been effective at converting the few chances they create in every game.
Crystal Palace have hit a decent run of form since Roy Hodgson has come in and they're now more similar in style to Man United and Southampton, this has mainly been based on the increased number of crosses they've been putting in and a slightly increased focus on playing wide, dribbling and putting in more crosses this has coincided nicely with Wilfred Zaha finding form again over the last 5 or 6 games and in general providing much more of a goal threat.
West Ham also haven't changed too much in attack since Slaven Bilic left although under Moyes they don't play as many long balls or have as many shots from long range. Interestingly this has coincided with an increase in xG per game, their increased trust in their creative players and playing through midfield seems to have paid of form wise and xG wise with the most noticeable difference being the improved performances of Marko Arnautovic.
Unsurprisingly since dumping Tony Pulis West Brom have shown an increase in attacking stats across the board. This is mainly reflected in the increase in the number of crosses they have and shots they generate per game but this has meant they've only had a slight increase in xG per game. Despite this they have yet to show much cutting edge in terms of finishing and as such they still belong in pretty much the same attacking cluster as they did earlier this season with Swansea, Brighton and West Ham.
Summary
Of the five teams who changed manager at least a month ago only Palace and Everton have massively changed their style of attack. There's probably a bit of a bias here because most of the managers that were bought in came in at teams near the foot of the table who were shipping goals and their priority was to stop that happening. Although Roy Hodgson gets lumped in with the ‘safe pair of hands’ managers, he seems to have focused on improving attack as much as defence the most.
This can be seen both in Crystal Palace's rise through the table and the fact that they have the fourth best improvement in xG per game after Chelsea, Spurs, and West Ham and are now most similar in attacking style to Man United and Southampton. At first when we saw this cluster we were skeptical but then we noticed that Crystal Palace and Southampton are the biggest under-performers when you compare goals scored to actual expected goals scored, and that they should have scored around 11 goals more than they have and Southampton are around 5 goals below par.
Overall the clustering method we used has shown that while styles are stable and can be identified at different points throughout the season the approach is also sensitive enough to pick up on slight changes. ____________________
Written by Mladen Sormaz and Dan Nichol who together are Proform Analytics