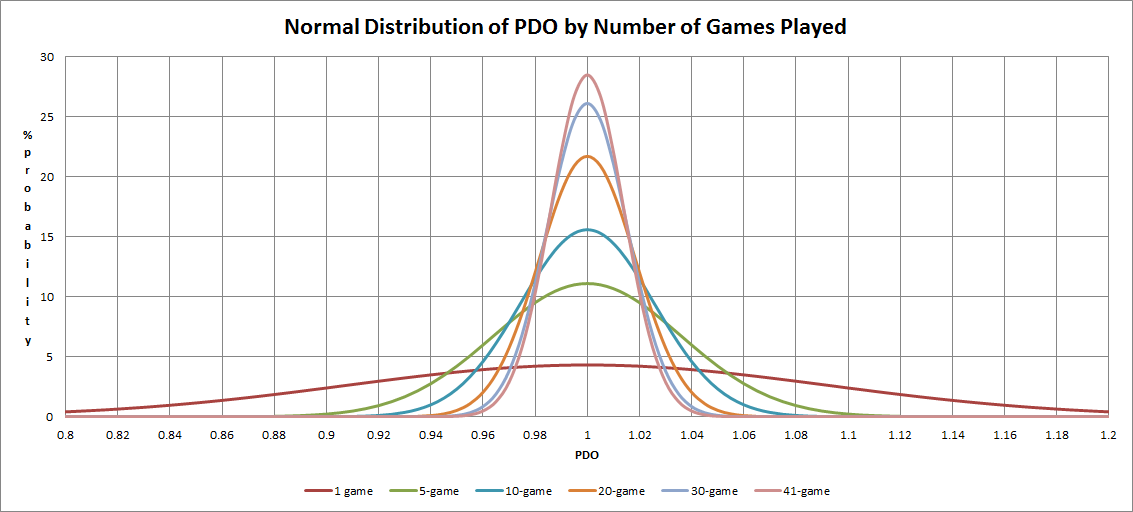
Some of you clicked on this just to ask, "WTF is PDO?" Which is fine - we take all kinds here.
The seeming acronym doesn't stand for anything - it was the online handle of Brian King who created the stat in hockey. The definition of the metric PDO is listed below but Wikipedia actually has a page for hockey analytics, so if you want to know more click here.
PDO – Uhhhh…
I’m just going to copy the definition from James Grayson.
“PDO is the sum of a teams shooting percentage (goals/shots on target) and its save percentage (saves/shots on target against). It treats each shot as having an equal chance of being scored – regardless of location, the shooter, or the identity or position of the ‘keeper and any defenders. Despite this obvious shortcoming it regresses heavily towards the mean – meaning that it has a large luck component. In fact, over the course of a Premiership season, the distance a teams PDO is from 1000 is ~60% luck.”
Now you may have seen an occasional tweet from me expressing displeasure with the use of this particular metric, but I've never actually sat down to detail why I think it's dumb. Today I will do that.
Reason 1) It's Theoretically Flawed
Why? Because it treats all shots as equal.
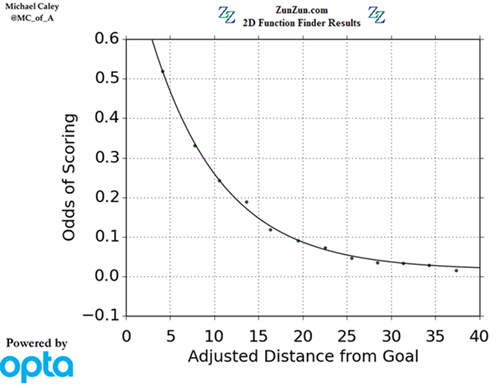
Here's a clue: All shots in football are NOT equal.
Not close. Look at it visually.
This is from one of many pieces by Michael Caley discussing expected goals metrics and it clearly shows all shots are not equal based on distance alone.
Then you add in the whole headers are a lot harder than shots with feet thing that Colin Trainor did way back when and POOF there goes your theory and your metric, and we haven't even gotten to all the other factors that impact a shot's probability of being a goal.
It's kind of sort of fine in hockey I guess because shotqualityomgwtfbbq, but it's just fantastically dumb to use anything that makes this assumption in football.
If you need an image in your head to help explain all of this in personal terms, picture yourself with a football on a football pitch facing a goalkeeper. You take 20 on target shots at the goal from 20 yards out in the center of the pitch.
You also take 20 on target shots at the goal from 6 yards out in the center of the pitch. Which one of those scenarios is going to yield more goals?
Reason 2) It Combines Attacking and Defensive Conversion As If They Are Remotely Related They aren't. Teams technically have infinite choices in how they attack and how they defend. They don't have to be related at all. Therefore, why would we treat them as if they were?
You can have a normal, straightforward average attack and a league leading defense. Or you can have an attack that consistently creates insane chances and pairs it with a defense that gives up exactly the same.
Or you can... well, anything.
The point is that by combining the two separate phases of play into one metric, you miss out on the signal.
"Hey, this team is overperforming PDO!"
Okay, why?
THIS IS ALWAYS THE NEXT QUESTION, and if it is always the next question, then maybe you can - I DUNNO - treat the two phases separately and immediately jump ahead a step.
"This team is giving up far fewer goals than expected in defense."
Aha, now you have my interest. Tell me more.
"This team brought in an attacking assistant coach in the summer to try and boost the number of goals scored..."
Excellent, let's analyze that.
Wait... no team would actually do that in the current football landscape, but if they DID then this would be a very good thing to analyse.
Reason 3) Every Team Does Not Completely Regress
This is a fundamental nerd point, but the fact of the matter is that every team's PDO does not completely regress toward zero, even across multiple seasons.
Why?
BECAUSE ALL SHOTS ARE NOT EQUAL!
There are systemic reasons why some teams allow far worse chances season after season than others. If a team's defensive structure is such that the average shot distance it allows is from 20 yards instead of 15, your goalkeeper has more reaction time on average to make saves, there are likely more men between the ball and the goal, and the team is almost certainly going to post a better save percentage.
Or if you are a crazy high pressing team that tends to keep the number of opposing shots low, but the trade-off is that when someone beats your press they get awesome chances right on top of your goal, then your save percentage numbers are also going to look weird and are unlikely to regress to anything approaching average.
The same applies for elite attacking systems. Some head coaches have an attack that consistently creates better chances than average, which means their shots are more likely to go in the goal, and the team is more likely to post abnormal PDO numbers that have very good reasons to stay that way. And all of this is before we even touch the impact of super elite or sub-par players with regard to skill. One reason why it may look like teams revert to the mean over the course of many years is because manager or head coach tenures last between 12-15 months on average.
Start tracking these things by head coach tenure (or tracking head coach performance across different teams) and it yields a lot more clarity. A weird PDO by a team might be random variation, but there's a decent chance it isn't and for reasons you care about. Other ways of analyzing team performance would be a lot more insightful and should be examined first instead of simply assigning outliers to the random variation dustbin.
Conclusion
Regardless of its common usage in hockey, PDO is theoretically flawed in football and people need to stop using it. Yes, I know there may be data reasons why some analysts continue to use PDO, but as explained above, we should try to find a way past this at the earliest possible opportunity. Do something smarter that better relates directly to the sport you are analyzing. The good news here is that there is now a giant open space just waiting for a clever person to tell the world what they should be using in place of PDO, and that person could be you!

