After a short break away from football, numbers and banging my head against the keyboard I am back. My work here at StatsBomb has mainly comprised of all things Premier League forwards and their stats from 2008-13. Think of this article (and maybe one other) as a wrap-up of all the information I have on Premier league Forwards spanning from 2008 to 2013. Right now I want to look specifically at the relationships, if there are any, between some of the numbers I have previously looked at. Do shots and shots on target begin to decay as the ToP% increases? How about scoring%? Goals, even? Let's find out. This is all about decay as time (players minutes on the pitch) increases.
Shots And Shots On Target
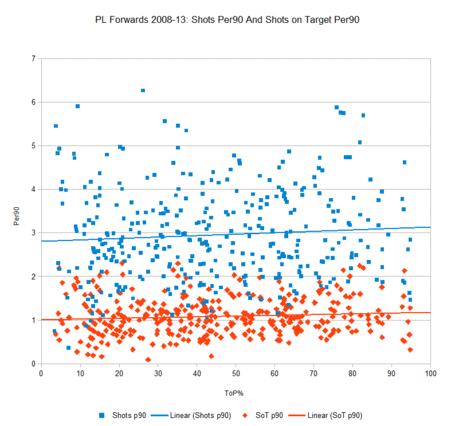
X axis=time (ToP%) Y axis=Statistic  This chart is shows us the relationship between time (x) and shots and shots on target per90 (y). This is the full sample of players in my database with no outliers removed. The correlations for shots and ToP% and SoT and ToP% are super weak, almost non-existent. But what we can see is a slight angling of the trend line: Shots increases from ~2.75 to 3.1 as we move from left to right. Shots on target increases from ~1 per90 to ~1.2 per 90 left to right. As we move upwards in the units of x (Time) the units of y increases slightly. If I had cherry picked the sample and discarded all players who played less than a league average ToP% (44.29%) then the trend lines would be much steeper. Alas, I wanted to use the entire sample. Reasons for Increase in Shots per90 as ToP% increases? It's probably to do with survivor bias. The players that play the most minutes tend to be the best players, the best players tend to be the one's who generate the most shots and shots on target, hence the slight upward slope of the trend line. The more minutes a player plays may be a rough proxy for talent, manager trust and an ability to stay healthy. The trend line indicates -ever so slightly in this full sample of players - that the more a player plays (talent?) the more shots and shots on target he registers.
Scoring%
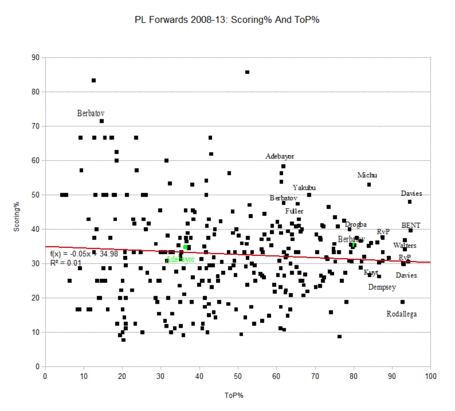
 Now we move onto Scoring% (goals/shots on target) with ToP%. From left to right we see the trend line is decreasing ever so slightly from 35% to 31%. Reasons why Scoring% decreases? I'd love to hear some reader comments on this. I'd probably need some more time to think about it, but a rough guess would probably look like this: The more minutes (ToP%) a player plays, the more raw shots on target he records. The more shots on target a player has the more likely it is that variance will wash out and his scoring% will regress toward the mean. Random Thoughts * Colin Trainor posted some excellent articles here on StatsBomb which looked at shot locations and shot placement maps (where on the goals frame the shot would have crossed the goal line) which questioned, if I understood it correctly, whether we need to sort shots on target by quality. As I was making this chart today some interesting information cropped up: Why does a player post such different scoring% numbers each year? Now, some players, like Messi and RvP are pretty consistent in terms of scoring%, this may be due to their shot locations and shot placements. But they are the exceptions, nearly every other player has their scoring% vary somewhat. This could well be down to shot location and placement as Colin stated. But what if a players location/placement varies year to year? Does this mean that the popular train of thought that a strikers main skill, that of shot location/placement, is non-repeatable and that there are other factors involved that influence a strikers shot location? If a players shots location/placement is stable year to year then why does the player suffer the dips and spikes in scoring%. If player X shoots from the same location, why doesn't he score as much? Does variance, non-skill factors, defensive pressure, goalkeeper position play a bigger role in a players season scoring% than just static shot location? If it does, it would go a long way in helping explain the variance in season-to-season scoring% and level of regression involved in scoring%. I have highlighted a couple of names on the chart above: Adebayor and Berbatov. Adebayor posted consecutive scoring% seasons of ~13%, 35% and 58%. Berbatov posted scoring% seasons of 35%, 72% (tiny sample), 47% and 35%. Are these numbers due to the lack of repeatability of locations/placements or are these two players shooting from the same locations and merely suffering through variance/bad or good luck? Or is there something we are not currently capturing? I guess what is part of the fun and debate, which is always friendly and aimed at trying to figure out what the hell is going on, is to discover just what drives stats like scoring%. What is the constituent make-up of scoring%, it's repeatability et cetera. This is why myself and Ted created this site. Any thoughts, comment away.
Goals Per90
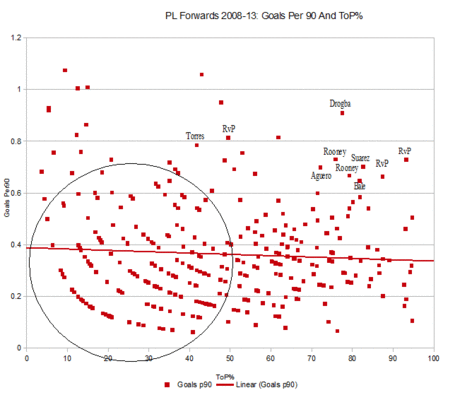
 This is goals per90 with ToP%. Again we see a weak correlation, but a slight decline in the trend line which indicates that as x increases y decreases ever so slightly. I highlighted some of the best goal scoring performances of the last 5 years in the top right hand side of this chart. Familiar names. I think it is pretty clear why goals per90 decreases over time, it is scoring% driven. The bottom left side of this chart is really cool. It shows the groupings of below league average ToP% players and the rate at which they score goals per90. Seems to be six or seven different bands of players featured in the circled area and each group has it's own talent level curve for goals per90. I checked the data before posting and it seems sound, but my those curves are mighty intriguing.
