First off, I'd like to recognize Napoli manager Maurizio Sarri for this quote:
Sarri was asked whether Napoli would bring in more reinforcements, but gave a rather damning response. “I couldn’t care less. I have to focus on the players I have and making sure they don’t make the same mistakes again. “The transfer market is for people who don’t want to talk about football, it’s something that bad Coaches seek refuge in.”
I wrote about how he was one of the coaches to watch in my Family Tree pieces but with quotes like the above and his quote in the same presser where he said: “Fundamentally, it is better to lose while playing well in the second half rather than win with the first half performance, as we really did not do enough." he is quickly becoming one of my favorite coaches. He also has one of the
most beautifully pure Italian Manager Wiki pages out there: 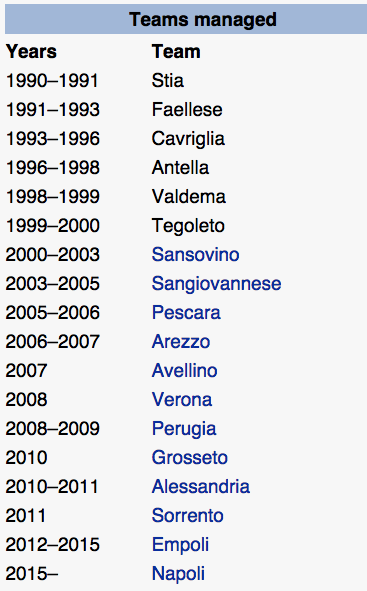
Anyway, that was so refreshing from coaches moaning about their inadequate players that I had to point it out. Onto the stats n' stuff from the weekend. It’s still very early and game states, red cards, strength of schedule and plain flukes add so much noise to all the numbers so I figure it’s best to look at the most robust data we have: passing data. We can try and learn a little stylistically and territorially wise from these opening weeks. Same as last week, as it's been only 2 or 3 games I will flit from team to team attempting to pick an interesting stat or chart to bring out instead of going deep. Passing Style First up we can see a major difference in how Dortmund, and fellow early dominator Leverkusen, play from the back so far.
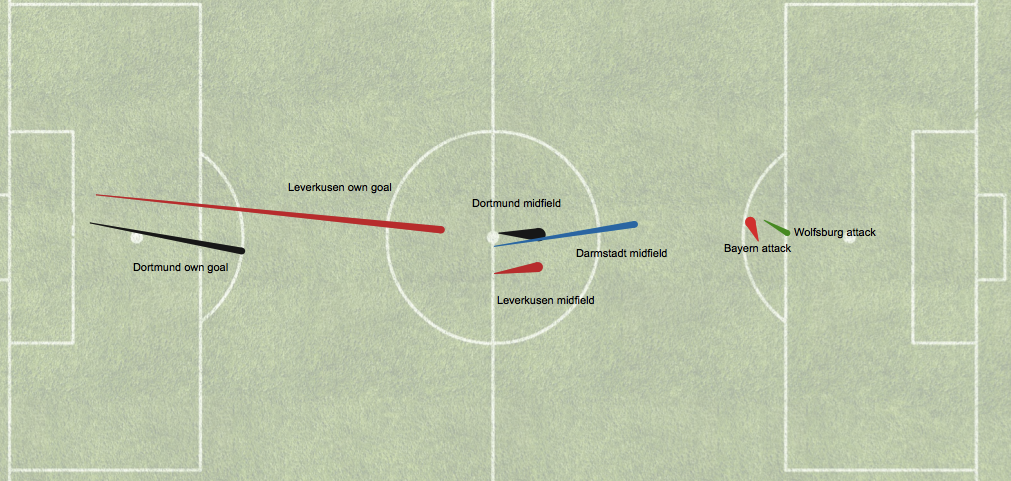
Hoffenheim and Hannover’s pressing likely has something to do with it, but Leverkusen are hitting it long instead of playing out intricately. In the midfield, we see the two teams are making very similar passes while long ball kings Darmstadt* blast it forward. In the final third, we see the result of Bayern patience facing blocks of defenders results in an average backwards pass that is likely to be completed (thickness of line) while Wolfsburg are hitting riskier forward balls. *Quick Darmstadt aside: they are completing almost exactly 50% of their passes and lead the leagues with multiple games played in average pass distance by a significant margin:
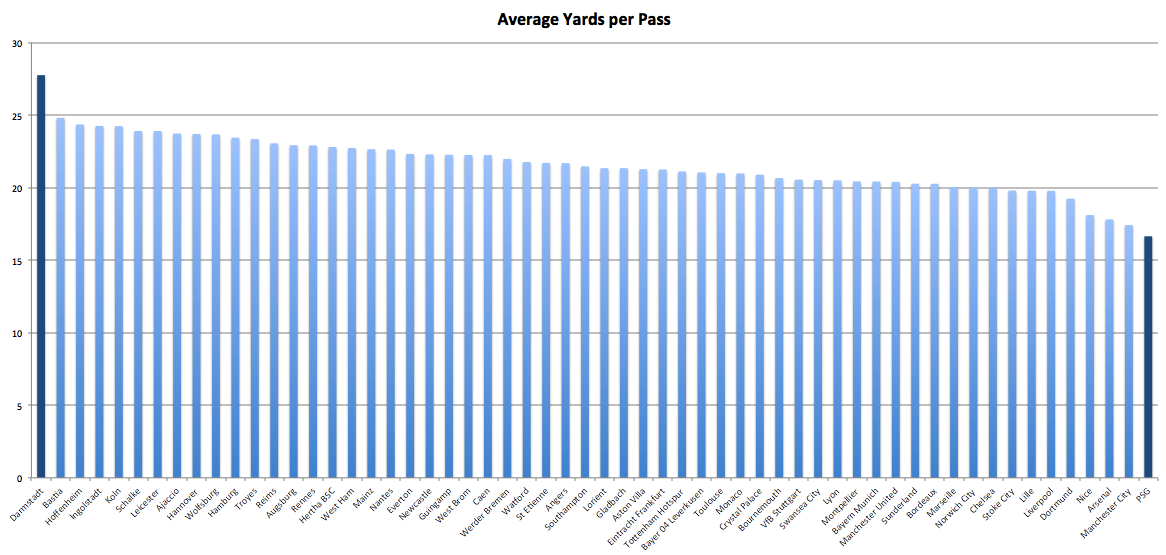
and taking a shot every 10 completions, which also leads those same 58 teams by a large margin. 3 of the top 6 look great so far: Bayern, Dortmund, and Leverkusen. Today we will focus on the other 3, all of whom have some early negatives. Gladbach It’s very early but there are worrying signs for Gladbach. They generally lead the league in % of passes played close to their own goal, but that has increasing significantly meaning they are spending even less time downfield. They are taking 53 completions to get a shot off, the most across Europe. Last year those stats didn’t matter too much as they excelled in passing, especially close to goal, and hassled opponents as they closed in on goal compared to the open field making. Neither has shown up this season so far:
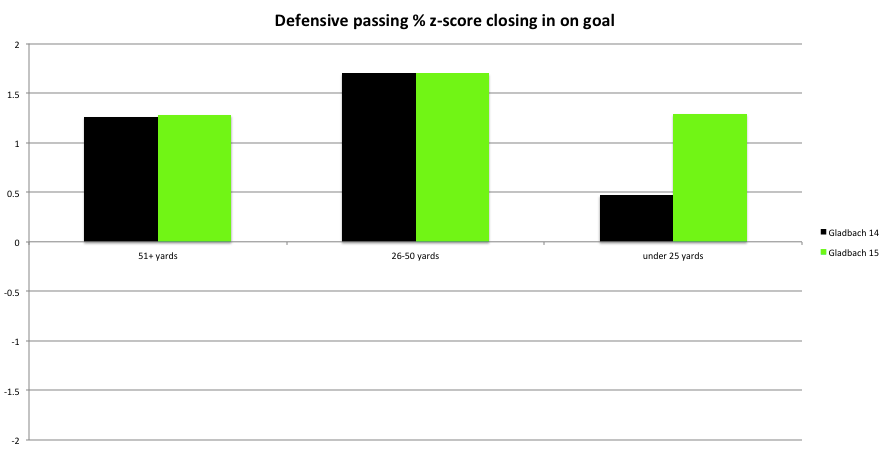
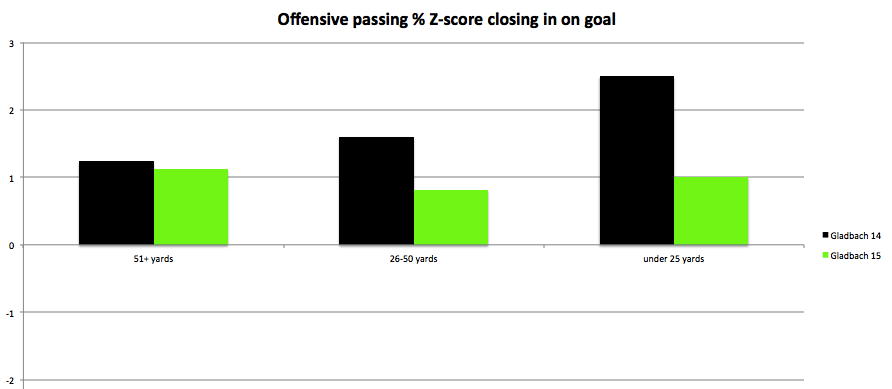
Those are z-scores, so standard deviations above the average completion %. 14 refers to last year, 15 these two games. Passing numbers generally stabilize somewhat after 6 games so this isn't totally worthless, even though Dortmund will always make your numbers look worse. Right now, Gladbach aren't any tougher to pass against close to goal as they are out in the wild. And they aren't passing better as they get closer to goal either. Schalke Schalke have a few early worries as well. Opponents are coming through the center of their defense too easily, a higher rate of final third completions come centrally against Schalke than against anyone else in Germany. To see how this effects the final ball, look at Schalke vs Mainz’s dangerous completions allowed map:
Schalke defense 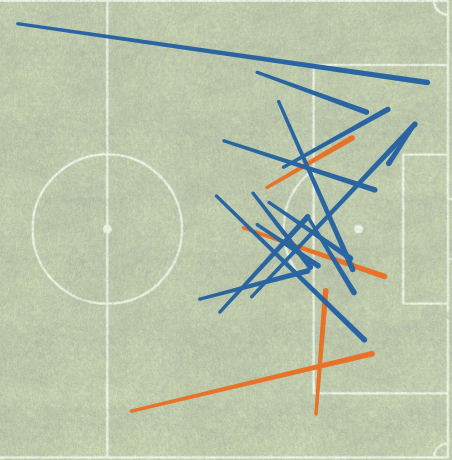 Mainz defense
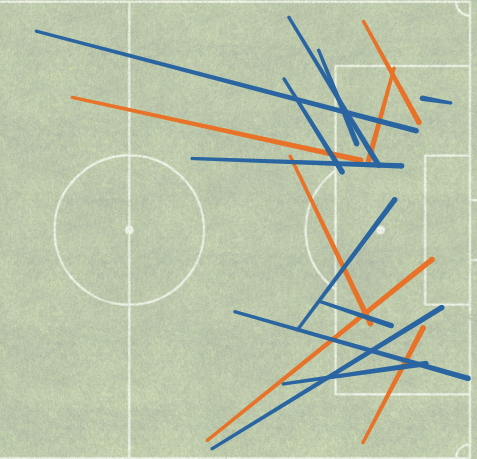
Passes that come from the center are more likely to be turned into shots and goals than those from out wide. Schalke couple this with allowing a quick tempo of shots allowed: 17 completions per shot. This might be inflated by playing Darmstadt, but then again it’s hard to picture the other top teams allowing Darmstadt to get 9 shots off when playing at home. Only Bayern and Stuttgart have taken more shots which sounds like a positive for the Gelsenkirchen side, but Schalke’s are coming from an average of 23.6 yards away, more than 4.5 yards further than the Bundesliga
average. Compare Schalke with Dortmund (closest average shot) below with Schalke in blue: 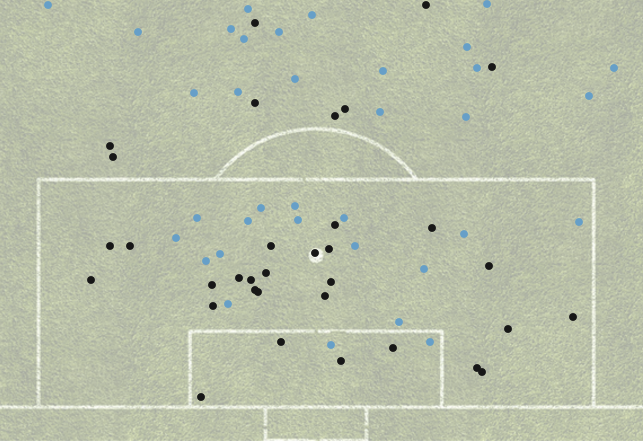
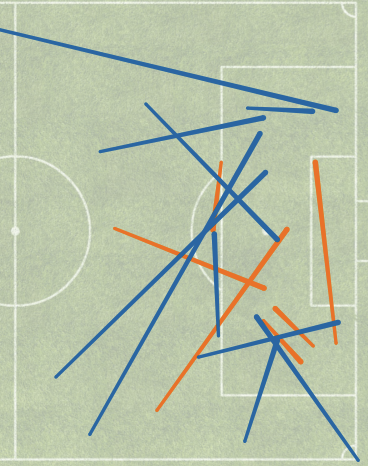
Wolfsburg Last years goal/deep touch rate was unsustainably high so Wolfsburg needed to consistently get the ball deep more to keep their goal total as high as it was. They are not doing so (t-8th most deep completions) and when they do get it deep, they are coming through the wings at a higher rate than anyone else. That’s how they did it last year, but it’s hard to pull off. Most of the best offensive teams are much more centrally based. We can see the wing-focus in where their deep passes come from compared to Werder Bremen:
Wolfsburg offense
 Bremen offense
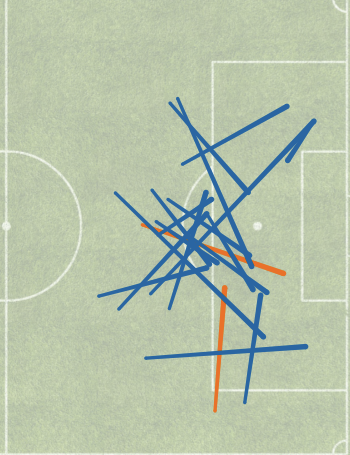
Two of these strugglers meet in one of the best and biggest games of the early season on Friday: Schalke visit Wolfsburg. That is simply a tasty appetizer for the main course of Bayern vs Leverkusen on Saturday. That game and those two teams will feature prominently in next weeks column. Research Break
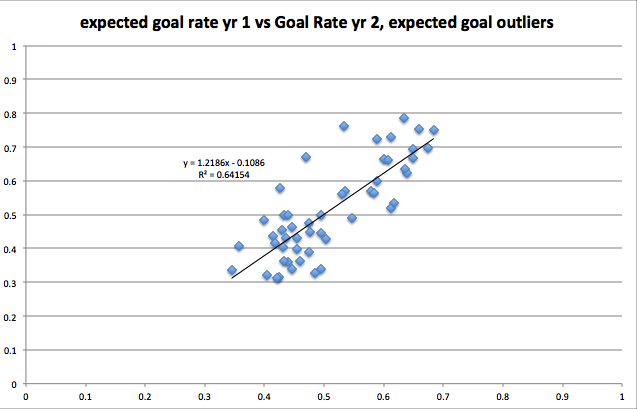
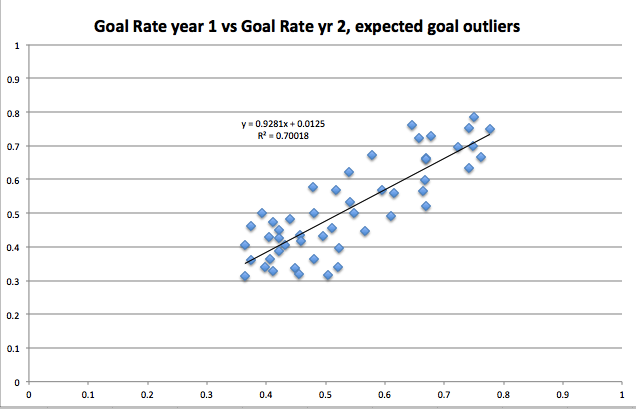 These two graphs show
the season after a team’s goal rate (GF/GF + GA) varies widely from the expected goal rate. There are 51 seasons in the sample and surprisingly goal rate predicts the next season slightly better. There were a good amount of “underperfomances” that didn't have a year 2 because the teams were relegated. Is this a case of trying to use expected goals for something it’s not suited for? Is it only accurate in-season and it’s not useful to compare year-on-year? Is my model (header vs foot, game state, some team shooting and blocking skills) not good enough and something like 11tegen11’s model or Michael Caley’s that consider significantly more factors can beat goal rate easily. Or is expected goal rate not as useful as we think it is? One of expected goals simplest and arguably most important uses is to identify which teams are lucky or unlucky. If it can’t beat goal rate from one season to another on those anomalies, it opens up new investigative opportunites into what exactly these models are missing.
Ligue 1 Notes Marseille allowed 94% completion on passes more than 60 yards from goal to Troyes last weekend, a higher rate than any game from last season. Goodbye Bielsa…I’ll try to convey who is dominating the space, as Brendan would put it, in one graph. This is a extremely rough 3rd order expected goals, based on how often deep completions are turned into goals and also how often a completion leads to a pass which turns into a goal. It's not as precise as it sounds likely or I am overrating how precise it sounds but
There are large variances between teams when it comes to stopping shots from deep areas or turning deep completions into shots so look at this as more of a “Who is dominating territory” chart, which I am starting to think of as an OBP equivalent for my baseball fans. Ligue 1 as a whole complete 31 passes per shot, in Germany it is just 24. EPL Notes Man City are completing 55% of their passes in the Red Zone (final 25 yards or so) while West Ham are at 21%. League average is 35%...Defensively, Watford, Stoke, and Bournemouth are the toughest to complete passes against deep so far. The easiest team to complete passes against within 25 yards of goal are Crystal Palace but right behind them are Chelsea. This won't surprise you if you read James's piece but it's quite the change from last year when Chelsea were 2nd toughest in this category. This year they have been worn out (blue complete, orange led to shot). The right side has seen the heaviest volume but
passes from their left side have led to more shots: 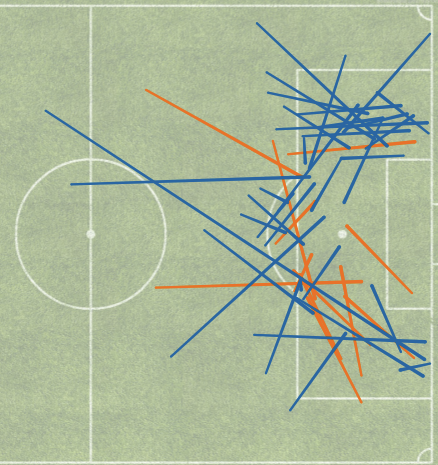
Mourinho knows this, as James so clearly pointed out in his excellent comparison of Mourinho-face these last two seasons. And before you Stoke fans get too happy about your tough defense near
goal, here’s the map of your completions allowed: 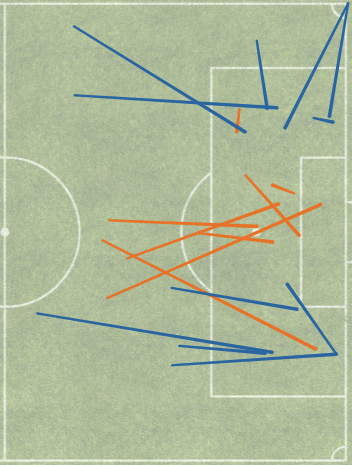
That’s a lot of right-down-Broadway completions to allow in 3 games. Until next week. Comment below or reach me on twitter @Saturdayoncouch.

