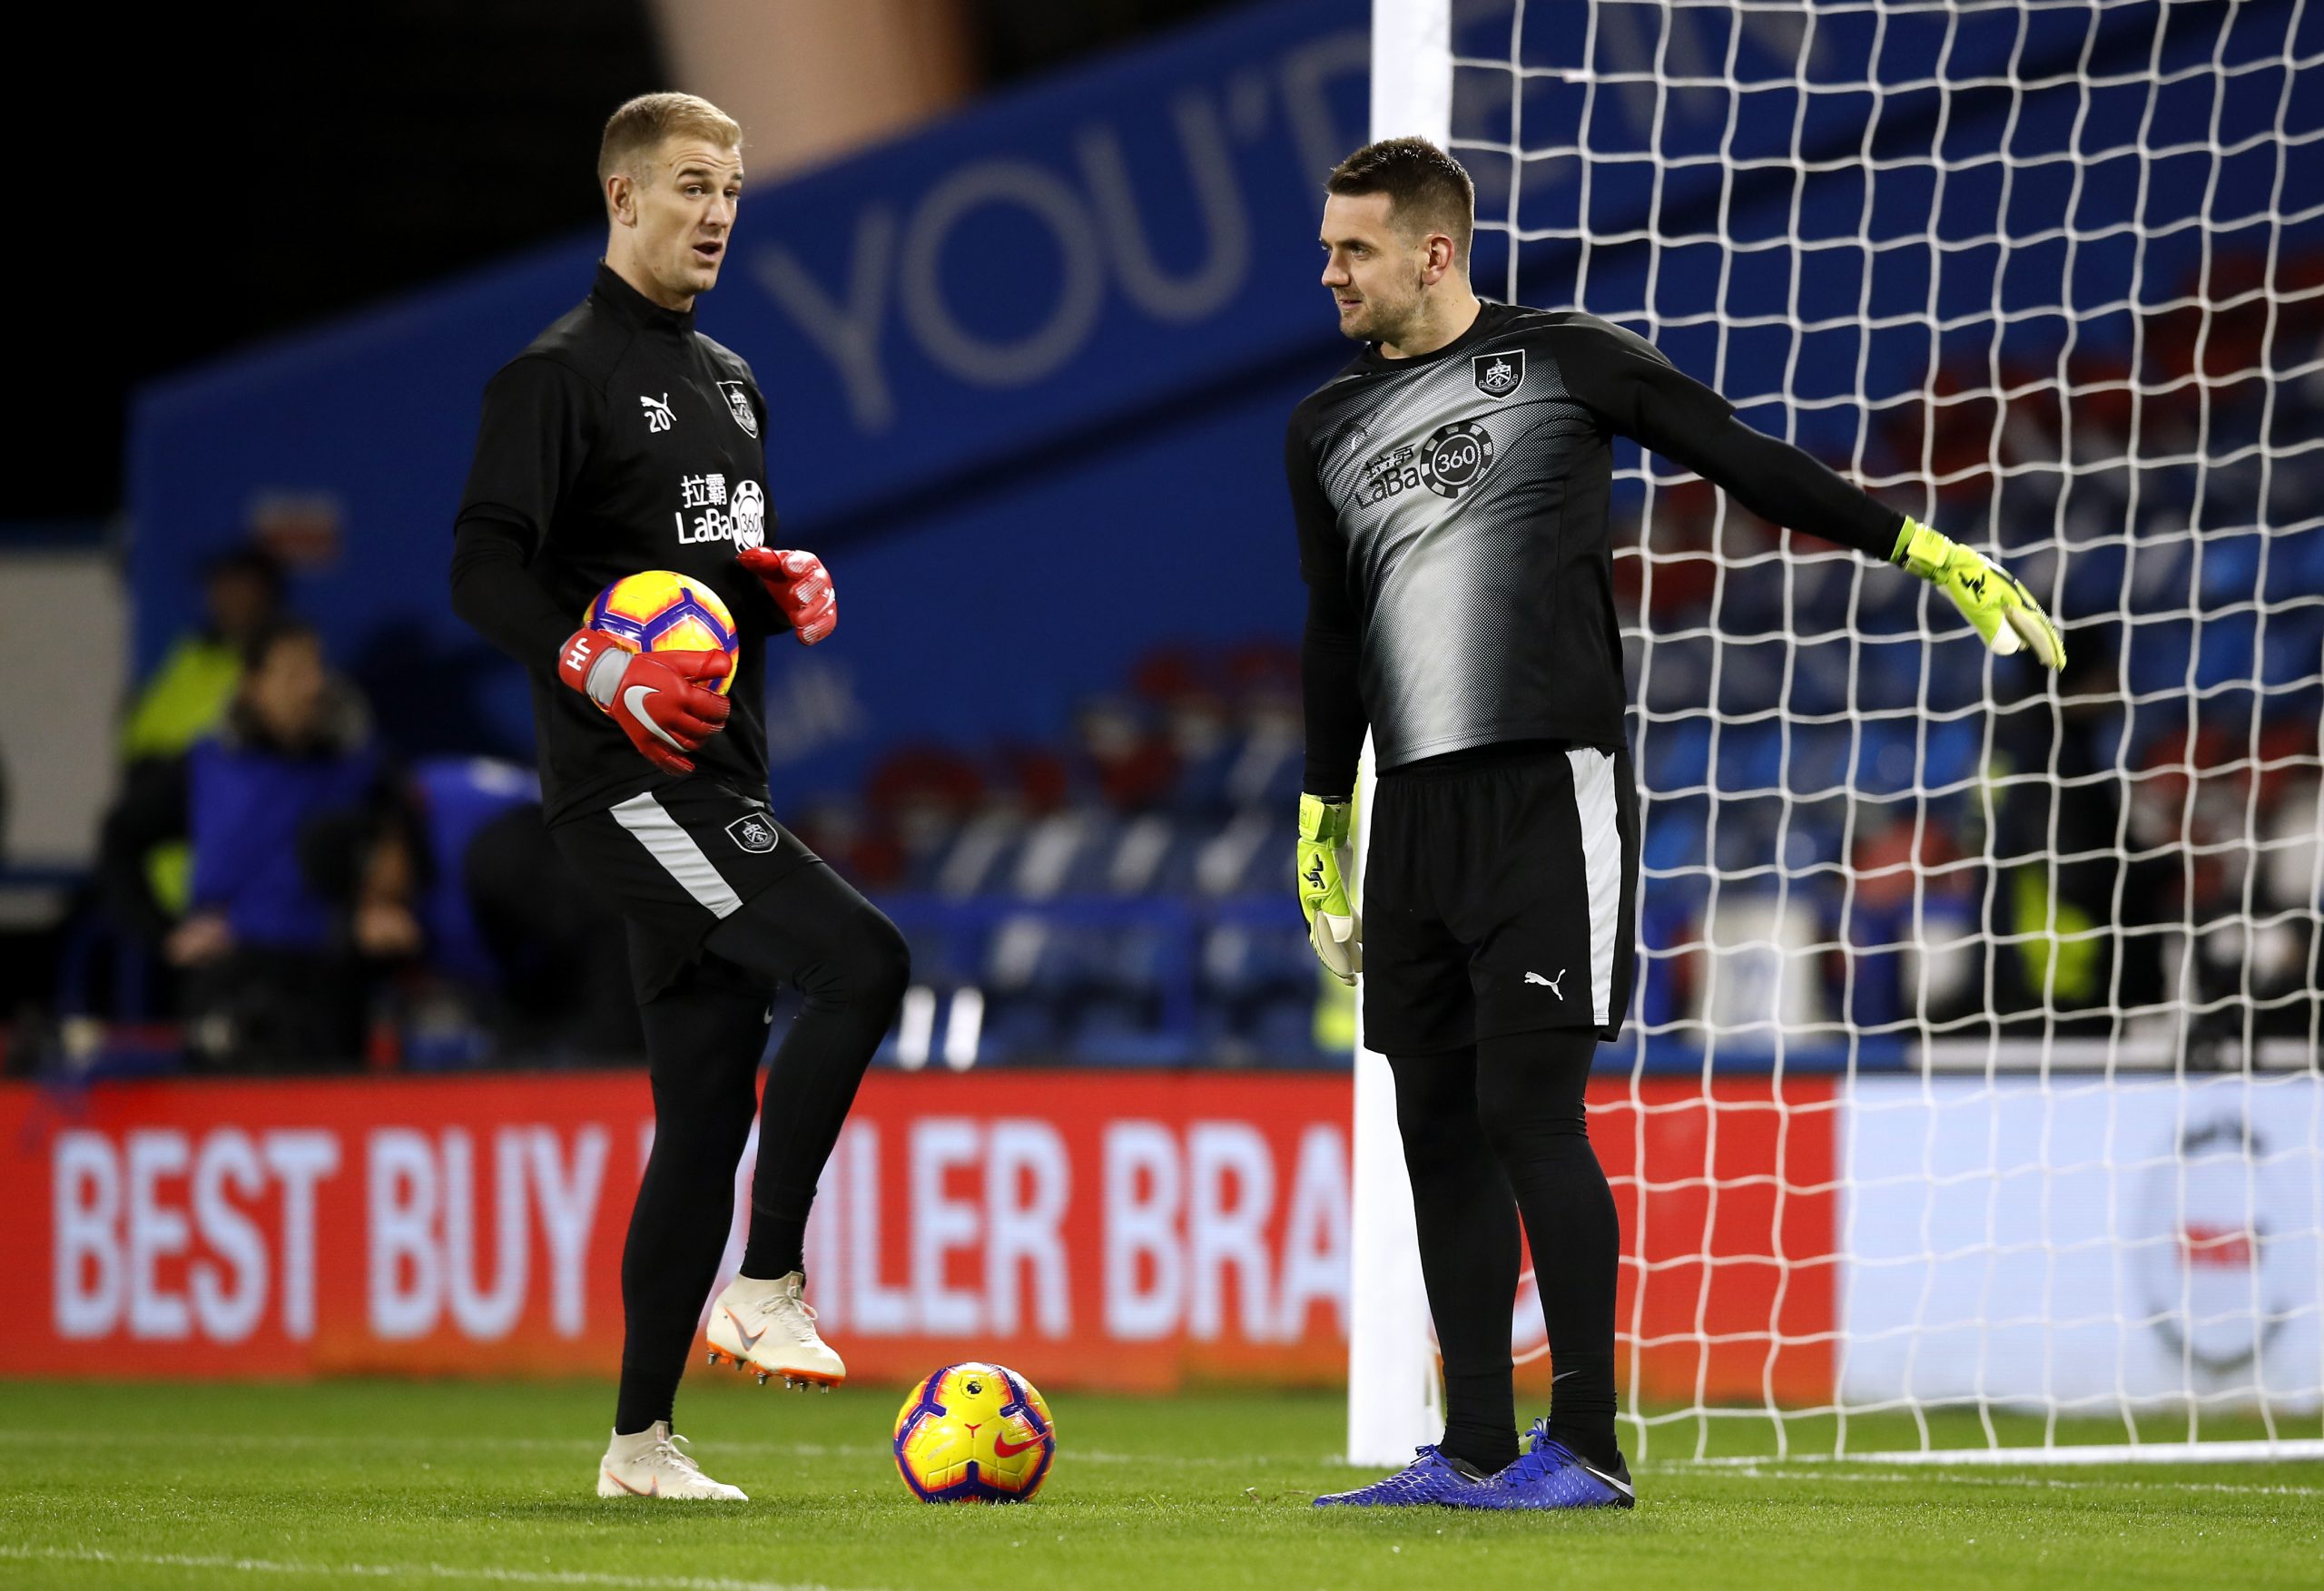
Sean Dyche is at it again. After an absolutely miserable start to the season, Burnley have now gone seven games without a loss. After spending the first half of the year looking like relegation candidates they now sit in 15th place, tied with Brighton and Hove Albion three points above the drop. Burnley’s improvement is real. It’s supported by a dramatic change in their underlying expected goals numbers. 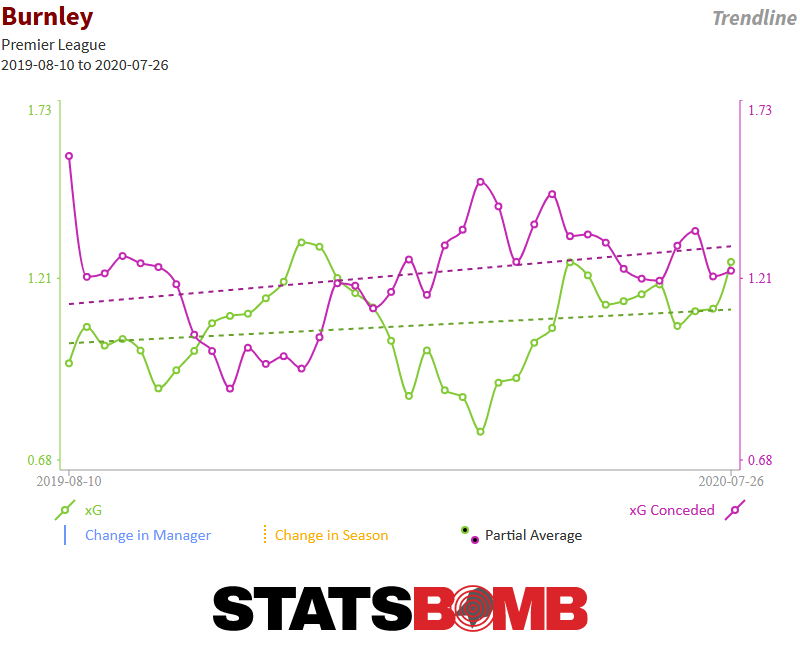 The vaunted Burnley defense had simply utterly collapsed over the first half of the year. The most plausible story of Burnley’s success (at least the most plausible won’t that wasn’t based on them being a cosmic joke instigated by the soccer gods on evil number wizards everywhere) was that Dyche’s teams did something in defense that tricked expected goals models. Somehow they turned modest defensive success into nearly unparalleled defensive solidity. Of course none of that really matters if instead of putting together defensive numbers indicative of modest success, the team is out there dumpster fire-ing every week. And that’s more or less what going on for the first half of this season. But then, something happened. Burnley changed keepers. Seven games ago Tom Heaton stepped back between the posts, and Burnley changed. The relationship between a keeper and his defense is difficult to untangle. There are things like shotstopping which are almost entirely within a keeper’s purview which we can measure, but other things get more complicated. The kinds of shots the opposition is taking for example are often a complicated mix of decisions made by attackers, defenders and defenses. So, it’s important to be cautious about making bold claims about causality. But, what’s absolutely clear is that Burnley’s defense when they play in front of Heaton looks totally different than when they play in front of Hart. Let’s start with the easiest stuff though. Heaton has been much better at stopping the shots he’s faced this season than Hart was. In 19 games this season, Hart gave up roughly four more goals than expected. Not great.
 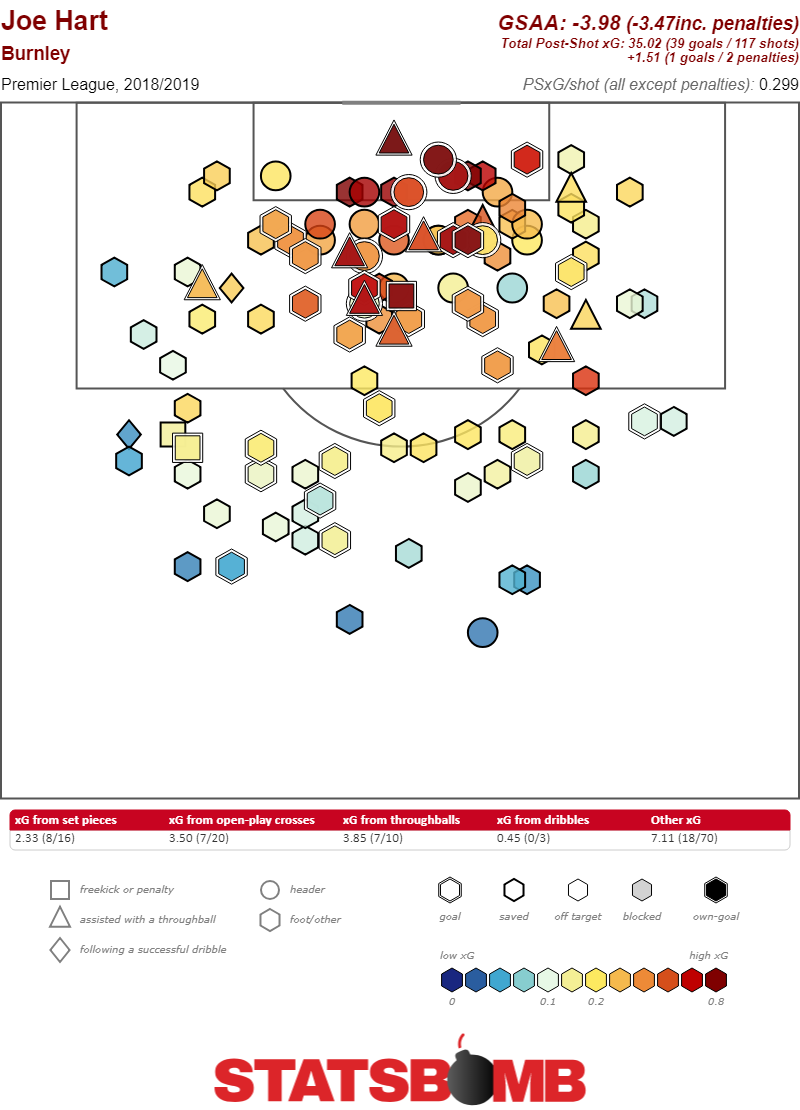 The difference between his save percentage of 66.7% and his expected save percentage of 70.1% is negative 3.4%. Of the 24 keepers who have played more than 600 minutes this year only five have a larger negative difference. Heaton, on the other hand, has been fantastic.
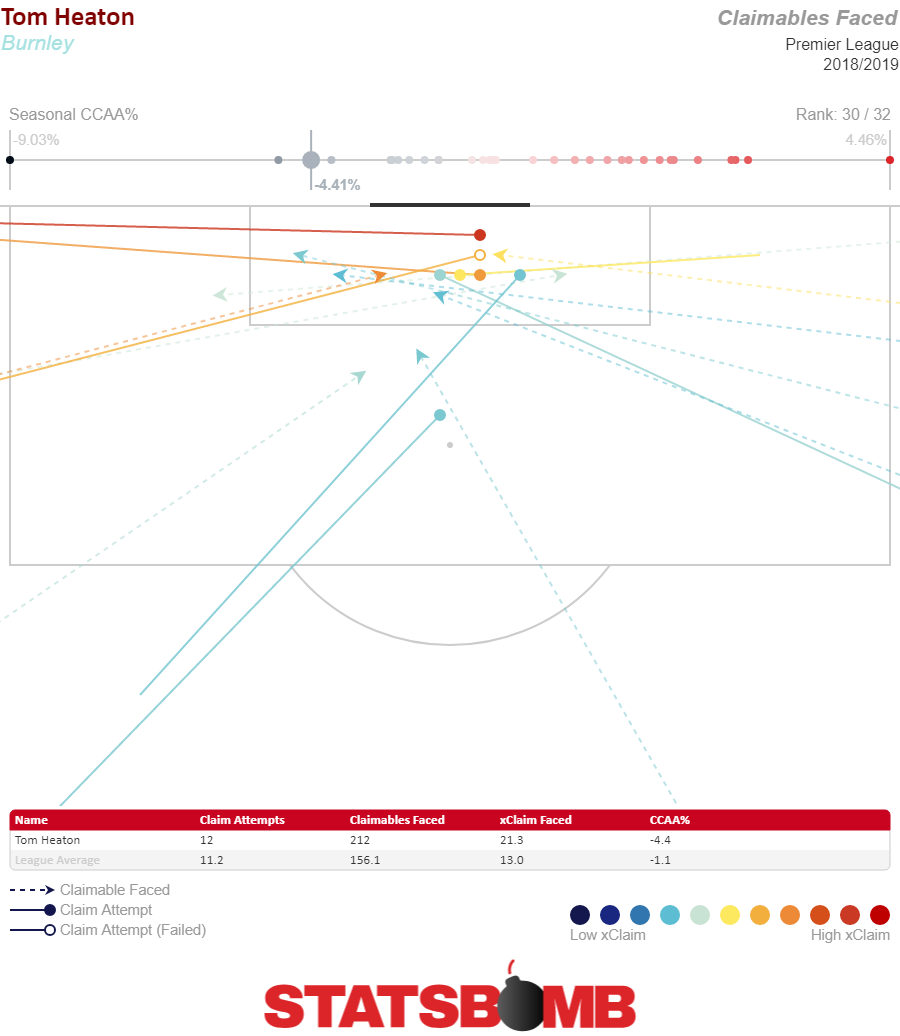
 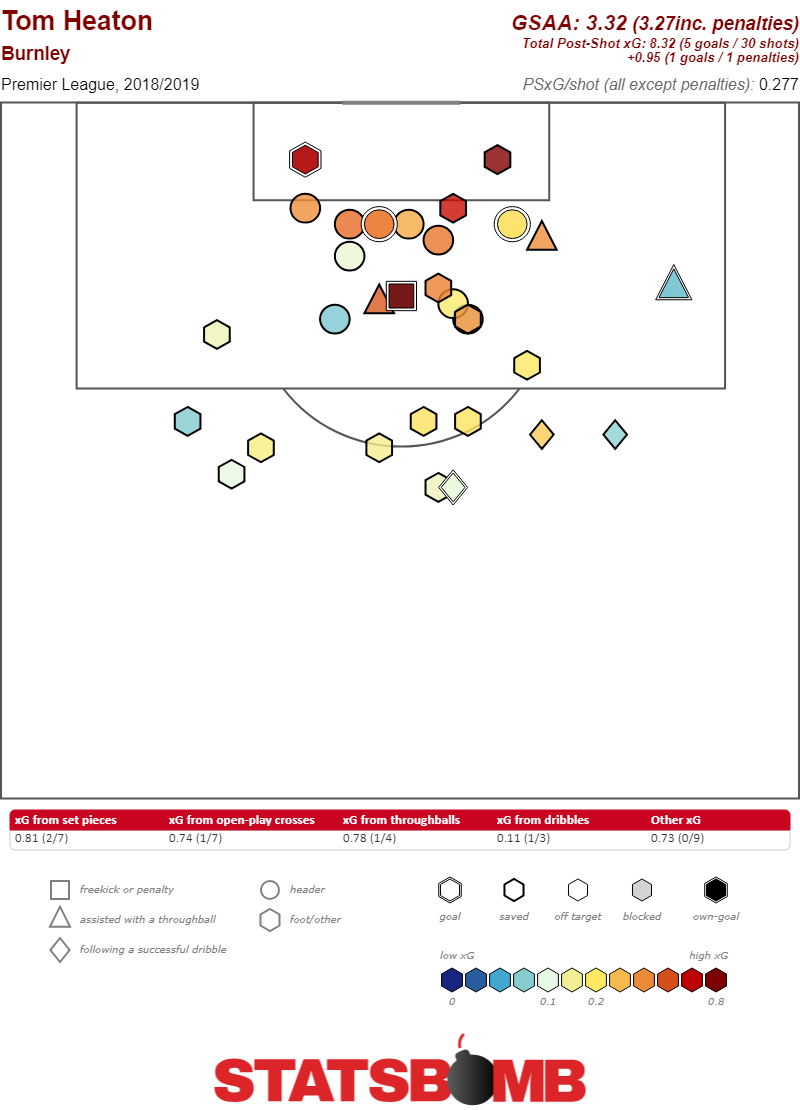 He’s already saved 3.32 more goals than an average keeper would. His save percentage of 83.3% is not only the highest in the league, it’s 11.1% higher than his expected save percentage. That gap is also the highest in the league. He’s been absolutely phenomenal. So, one thing that’s going on is that Heaton is just saving a lot more goals than Hart was and that makes a big difference. But, there’s more. Because Burnley’s defense is absolutely also playing better. With Hart in goal, Burnley gave up a whopping 19.58 shots per game and an xG per shot of 0.10. With Heaton those numbers have both improved. The side is currently conceding 13.57 shots per game at 0.08 xG per shot. They’ve both improved in terms of the volume and the quality they’re giving up. Some of that probably has something to do with the level of competition Burnley are facing. Their recent hot streak has come against West Ham, Huddersfield, Fulham, Watford, Manchester United, Southampton, and Brighton. There’s only one potent attacking team in that mix. But, even against that backdrop the defensive improvement is stark, and it’s worth investigating how the two keepers might be influencing it. No Burnley keeper is ever going to come across as aggressive. The conservative style the team plays means that a keeper’s job is to mostly stay at home on his line while defenders deal with things in front of him. Accordingly, Heaton has only attempted to claim 12 balls in the seven matches he’s played, when the StatsBomb model expects average keeper to come for just over 21. However, that conservatism is only evident in balls that are relatively unlikely for any keeper to claim. He’s claimed only five balls that the model suggests have a 20% chance or less of a keeper collecting, while an average keeper might collect 14. On the mode dangerous balls, the ones that keepers collect 30% of the time or more, Heaton is much closer to expectations. He’s attempted seven claims on 16 balls, right in line with what the model predicts. He’s succeeded on six of those seven attempts.
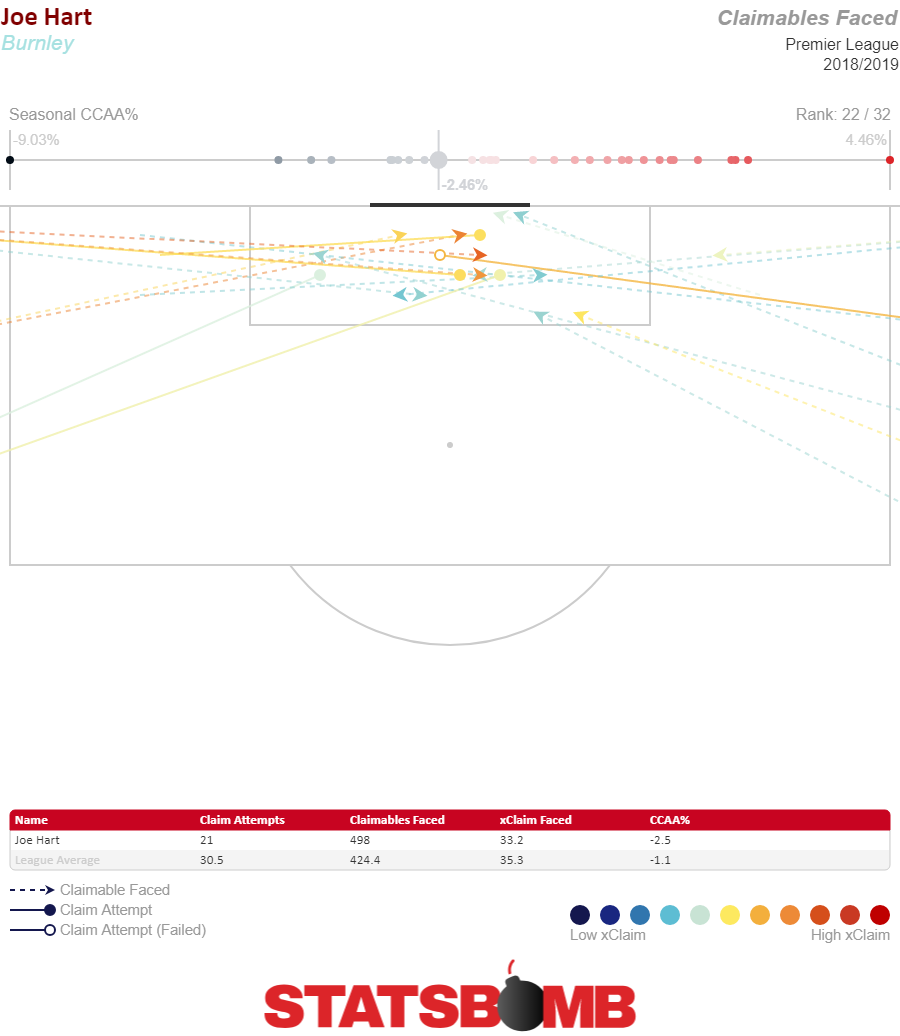
  Hart is similarly conservative overall, attempting to claim 21 balls when the model expects he’d have gone for 33, but the distribution of his conservatism is different. In his 19 games he’s faced 20 total balls that the model expects a keeper to claim at least 30% of the time. He’s come for five of them (and was successful four out of five times), when the model predicts a keeper would come on average 9.5% of the time. Over the course of the season Hart has shown to be unable to prevent teams from putting high value crosses right on his doorstep.
  Now, let’s zoom out to the team level again, equipped with the knowledge that Hart has a tendency not to come for balls played into areas where many keepers attempt to collect them. Here are all the shots Burnley gave up within 12 yards of the goal with Hart as keeper.
 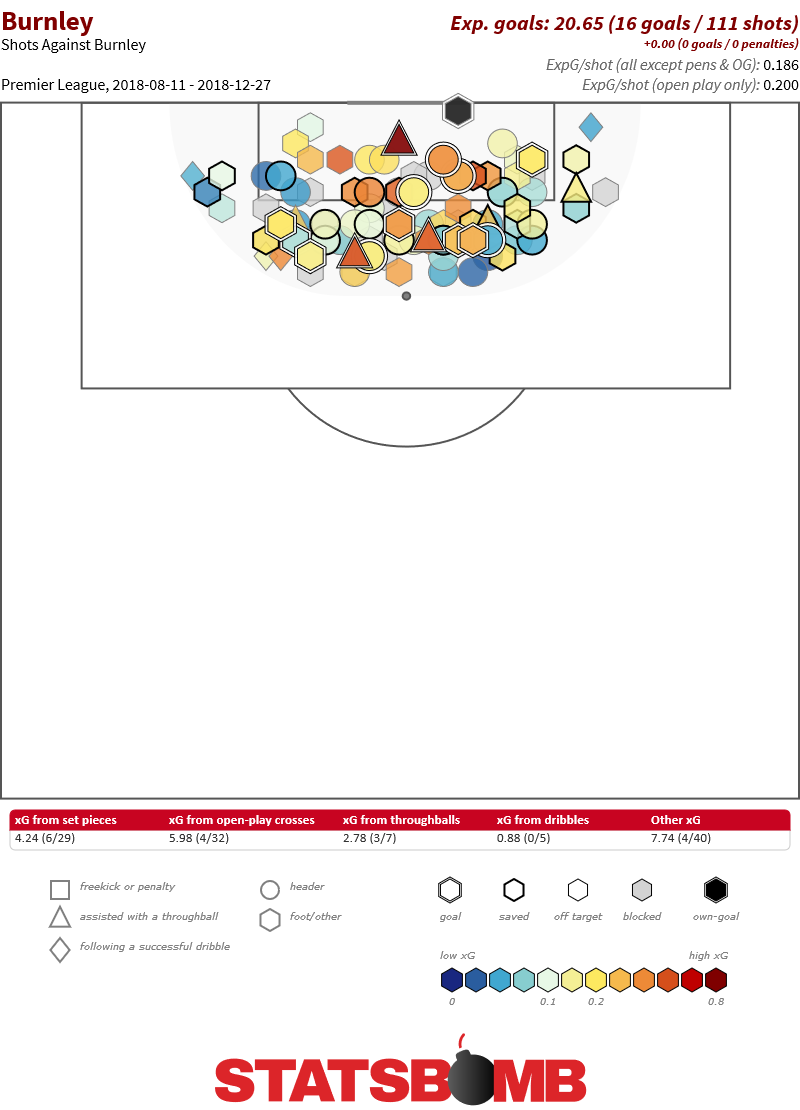 That works out to 5.84 shots per match at a 0.19 xG per shot. Now, let’s look at Heaton.
 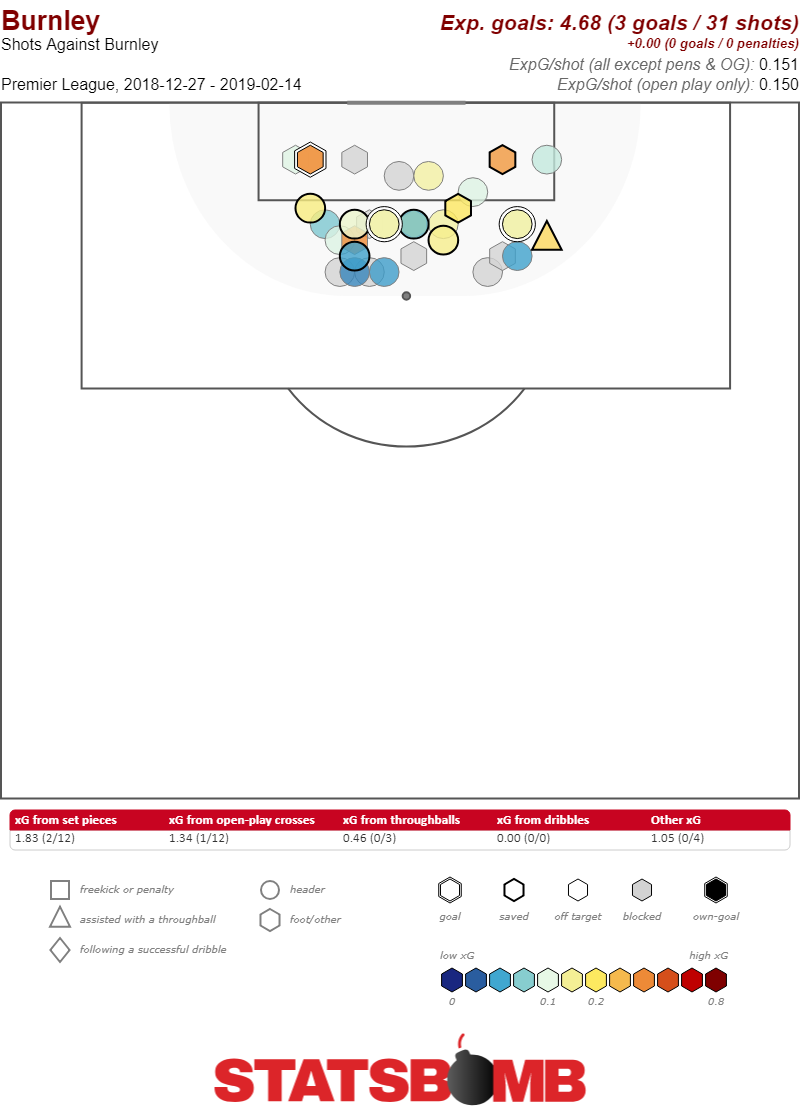 That works out to 4.42 shots per match and an xG per shot of 0.15. That’s a pretty huge difference, like half an expected goal per match difference. Even if we allow that the difference is probably fairly exaggerated by the level of competition it seems quite clear that when Heaton came back into the side it all of a sudden became harder for Burnley’s opponents to generate shots closer to goal. All this keeper data is new, and because of that it’s always worth remembering that using it is a bit of a high wire act. It’s possible that all this Heaton performance is just dumb luck and he’s come plummeting back to earth. It’s possible that we should look at Hart’s failure to come for crosses as not necessarily indicative of his abilities. It’s possible that Burnley will go back to conceding shots close to goal against tomorrow. None of this is proof. What it is is circumstantial evidence. And boy is there a lot of it. Burnley’s performances suddenly turned around when they removed Hart from goal and replaced him with Heaton. Their defense suddenly stopped conceding as many chances close to their keeper. Their keepers have dramatically different records both when it comes to stopping shots and when it comes to claiming balls in their area. Put it all together and it makes a powerful case that the reason Burnley’s season has turned around is that Joe Hart is bad and Tom Heaton is good. Keepers, it turns out, might just be important.
2019
The Great Burnley Keeper Switch
By Kevin Lawson
|
February 14, 2019
