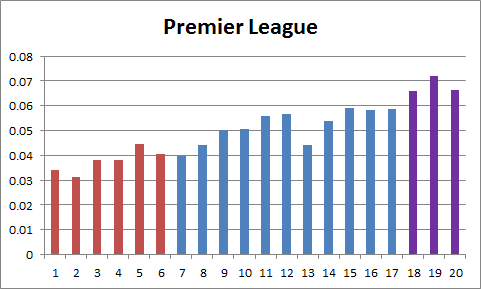
There is this “thing” that’s been bugging me recently regarding, “Player X only scores against bad teams.” As a stats guy, I have a hard time believing in the concept of big game players, or clutch, or whatever. Therefore, later this week, I plan to dig into these concepts in a bit more detail across a reasonably large player population, but my hunch is that basic math means people are spitting confirmation bias all over this bad boy, hitting all the targets indiscriminately. However, before we get there, we need to have some sort of baseline to look at regarding goal expectation. For purposes of this study, I’m going to chop the teams into European vs. Not European as the team quality cut. I’m doing this because we know competing in the Champions or Europa Leagues will add money (and presumably quality) to a team’s roster, and also because I wanted to raise the N of this study by looking across a number of leagues and scorers for the past few years. The Premier League  To the left is the ratio of goals against, given up by average finishers at that league position from 2009-2013. Multiply by 100 to get the percentage. The top 6 teams in a 20 team league make up 30% of the league. However, in the Premier League, they only give up 22.7% of the goals. Bundesliga
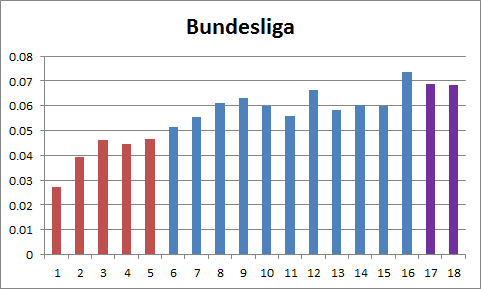
  Germany is an 18-team league, so the cut here will be 5 teams vs. the remaining 13. In Germany, the Top 5 teams only give up 20.4% of the goals, while comprising 27.8% of the population. (It’s about the same as the Premier League.) La Liga
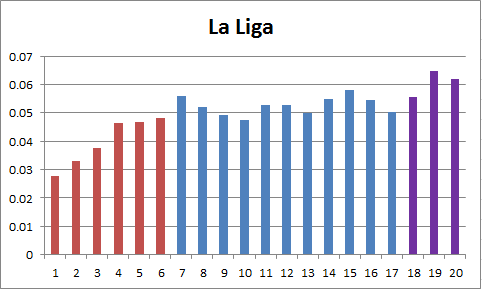
  And with Spain you see a similar trending, though here it’s 23.9% of goals against vs. 30% of the population. So as you probably figured, it’s actually harder to score against rather good teams than it is against considerably worse teams, and not just because there are fewer good clubs around. This makes intuitive sense, but it rarely gets brought up. Or maybe everyone just expects good scorers to be able to overcome good defences (which is weird, because there are almost always more players committed to defending). Anyway, one of the issues you run across with this type of analysis is a painfully small N. Six good teams a year means twelve league matches vs. 38 in the league as a whole. Therefore what I’m going to do to try and increase the N is look at a larger number of top scorers in each league and group them together to increase the basic N, and also where possible, look at the same scorer across multiple seasons to see if it’s random noise. Now that the baselines are built, we can start to dig in to player performances. Er… just as soon as I get the data sliced. Which may be a while.
2014
The Only Scores Against Bad Teams Myth, Part 1
By admin
|
February 10, 2014
