The knowledge that shot locations are important is increasing all the time, however West Ham seem to be going out of their way to remind us that there is more to a good attacking strategy than simply ensuring teams shoot from close range. West Ham's Traits The injuries suffered by West Ham’s strikers during the current 2013/14 EPL season are well documented, and, at face value may provide plausible reasons why West Ham has scored just 13 goals in the opening 15 league games. However, upon examination of last season’s data I would suggest that there may be contributing systemic reasons for West Ham’s relatively low goals total.  During the opening 15 games of the 2013/14 EPL season West Ham have taken 62% of their shots from Inside the Penalty area. The only teams to post a higher percentage of their shots from inside the area than West Ham are the perceived Super Powers of Man City, Man United and Arsenal. This is broadly consistent with the 2012/13 season where West Ham took 68% of shots from inside the penalty area; this 68% value was the largest proportion in the league last season. Based on these numbers we can ascertain that West Ham seem to place more value than most on ensuring they shoot from good locations and attempt to minimise what are perceived to be “wasted, low expected value” shots. Ordinarily, taking approximately two thirds of a team’s shots from inside the penalty area is something that should be strived for; however, the underlying numbers posted by West Ham from the start of the 2012/13 season suggest that something is missing from the attacking strategy being adopted. It appears that West Ham have almost adopted an “ensure we shoot from good locations” strategy to the detriment of everything else, including how the shot has come about. The origination and type of the pass that led to the shot has an important bearing on the chances of the subsequent shot resulting in a goal. I think it's beyond doubt that Sam Allardyce favours close in shots and I found this interesting answer from Kevin Nolan in reply to a question in 2007:
The gaffer [Allardyce] said that he would have to fine him [Jay-Jay Okocha] because he was missing the target so often.He now has a theory that a large percentage of shots from outside the penalty area miss the target and thus do not lead to goals.The manager is now insistent that if you shoot from outside the area you hit the target - but there are no fines involved.
Data Teams tend to favour shots from different pitch locations so in order to have a level playing field to aid comparison I am looking at just non-penalty shots taken from the central portion of the penalty area, but which were taken from outside the 6 yard box. In the remainder of this article shots from this area will be termed “Central Shots”. "Shots" in this article refer to both shots and headed attempts on goal. The area has been bounded by a black rectangle in the image below. 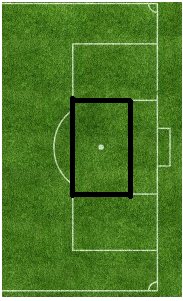 The tables contained in this article relate just to shots taken from within this area. This area under investigation was not cherry picked to give a predefined set of results but was chosen instead due to the large volume of shots and the relatively high conversion rate expected from within this zone. It’s also the area that I would expect to see shots that come from knock-downs or second balls, a tactic that would be held to be used quite extensively by West Ham. Central Shots and Goal Conversion Rates 2012/13 EPL Season
 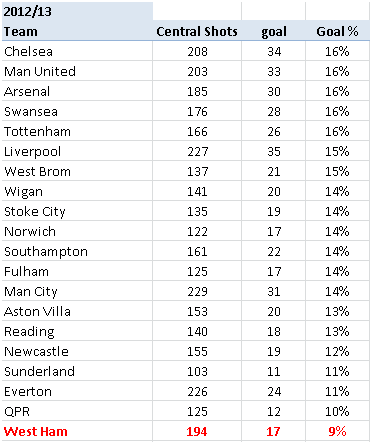 The above table has been sorted in descending order of Goal % (Goals / Central Shots) West Ham’s total of 194 Central Shots was the 6th highest in the league last season, but the paltry return of just 17 goals from these shots represented a conversion rate of only 9%. We can see that this was the lowest in the league. This pattern of a large number of Central Shots with a corresponding low conversion rate has broadly continued during the current season:
 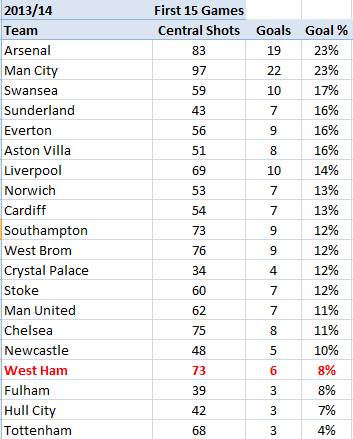 The 73 Central shots taken during the opening 15 games is the joint fifth highest in the league, but once again West Ham are being let down by the conversion rate of just 8% from these shots – resulting in just 6 goals. As an aside, this measure clearly shows part of Tottenham’s problems this season. Somehow, they have only managed to score 4% of their Central Shots this season – the EPL average is 13%. Those returns are barely believable and should be Exhibit A for Andre Villas Boas should he ever require any stats in his defence. I would contend that Spurs have deserved more goals from their attempts, and they have been victims to a large dose of variance, so it’s a pity that AVB doesn’t believe in stats!!! Getting back to West Ham, if we didn’t have last season’s numbers to compliment the data from the opening 15 games in the above table we could perhaps assume that the scoring conversion rate will pick up when Andy Carroll comes back into the team. However, armed with the evidence from last season I think it is worth considering whether there are other factors that have resulted in the very low conversion rates of Central Shots since West Ham have been promoted to the Premier League in 2012. Expected Goals As usual, I’ll use our (produced with Constantinos Chappas) ExpG metrics to dig a little deeper into why West Ham are not availing of what appear to be great chances. In order not to bore our regular readers I’m skipping over the explanation of ExpG, but new visitors to StatsBomb can find a detailed explanation at the bottom of this piece. Central Shots Analysis using ExpG Last Season
 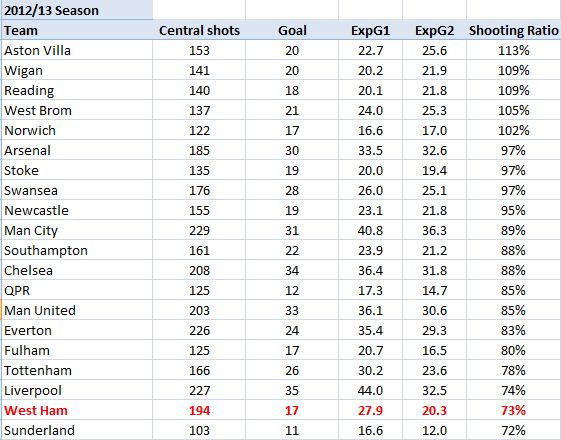 Shooting Ratio = ExpG2 / ExpG1 (the higher the ratio the better the shooting given the initial perceived shot quality) The above table has been sorted in descending order of Shooting Ratio Now let’s look at the corresponding figures for the opening 15 games of the 2013/14 Premier League season.
 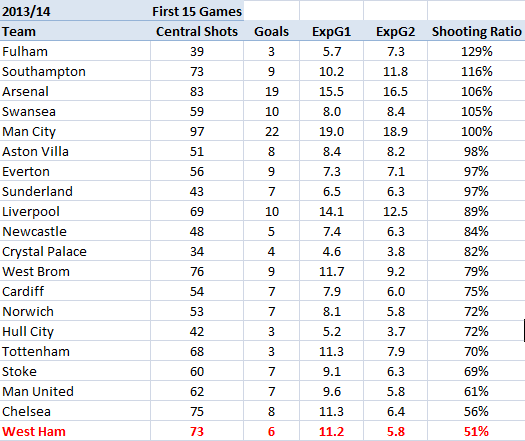 We can see that West Ham lie bottom, and detached by some distance, of the table for the current season, and second from bottom last season. This is the single most important take away stat from this piece. What is the significance of the Shooting Ratio? Let’s take the 2012/13 full season figures for illustration. West Ham had an ExpG1 of 27.9, ExpG2 of 20.3 and actually scored 17 goals from these Central Shots. Using the data at the point these Central Shots were taken, our model expected West Ham to score 28 goals, however only 17 were converted. This is a large under performance and needs further analysis. ExpG1 values are controlled for headers so the fact that West Ham had the most headed attempts at goal in the league (123) shouldn’t be part of the explanation for the shortfall. I feel that the ExpG2 measure can rule out that “bad luck” was at play for the majority of this shortfall. The ExpG2 value of 20 means that after the shots were struck the expectation for the total goals decreased from 28 to 20. This fall in expected goals is due to bad shooting – nothing less. Shots were either hit too centrally at the opposition goalkeepers, were blocked or missed the target altogether. Most likely a combination of all three factors are liable to be at play here. One season can be explained away as a blip, but when the poor Shooting Ratio has continued through to the current season (11 Expected goals become just 6 when the shot locations have been taken into account) then I feel this matter requires further examination. The use of the ExpG2 metric rules out the suggestion that the lower than expected goal totals can solely be put down to “bad luck”. Good quality shots that are saved would have a high ExpG2 value regardless of the actual number of goals scored. For example, Tottenham had an ExpG2 value of almost 4 in their defeat to Newcastle last month despite not scoring. In West Ham’s case the ExpG2 values are not high; in fact they are the lowest in the league as a proportion of the ExpG1 values. What’s the cause of West Ham’s shooting problems? This is the important question, and unfortunately I can’t definitively answer it right now. With access to more granular data I would be able to undertake more detailed analysis to see if there is any particular subset of shots (ie how they are created) that are contributing to the low ExpG2 numbers, and hence low actual goals scored. Without access to this data I can only offer a possible suggestion: A lot of shots appear to be created either directly from crosses or knock-downs from crosses or long balls. Perhaps the subsequent shooting opportunity is harried by onrushing defenders, and thus shots that initially appear good quality do not have as high an expected value as they first appear. Player or Systemic Causes From the little work that I have done on repeatability I’m not sure that at, the average Premier League level, finishing ability varies that widely between players. Of course, there will always be exceptions with the very best strikers but generally I think that team play and systemic approaches will drive individual players’ stats, not the other way about. Central Shots on Target From a West Ham point of view, the percentage of Central Shots that are On Target (ie score a goal or force a save) have been exceptionally disappointing over both seasons. The below tables have been sorted in descending order of On Target percentage
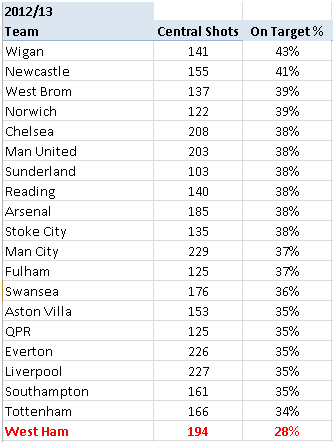
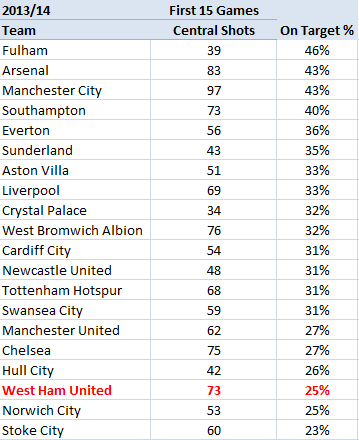 West Ham only managed to get 28% of their Central Shots on target last season; by some distance this was the lowest in the league. As with the other metrics we have looked at in this piece, the situation has not improved in this current season. As stated above, I can’t be definitive about this, but in my opinion there is something about the quality and type of chances that are being created by West Ham which means that they are not as strong as they initially appear. Conclusion It is apparent that West Ham prioritise shooting from good locations with approximately two thirds of shots coming from inside the penalty area. However, they have converted just 9% of their Central Shots over the last season and a half. This is the lowest conversion in the league and my work would suggest that this low conversion rate is not due to bad luck as the placement of shots relative to apparent chance quality is lowest in EPL from the start of last season. All relevant metrics were poor last season; so this is not just a 2013/14 problem and this continuation of poor metrics (lowest in league) suggests that there may be systemic issues rather than being due to the availability, or otherwise, of individual players. The data demonstrates that West Ham have an issue in turning what look like good quality chances into goals. Given Sam Allardyce’s reported use of analytics it is surprising that this phenomenon has been in existence throughout the last season and a half. Without having the data required to pinpoint the exact reason I would suggest that the lack of variety in West Ham’s attacking strategy allows defences to be prepared for the crosses and long balls that they play - last season they made the most crosses in the Premier League and currently sit 3rd in the same measure this season. The readied defences then ensure that the Hammers rank amongst the very worst teams in terms of getting their shots on target. Could it be the case that West Ham are concentrating too much on one KPI - shot location - to the detriment of developing a balanced attacking strategy? Either way, it appears to be time for a rethink of offensive strategy at Upton Park. Expected Goals Explanation One of the metrics that I use to help analyse scoring opportunities is Expected Goals (ExpG). These are a series of models that I have developed in collaboration with Constantinos Chappas and they numerically evaluate the probability of a goal being scored from any shot. These metrics have been developed using Opta data and so they cannot take account of defensive pressure or positioning, but I feel that I have developed a work around for this. We use two metrics, and it’s important to understand the subtle distinction between them: ExpG1 – is the Expected goal value of a shot at the time that the shot is ABOUT TO BE taken. This calculation takes into account many factors such as shot location, whether the shot was a header or struck with the foot, the location and type of pass. ExpG2 – is the Expected goal value of a shot AFTER the shot has been struck. This takes into account all of the factors used in ExpG1 but is weighted much more towards the intended location of the shot. A shot that is blocked or off target would have an ExpG2 value of zero (as the shot cannot be scored), whereas a shot aimed for the very top corner might have a probability approaching 1.00.
