When you attempt to write a statistical and analytics-based Premier League round-up column every week of the season, it can be somewhat dispiriting to see parts of the league meander towards an almost inevitable status quo. Nothing wrong with that per se, but finding interesting hooks to write about can become a tricky task. As such, this week we're going on a bit of a holiday and we have more of a quirky investigation than a news report. It's more a diet of "Louis Theroux" than "The One Show" and we should all feel better for it. Maybe. Hopefully. The Story of Nil As a plentiful supply of goals flew in, there wasn't a lot of “nil” around in the Premier League this weekend, at least until Sunday, and only four teams contributed: Southampton, Burnley, Tottenham and Newcastle. Of these four teams, the away teams offered particularly little in the way of healthy shot counts and as such widely deserved their “nil”:  The international break, whilst generally dismal from a fan perspective, does at least offer time to ponder questions and explore data. This being so, I've been able to explore a few mini-topics that have intrigued me, one of which is the superficially nonsensical question: “How many shots does it take to score nil?” So using data I lovingly collected over many, many hours then ignored for a couple of months I can tell you that in the Premier League between 2009-10 and 2013-14, there were 1050 instances of a team scoring nil. And I can produce this table of averages:
 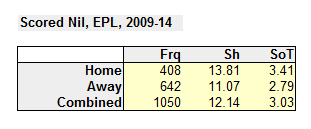 Well, well! Our table of averages matches very well with this weekend's nil scorers! Pure chance, I assure you. Over the duration of the sample, goals are scored from around ten percent of all shots and 30 percent of all shots on target. As we're looking at nil, the shot on target figure correlates nicely, on average somewhere between every third and fourth recorded shot on target becomes a goal and average nil scorers do not exceed this range. In fact, the “nil” scorer has a problem with its shot on target rate, it averages out at around 25 percent, five percent shy of the average for all. Another aspect we can see here is a difference in the location of the “nil” between home and away. A bias towards home advantage is clear in frequency (408 to 642) and in the volume of shots recorded. Despite achieving the same final outcome, “nil”, home teams recorded an average of 2.74 more shots and 0.62 shots on target than the away team. This is something we can also see in this next section. So: how many shots does it take to score nil? About 12, with three on target. Shot Dominance I'm defining "shot dominance" as the difference in the volume of shots a team has in contrast to its opposition. A simple frequency chart using the same data as before, produces a familiar shaped graph:
 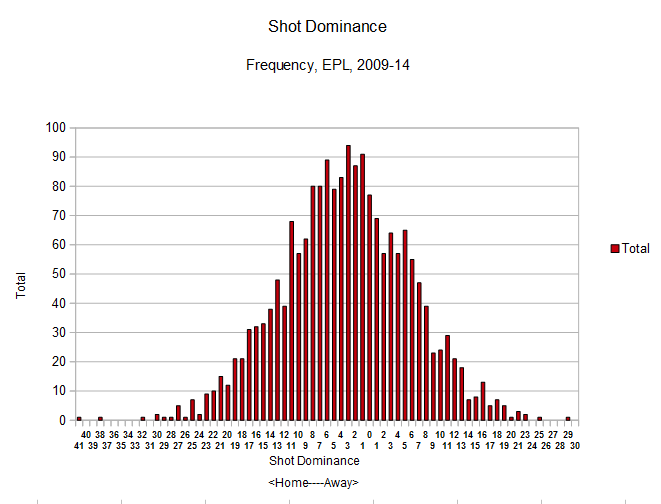 This shows a huge majority of Premier League matches involve a shot differential of under ten, which is logical when tallying with a long-term average of around twenty eight shots per game (although a trend for this season would bring it lower). I've had ideas around this on the back burner for a little while now but was spurred into trying to make coherent sense of the data by a tweet highlighting some of @JamesWGrayson's work from @WillTGM and an observation Statsbomb's Colin Trainor made in the replies:
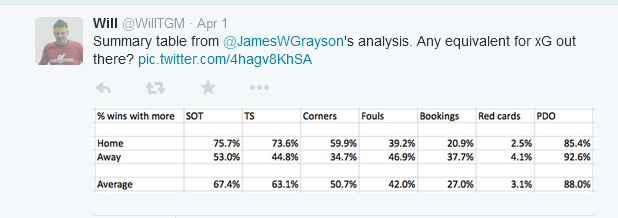
 Yep. I concur. It took a bit of wrangling to create charts that I was broadly content with but I can show the impact that shot dominance has on both goals and points, from the perspective of the home and away teams, and it indicates a familiar bias towards the home team. I should add that each data point is bucketed and incorporates the two nearest values either side of the given number, that the higher figures are excluded and that small samples still persist towards the edge of the charts. Regardless, here's what we see with goals:
 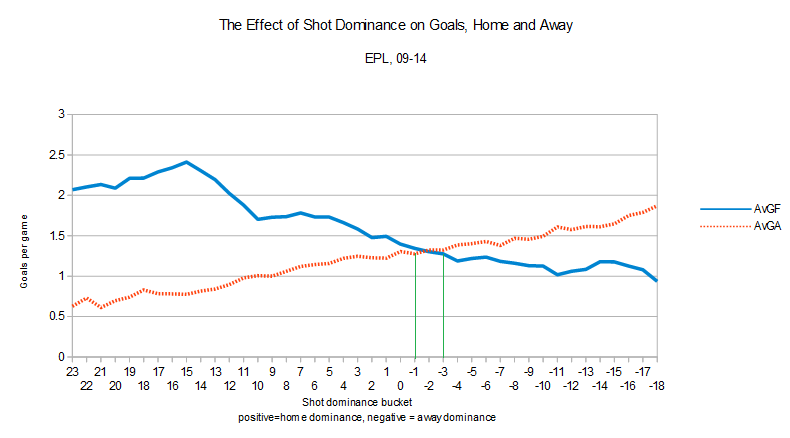 Without any bias, we would expect the value lines to cross at zero. In fact, they cross somewhere between minus one and minus three shots, to the cost of the away team. What this suggests is that before a ball is even kicked, an away team can probably expect to have to generate around two shots extra per game to create a par outcome. Home field advantage has been shown to have clear significance in previous studies, and it is borne out here. We can also see the same effect on points:
 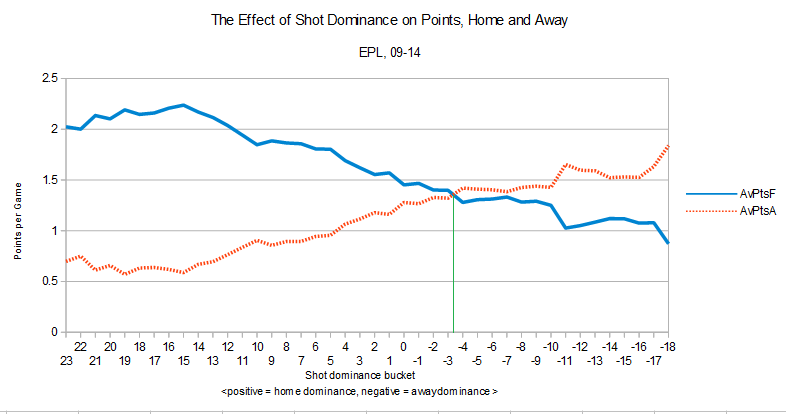 This time the effect is arguably larger, with a clear crossing point at a shade over minus three shots. Indeed, here the away team only seems to gain a particularly significant potential advantage when it exceeds a ten shot dominance. Compare with the perceived points expectation a home advantage of ten shots confers. [A curio in the sample is that the rate of goals (2.79 per game) is closely matched to the rate of points (2.74 per game). If you refer back to the graphs, they track quite nicely.] There are clear implications here for work with shots. We already intuit that all shots are not born equal and there is significant discourse in the analytics community as to whether methods of separating and defining them are sufficiently meritorious so as to favour complex modelling over straightforward counting metrics. In many cases a preference is linked to whichever method one has devoted time and work towards or even whether or not a purposeful endgame is being visualised. There are still many simple elements that can be examined with basic counted data and with some of the modelling understandably shrouded, it can be hard to be definitive as to which the most effective and predictive metrics truly are. Okay, okay, enough with the graphs and analytics, how about some weekend review? Personal highlights this weekend were the two Gomis finishes. I challenge anyone not to enjoy his first volleyed attempt and the marvellous composure to languidly lob in his second was Berbatov-esque. Swansea continue to defy my, and maybe the shot watchers, expectations. In their last ten matches, they have exceeded 11 shots only once yet have amassed 16 points. Five of those matches were against members of the current top seven so they can feel well pleased to be maximising their returns, at least for now. In a similar vein, Everton have started to pick up results despite being beaten down recently on the shot count. This was a trick they performed a few times at a similar stage last season before eventually their challenge for the top four (!) petered out. Though this time it is more about securing comfort in mid-table, it is hard to know whether they have just managed to stabilise after some inequitable results prior or if they're just finally getting a share of good fortune. Elsewhere, many things remain similar. Chelsea eked out another narrow win to remain adequately ahead and Arsenal and Man Utd again put forward solid claims to be the strongest teams in the land, at least based on recent form. Arsenal have become adept at preventing shots on target (last 11 games only once over 4 shots on target conceded, 8 against Tottenham) and swept past a faltering Liverpool. I have suggested more than once in this column that I felt Liverpool's challenge would end up in the top four but the combination of Utd's sudden improvement and again poor form in a crunch game has apparently killed them off. Five games ago Utd recorded 30 shots including 10 on target against Sunderland. In that game and the four subsequent games, they have only conceded 30 shots and nine on target in total. Their success is built largely on restriction of the opposition and with Herrera, Carrick, Mata and Fellaini now surrounding Rooney, they appear to have chanced upon an attacking potency they formerly lacked. Obligatory Tottenham bit A bravura performance from Paulinho led Tottenham to another comfortable victory against a battling but ultimately limited Burnley side. Recently maligned by fans, he responded magnificently by rounding the keeper to open the scoring then contributed fully as Harry Kane ran riot scoring five, Eriksen chipped in with a couple more and Tottenham ran out 9-1 winners. At least that's a version of reality that would sit a little better than a grindy 0-0 against a well organised Burnley team, who on recent showings look reasonably well set to climb away from the relegation zone. But, no! Their point, whilst deservedly earned, paled in comparision to QPR, Sunderland and Leicester's three, each of which was backed up by solid attacking numbers. Hey, if Gus Poyet could rescue Sunderland last season, given the fixture list they overcame, then it's impossible to state that any team in this league will be pulling their rip-cord any time soon. Thanks for reading! ~~~~~~~~~~~~~~~~~~~~~~~~~~~~~~~~~~~~ Find me here on Twitter: @jair1970
2015
The Story Of Nil, Shot Dominance And A Premier League Weekend Review
By James Yorke
|
April 6, 2015