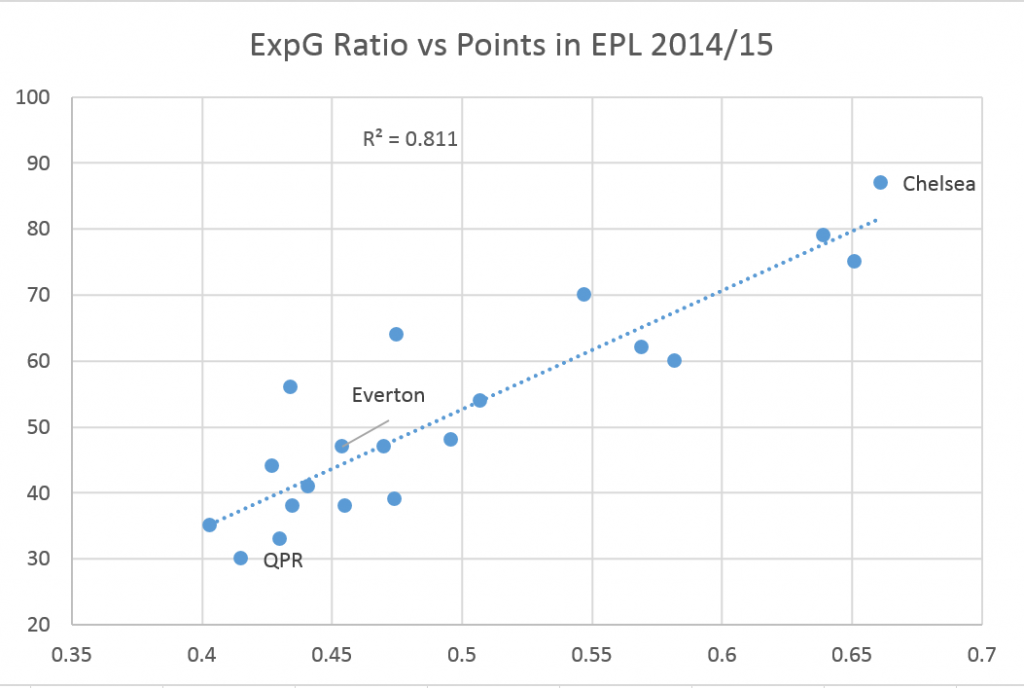
Everton finished 11th. That may not mean much to you right now, desensitized by the difficulty of maintaining long term schadenfreude (unless you’re unhealthily obsessed Arsenal fans on St Totteringham’s Day), but it’s pretty insane and has kind of gone completely under the radar (pun intentionally not avoided). In his StatsBomb preview for the 2014/15 season, Paul Riley predicted that they would finish 5th-7th. And that was pretty reserved, especially for a fan – when Everton signed Lukaku, it was seen as a declaration of intent; not to languish in midtable or, indeed, even Europa, but to compete for the Champions League. Yet here we are, a year later, with all the joys of hindsight and the destruction of a 38-game implosion in front of us. Magnifying glass in hand, we start to sift through the debris, an aching question on the periphery of our minds: Dafuq happened to Everton? The overall picture Everton’s TSR, 10th highest in the league, doesn’t present us with anything initially shocking, although they slightly underperformed according to the metric. 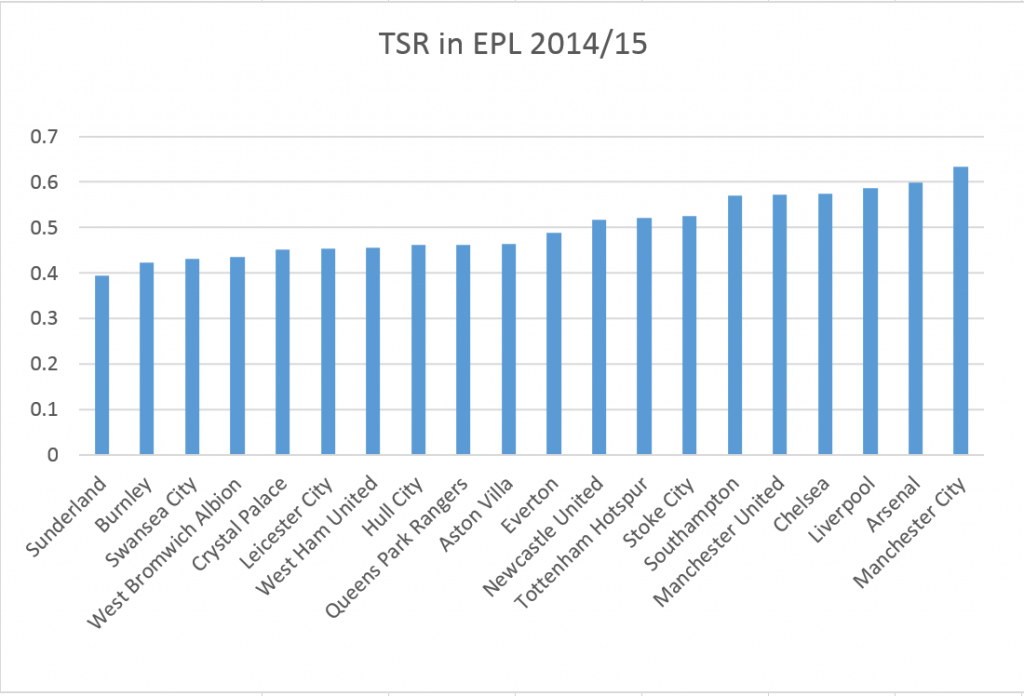 Everton’s Expected Goals Ratio ranks them 13th in the league. Their season doesn’t seem to be one of huge ExpG over-performance like Chelsea or Swansea, or under-performance like QPR, though their Expected Goal Difference (-7.7) was 5.7 goals lower than their actual Goal Difference (-2). But that should, in theory, mean that Everton’s poor (relative to last season) point performance is explainable by the model. Through separating attack and defence, we may be able to find out more about the difference between this Everton and the one of yesteryear.
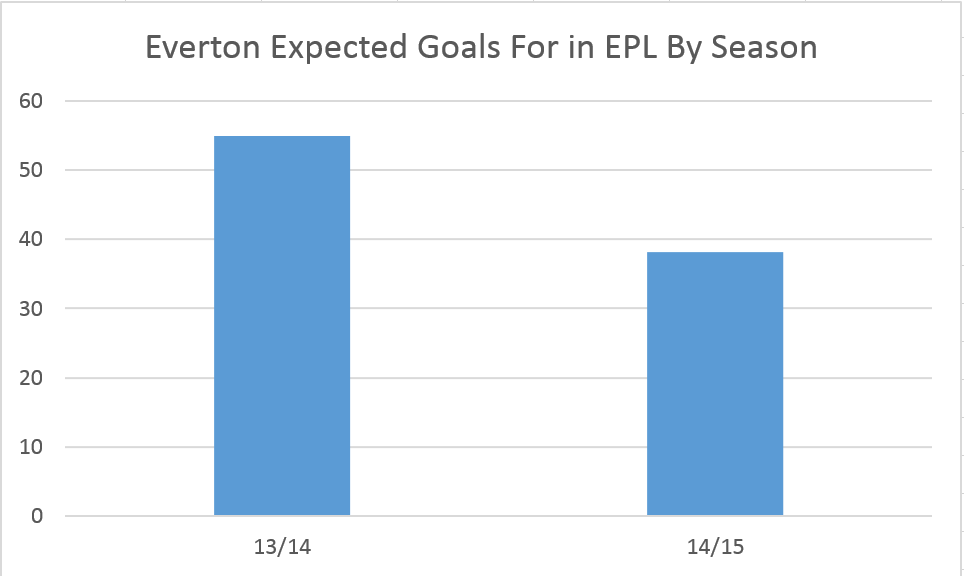
  Woeful attack Everton of 2014/15 scored 13 less goals than the year before, and took the 11th most shots (471) in the league, which ties up pretty well with their league position. But, if we look at Expected Goals For, the picture drastically changes.
 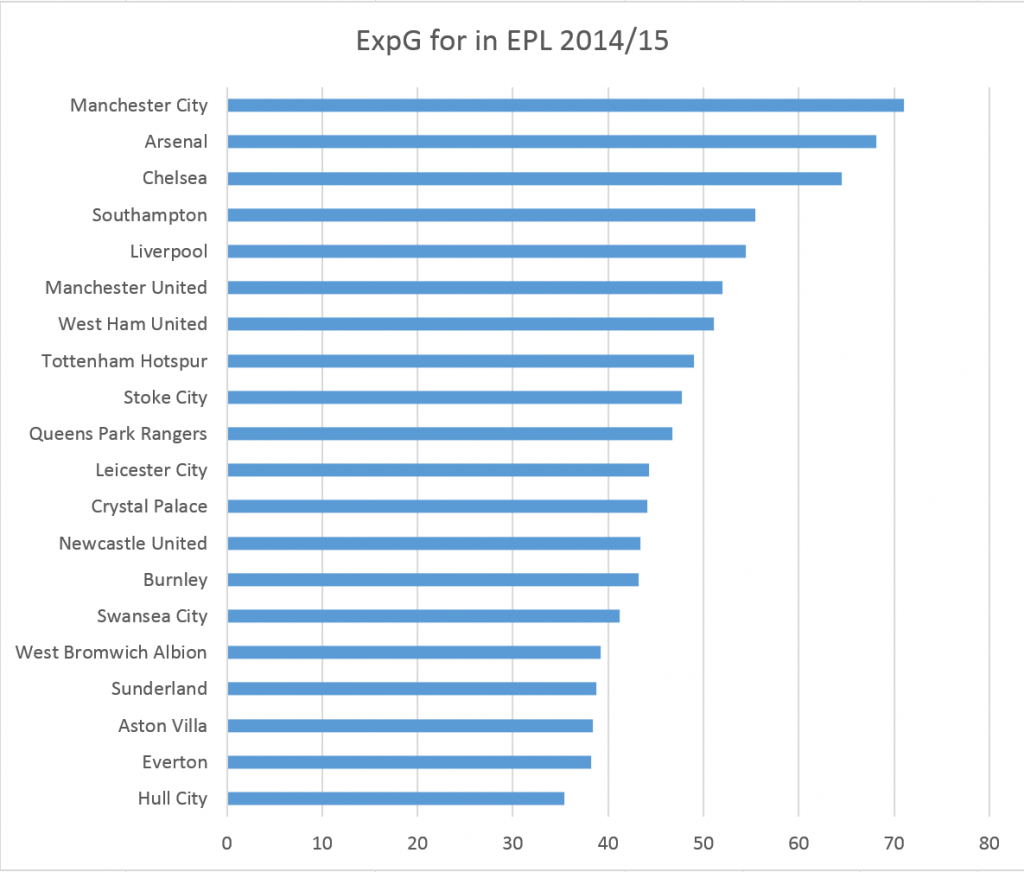 According to Michael Caley’s Expected Goals model, Everton had the second worst attack in the league last season. That’s an attack worse than Sunderland. That’s an attack worse than West Bromwich Albion. You get the picture, you understand rankings – you fully comprehend that’s an attack worse than EVERYONE other than Hull City. And that’s backed up by Paul Riley, who said, of this season, “It’s the worst attacking performance from Everton I have on record”. But, why? What about Everton’s shots isn’t translating into Expected Goals?
  Everton take 49% of their shots from outsize of the box, according to WhoScored, while only 4% of their shots were in the 6 yard box. I’m sure all of us, even you, Charlie Adam, can see why that’s stupid. To contextualise a bit, Chelsea took 41% of their shots from outside the box, and 7% from the 6 yard box. Stoke, with aforementioned punter on the books, took 48% of their shots from outside the area but managed 9% in the six-yard box. Shot location being an issue for Everton explains, at least in part, why Expected Goals rates their attack so poorly.
 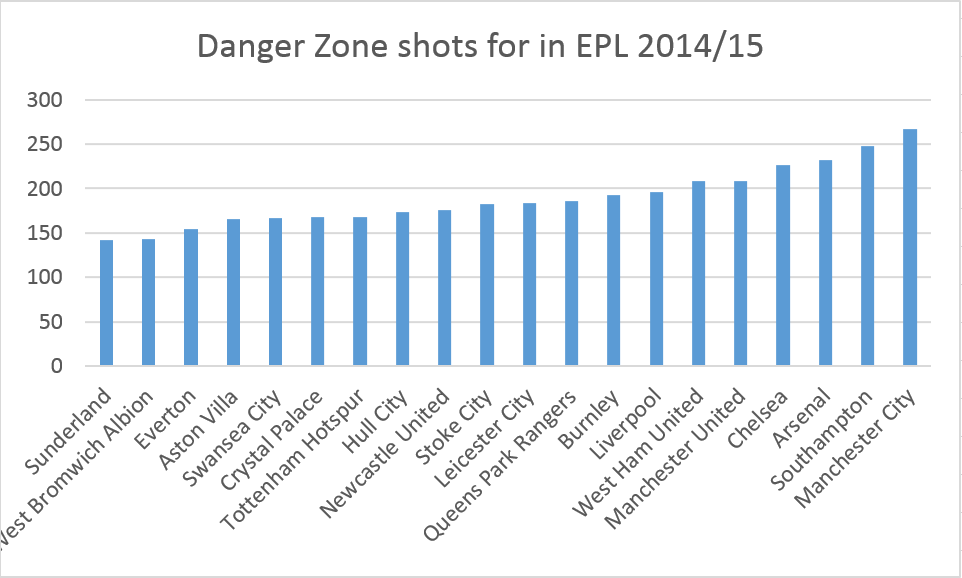 The message is echoed in volume, too. Everton managed the 3rd fewest shots in the danger zone, and according to Paul Riley, “along with Hull, [Everton had] the lowest number of danger zone SoTs last season”. Interestingly, Paul goes onto say that “in two of the the three years I have for Martinez at Wigan they were in the bottom two on this measure”, which would imply that this is a direct consequence of Martinez’s idiosyncratic tactics. You have to feel sorry for Romelu Lukaku. On the surface, his mere 10 goals in the league seems poor for someone bought for £28m, but being a striker is as much about finishing chances as getting them. Looking at shots per 90 and key passes per 90 as a crude measure of selfishness/creativity, we can see how uncreative the attackers behind Lukaku are. Ozil is there as a sort of altruistic benchmark – it may be that you can only have one designated creator in a 4231, but Everton have none in their attack (except…err…*arguably*…Aaron Lennon…).
 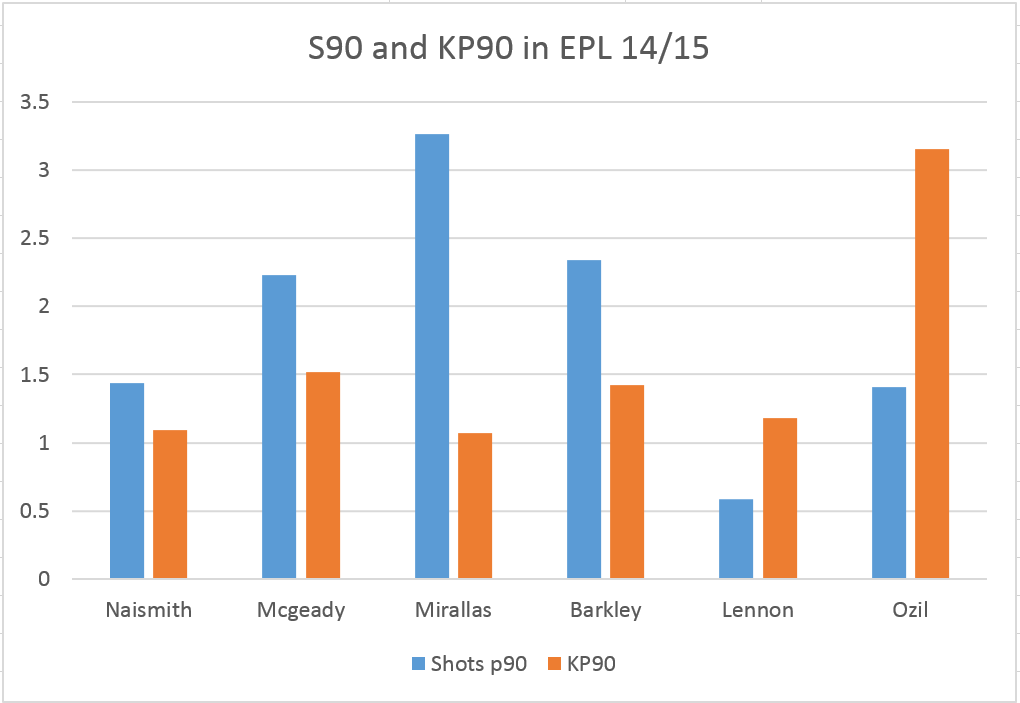 Everton lean on Baines for his creative ability – in 13/14, he assisted 0.13 per 90; in 14/15, that number rose to 0.29. This could just be random variance, but Baines of the season to just finish played 0.58 more key passes per 90 too. From 13/14 to 14/15, Everton had a marked drop in attacking strength according to Expected Goals. Since there hasn’t been a huge personnel change (signed Lukaku, replaced Deulofeu with Atsu), it may be that Martinez’s tactics are failing to create as many chances as they used to. Perhaps teams have clued up to the Spaniard’s game-plan, or maybe the attackers just had really poor seasons (Mirallas’ assist rate dropped from 0.31 P90 to 0.06, though his NPG90 increased from 0.31 to 0.44). Figuring out the exact cause of Everton’s attack becoming so blunt would probably take more granular analysis, but that it is blunt is there for all to see. This isn’t ExpG under-performance that could be classed as unlucky or variance, this is a massive observable difference in the team’s ability to create chances.
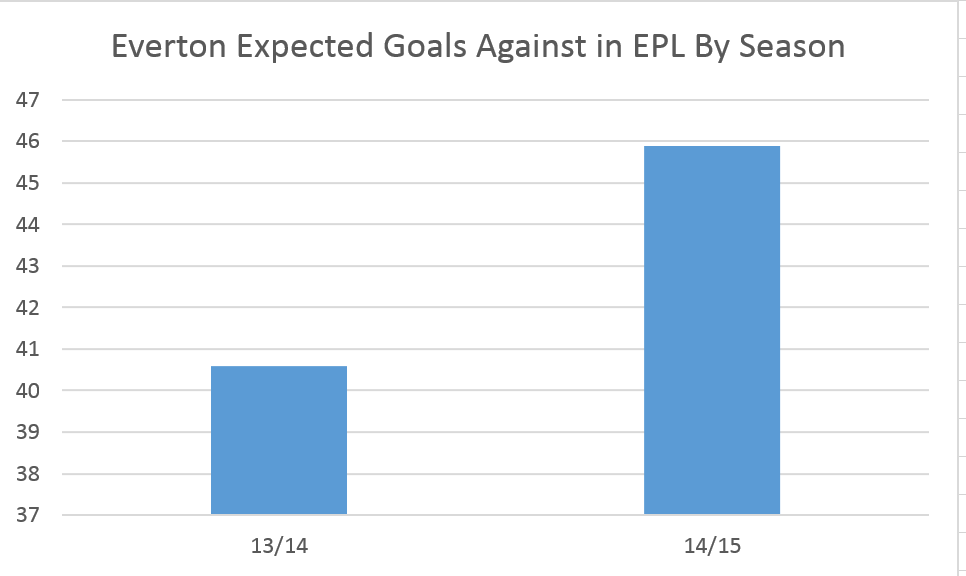
  Average defence and the R word In terms of Expected Goals Against, Everton rank 13th in the league.
 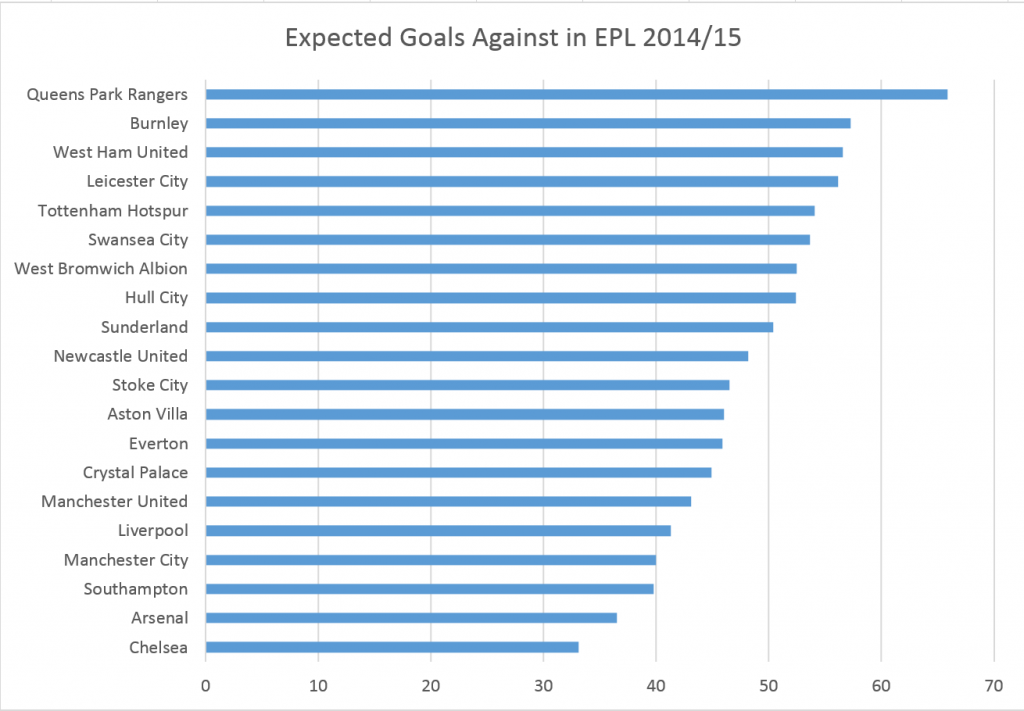 Their defence isn’t particularly bad, but it’s by no means brilliant either. They were expected to concede 7.7 goals more in 14/15 than in 13/14 – in reality, Everton’s 14/15 defence was 11 goals worse off than the one of the year before.
  A big difference that the model won’t be picking up (and may account for the extra goals conceded) between this season and last year can be found just behind the defence, in between the goalposts. Tim Howard’s save % from the danger zone was 57% last year, while the league average is 44%. This year, Everton’s was 43.59%, worsened only by Liverpool and Newcastle. As I pointed out in my piece on Swansea, and Paul did in his Everton season preview, danger-zone save percentage isn’t the most repeatable of metrics. Furthermore, according to Objective Football, Everton’s overall save % (half of the make-up of PDO) of 61.2% was the lowest in the league this season. Paul’s prediction of the effect of the inevitable regression in save percentage was almost perfect: “the numbers suggest it’s far more likely that more of the same next season will result in nearer 50 goals conceded than 40.” In the end, they conceded 50. Conclusion Dafuq happened to Everton, Bobby of a thousand words and countless graphs ago? Well, two extremely noticeable things, as far as we can tell: their attack retired, and Tim Howard regressed from Superman to Clark Kent. The former is a way bigger issue, because attacking prowess is something that can (in theory) be rectified and repeated, whereas danger zone save percentage is always likely to regress to the mean. The difference in Expected Goals For was also much bigger (16.7 goals) than in Expected Goals Against (5.3 goals). If the defence and attack were boats, the defence has a slightly bigger hole in the bottom this year round, while the attack has capsized altogether. Quite why Everton’s tactics worked so much less than the year before, considering a minimal amount of change in personnel, is a harder question to answer. The evidence is there – a lack of danger-zone shots, not enough creative play from attackers, too much shooting outside the box – but pinning the exact causes would probably take far more granular and comparative analysis. It may be infinitely more complex than needing a creator in attack, but I do wonder how this Everton team would play with someone like Gylfi Sigurdsson behind Lukaku. Martinez has to fix his attack, or his promise to Bill Kenwright of Champions League football will become increasingly laughable. Thanks for reading, and many thanks to Paul Riley and Michael Caley for data. I can be found on Twitter if you wanna discuss the piece.
2015
What Happened To Everton?
By Bobby Gardiner
|
June 30, 2015
