Live Analysis Platform
High quality real-time data and visualisations
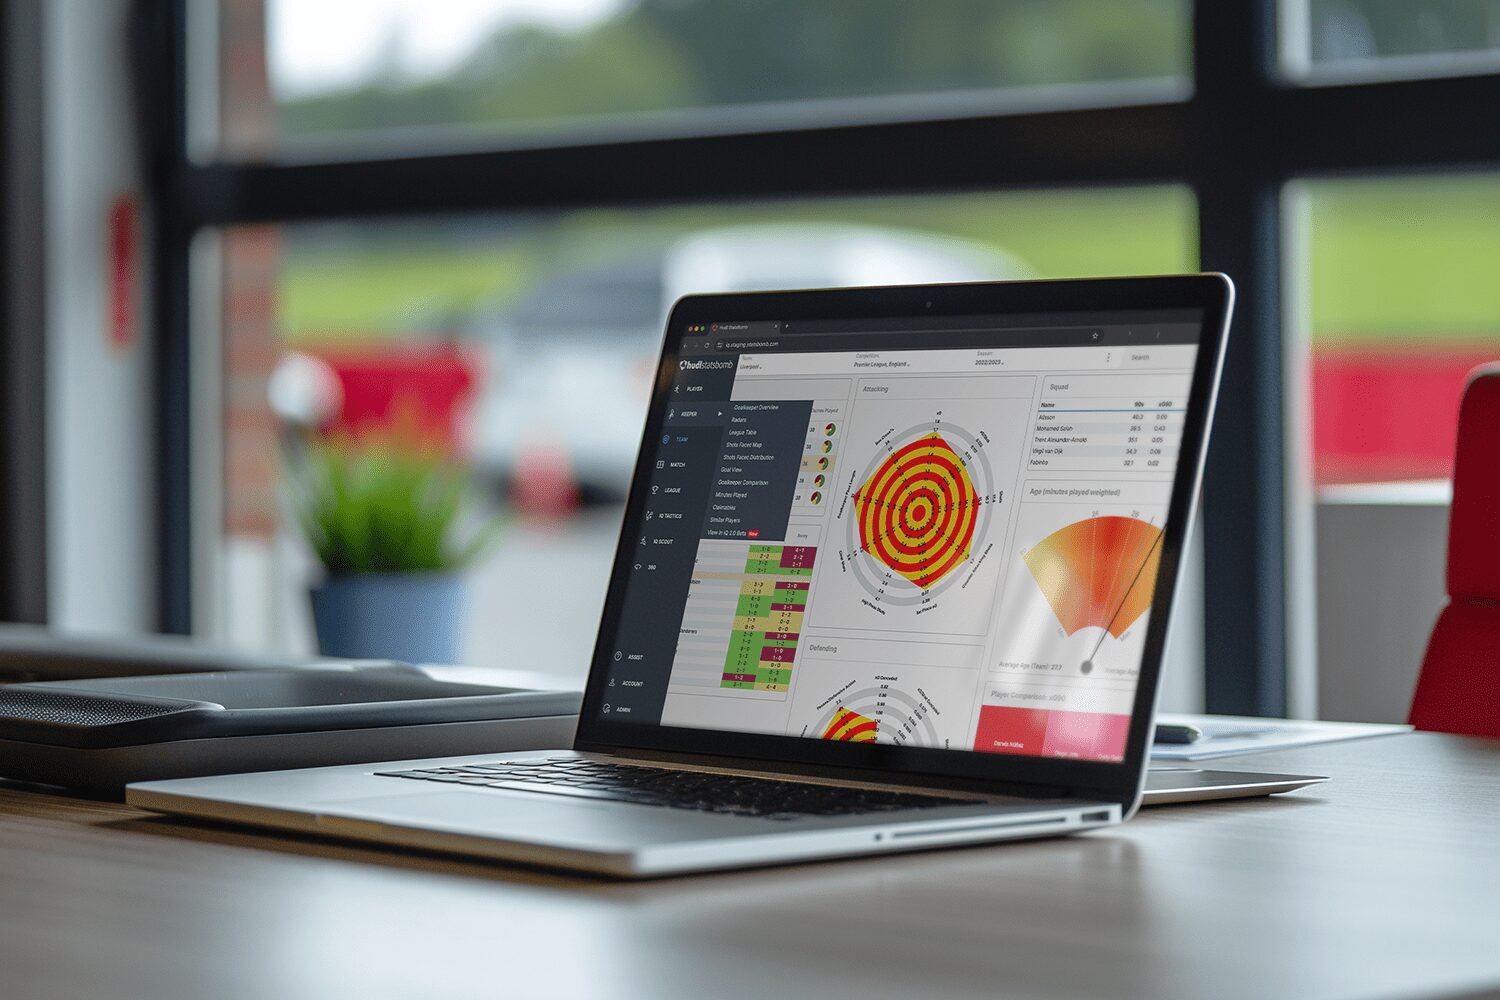
Live analysis platform, our all-new, fully customisable platform, is designed from the ground up with in-game decisions and content creation in mind
Accurate insights in seconds
The fastest and easiest way to visualise the best live data in the industry
Accurate Expected Goals (xG)
Hudl Statsbomb’s new Live xG gives an authentic view of the quality of chances created by each team in real-time
High quality data
Our Live Data auto-updates every second and is better in terms of speed, quality and accuracy
Consistency
Our Live Data metrics and Live Analysis Platform interface are aligned with our post-game Football Data and Football Analysis Platform
Simple set-up
Our pre-built dashboards and widgets quickly group metrics and stats from all phases of the game
Effortless visualisations
Visualise any phase of the game in real-time and export to share with ease
Customise and share
Add player and team tables and event location widgets, then save and share with your colleagues
Spot the unexpected
Use team averages to quickly spot over or underperformance from either team
Compare players
Highlight a positional match-up, key player, partnership or the performance of a competitor
Complementing your workflows
Pre-match preparation
Prior to game day, our Live Analysis Platform is the perfect research tool. Able to help you quickly reveal attacking and defensive style, set-pieces, key players and much more, it's the best way to prepare for your next match
Match day insights
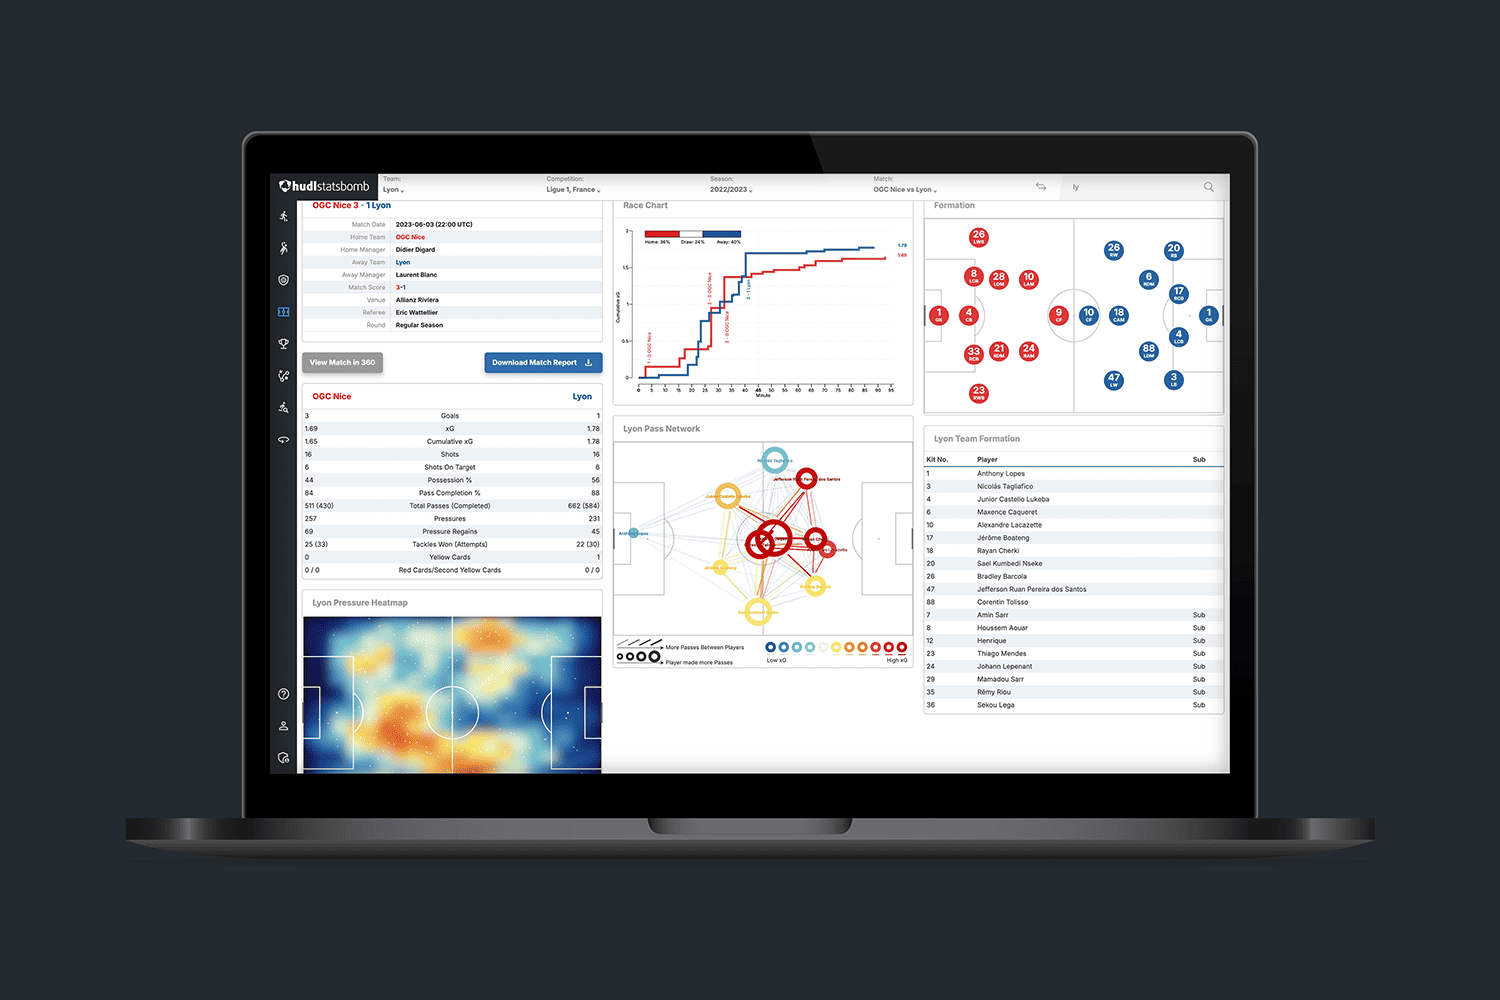
Get ready for kick-off with customisable dashboards in our Live Analysis Platform. Use our table widgets to reveal per-team averages to spot anything out of the ordinary, then visualise and export any player or team events in seconds
Post-match reporting
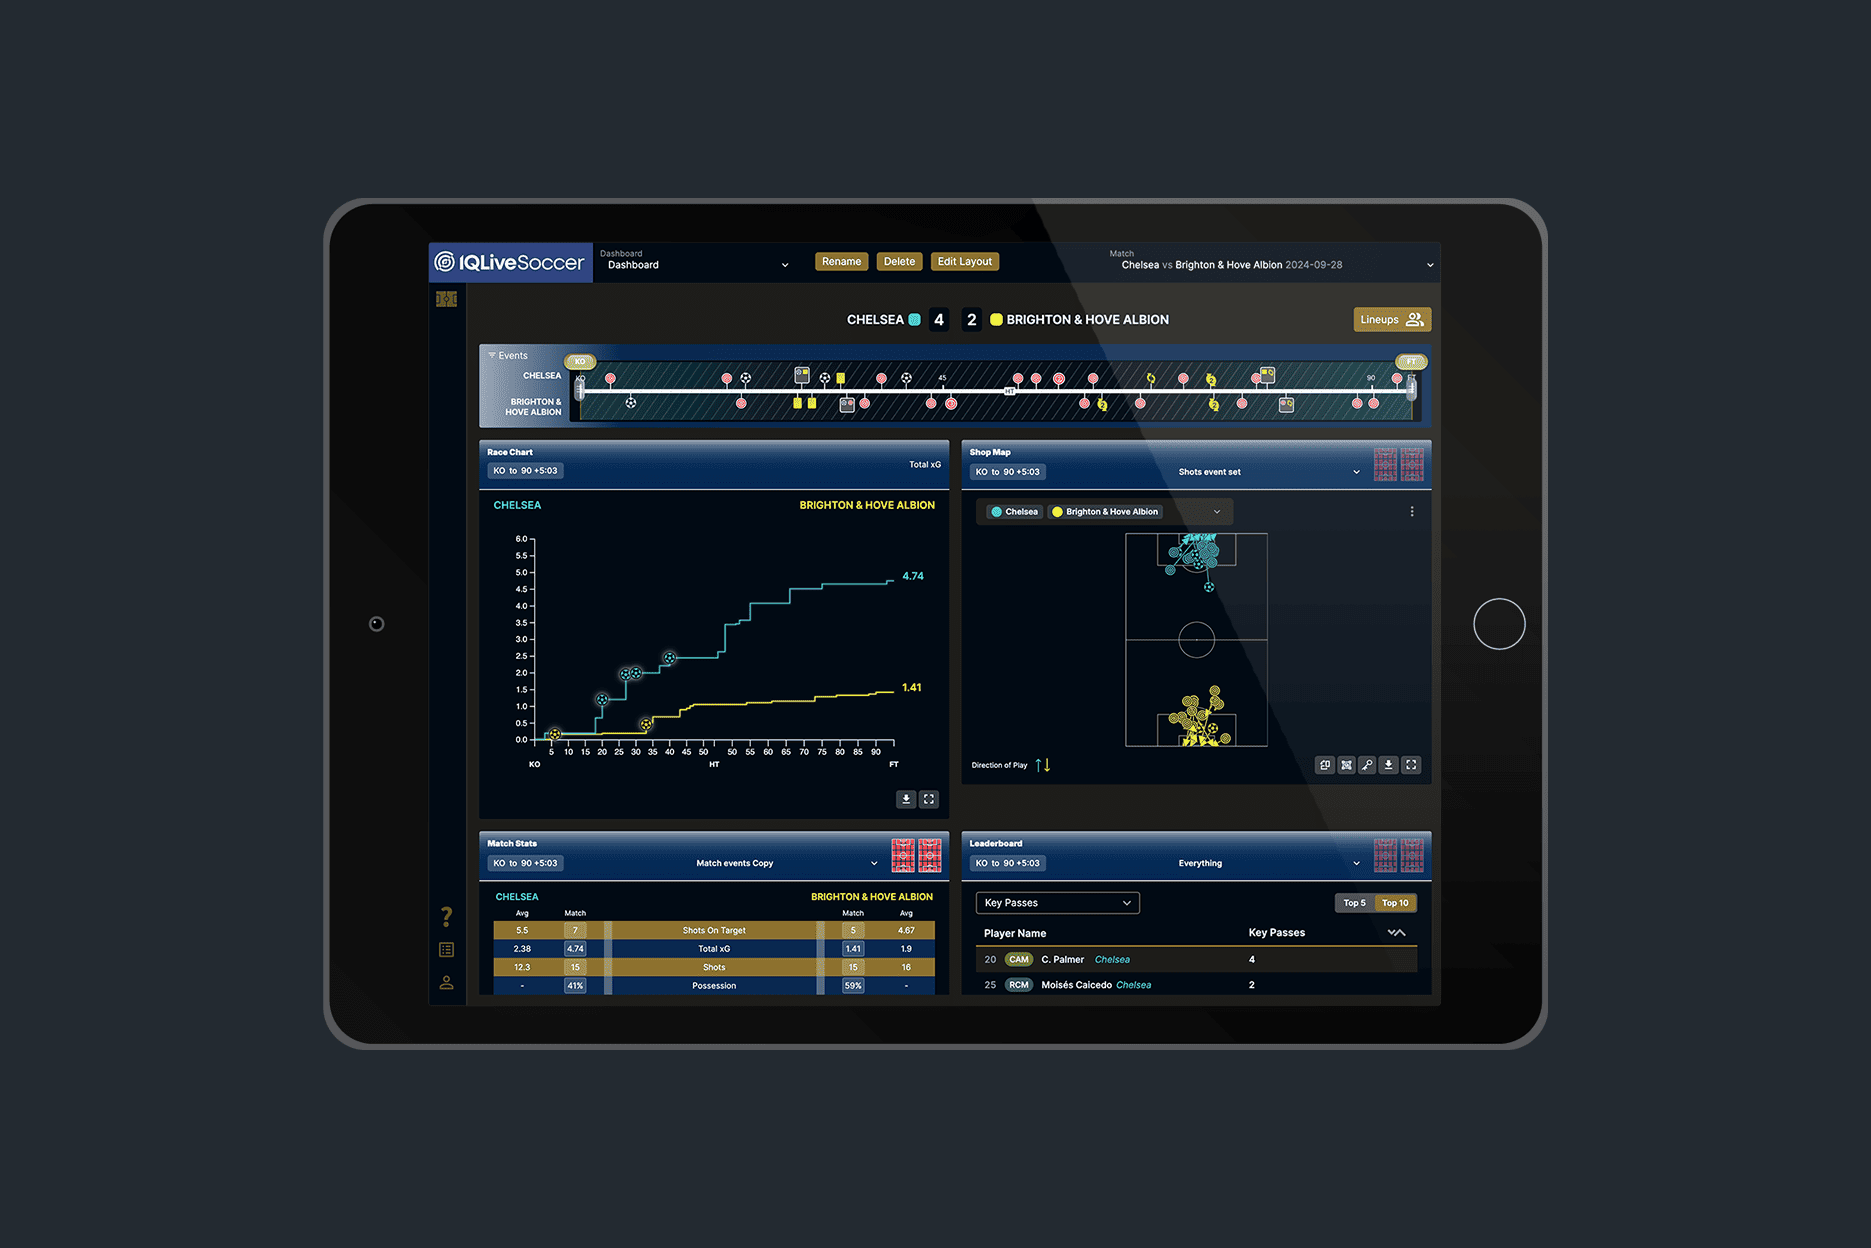
Once the final whistle has gone, our Live Analysis Platform can quickly bring your instant post-match debrief to life and save you time before you complete your full post-match workflow on our Analysis Platform.
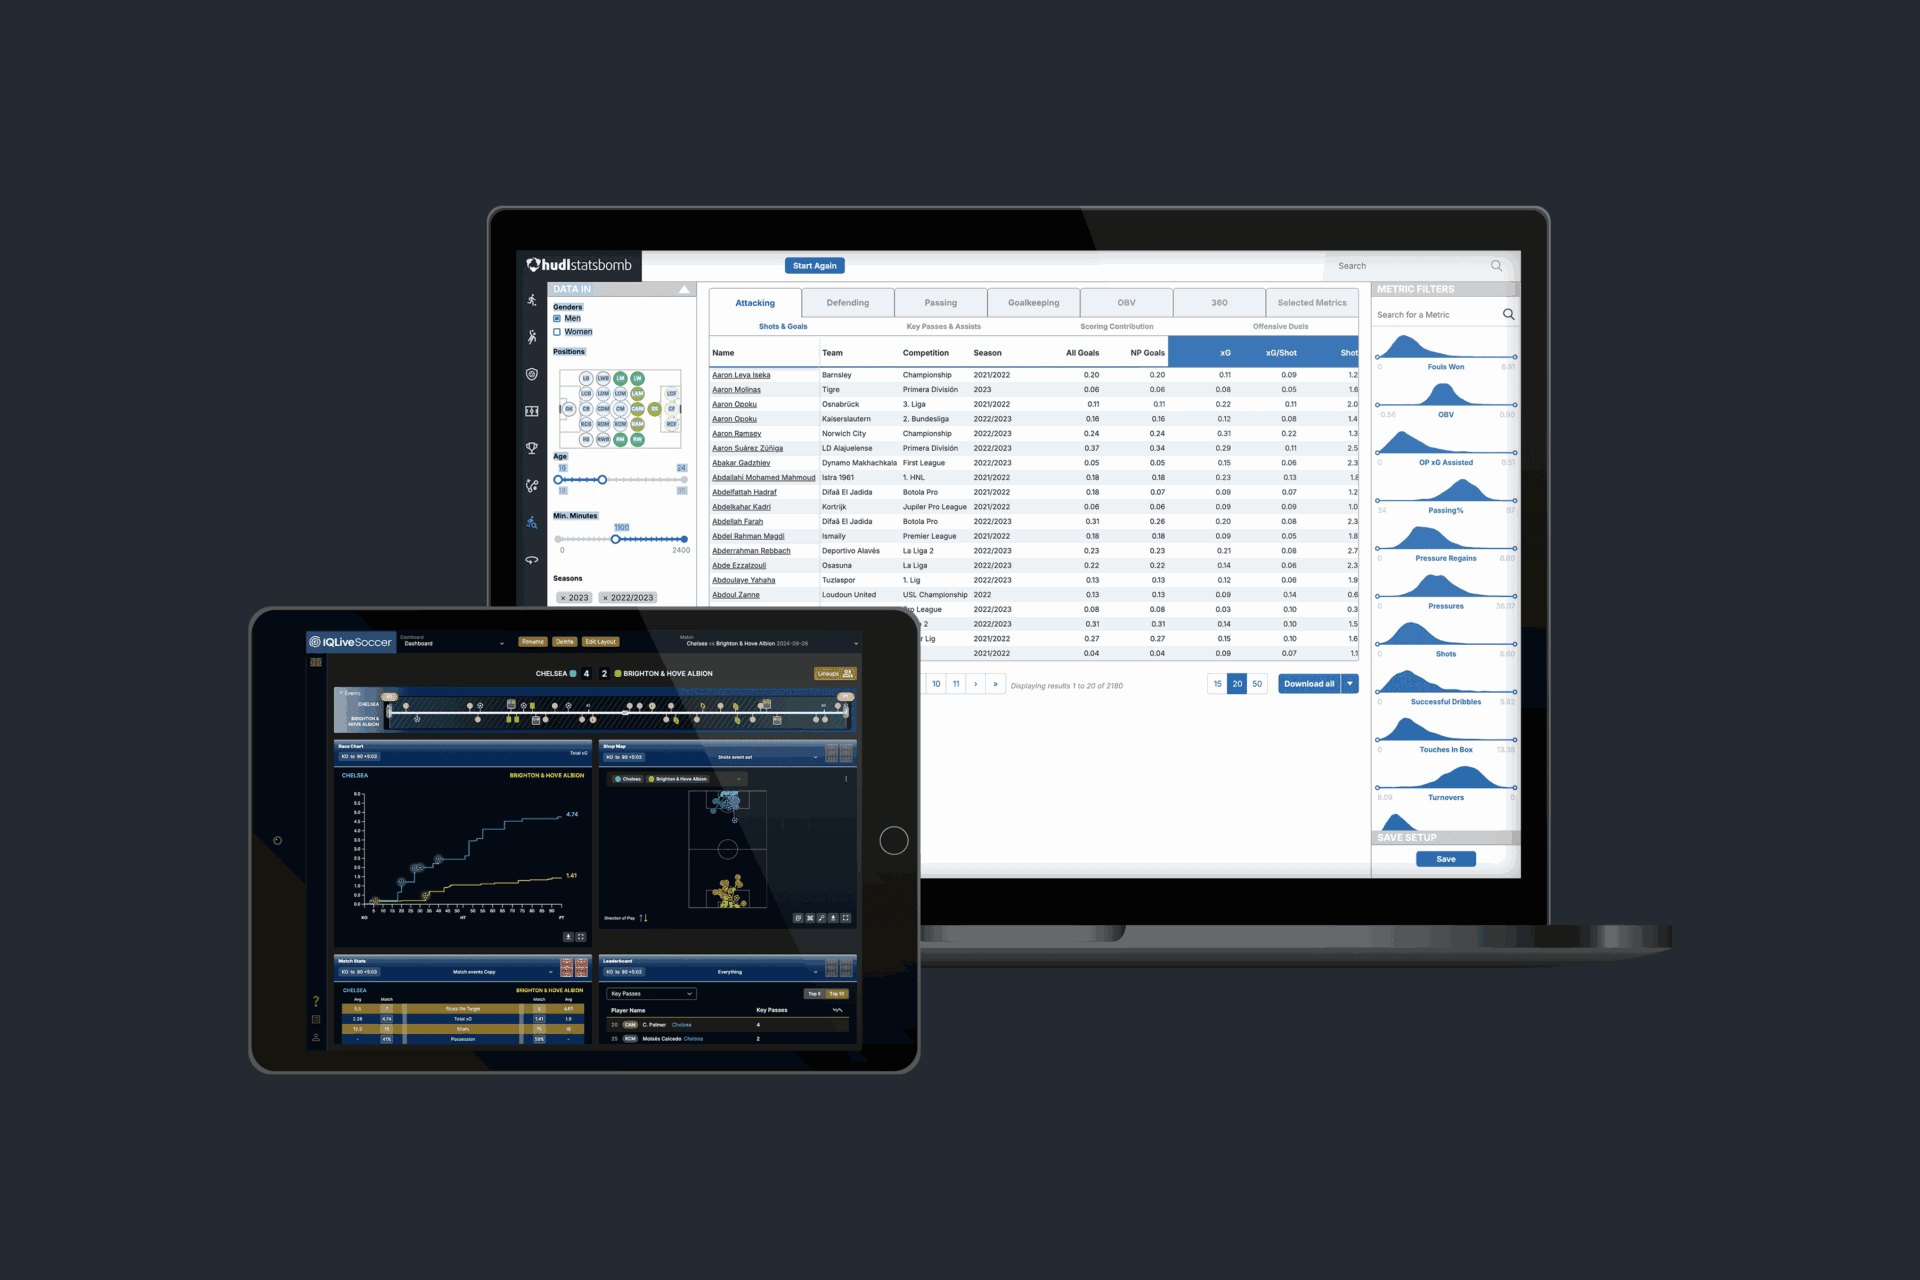
A live version of our market-leading xG
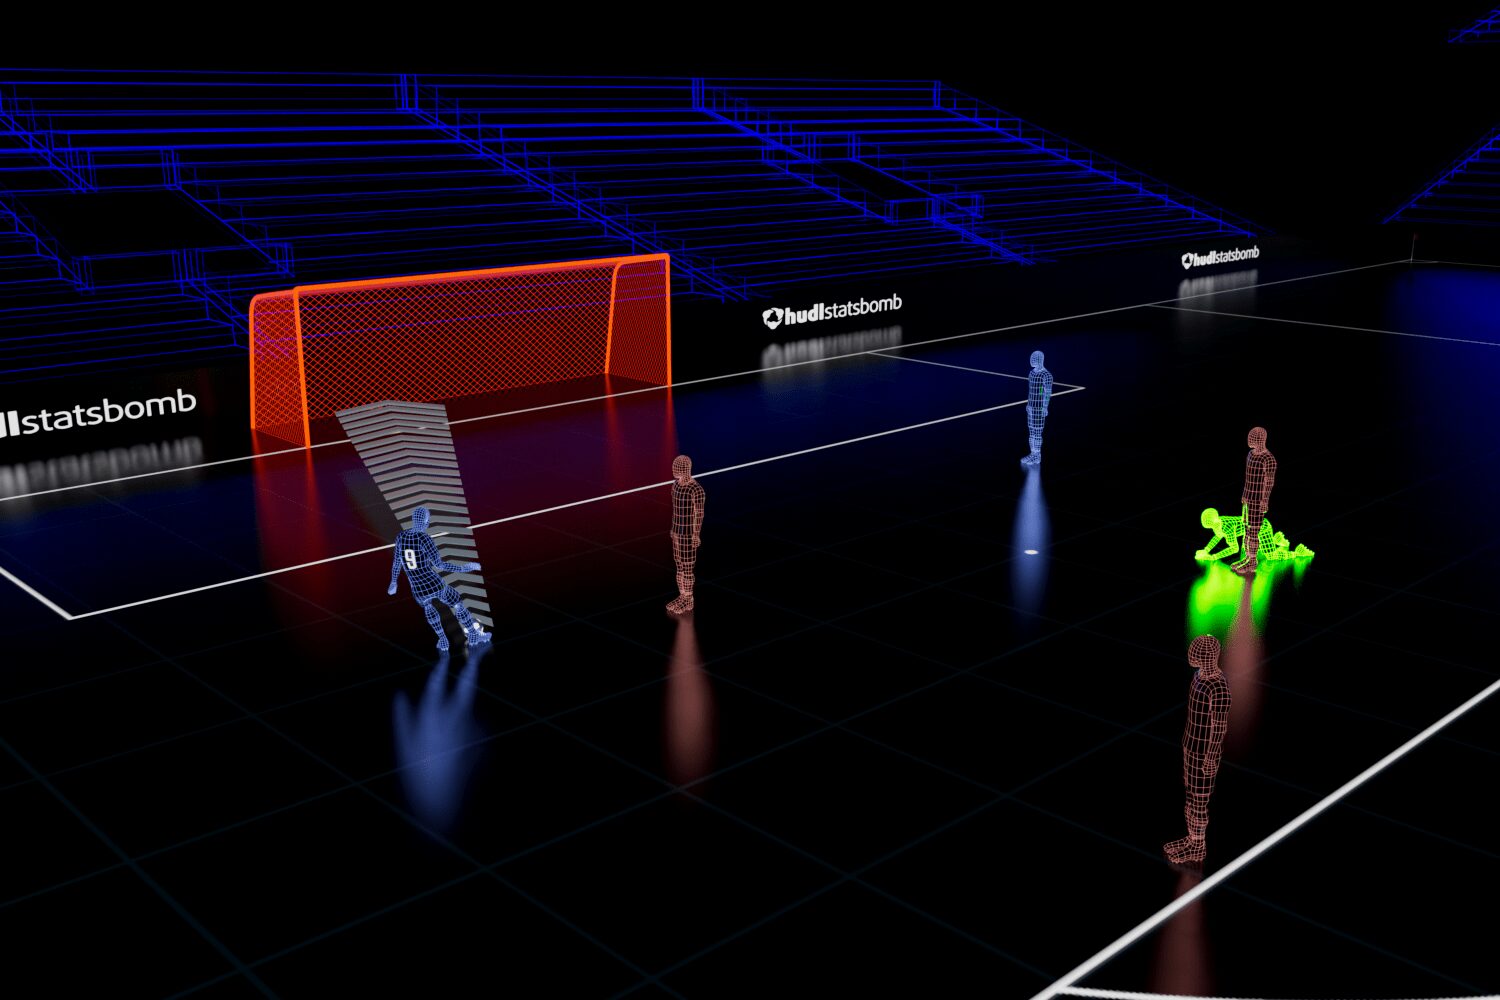
Both our Live xG and Post-Match xG use more contextual information to significantly outperform other models on the market
Competitor - 0.48xG
Poor quality expected goals models are misleading and quickly erode confidence

Hudl Statsbomb Live - 0.87xG
Captures additional context, including the position of the goalkeeper, the defenders and shot height to reveal a truer picture

Hudl Statsbomb post-match - 0.86xG
Our post-match xG model includes more contextual information - such as pressures to refine the output

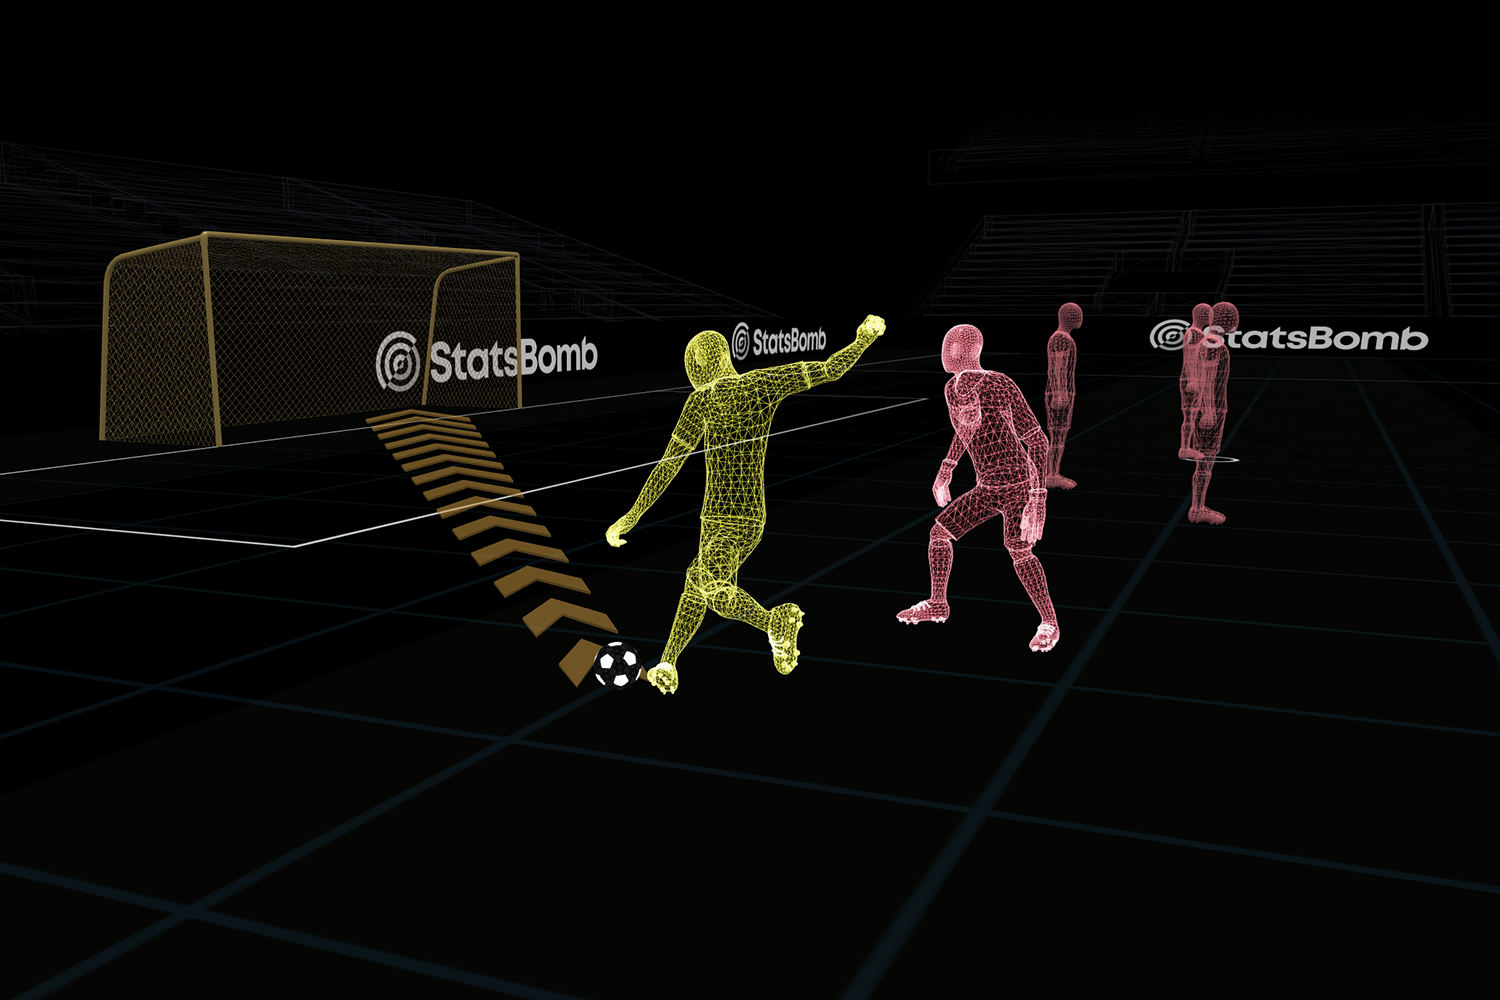
3D Freeze Frames
Relive any shot from the perspective of the shooter or the goalkeeper In three dimensions
Features
Match Dashboard
Add Player and Team Tables and Event Location Widgets, then save and share across your team. Responsive and optimised for touch devices like tablets
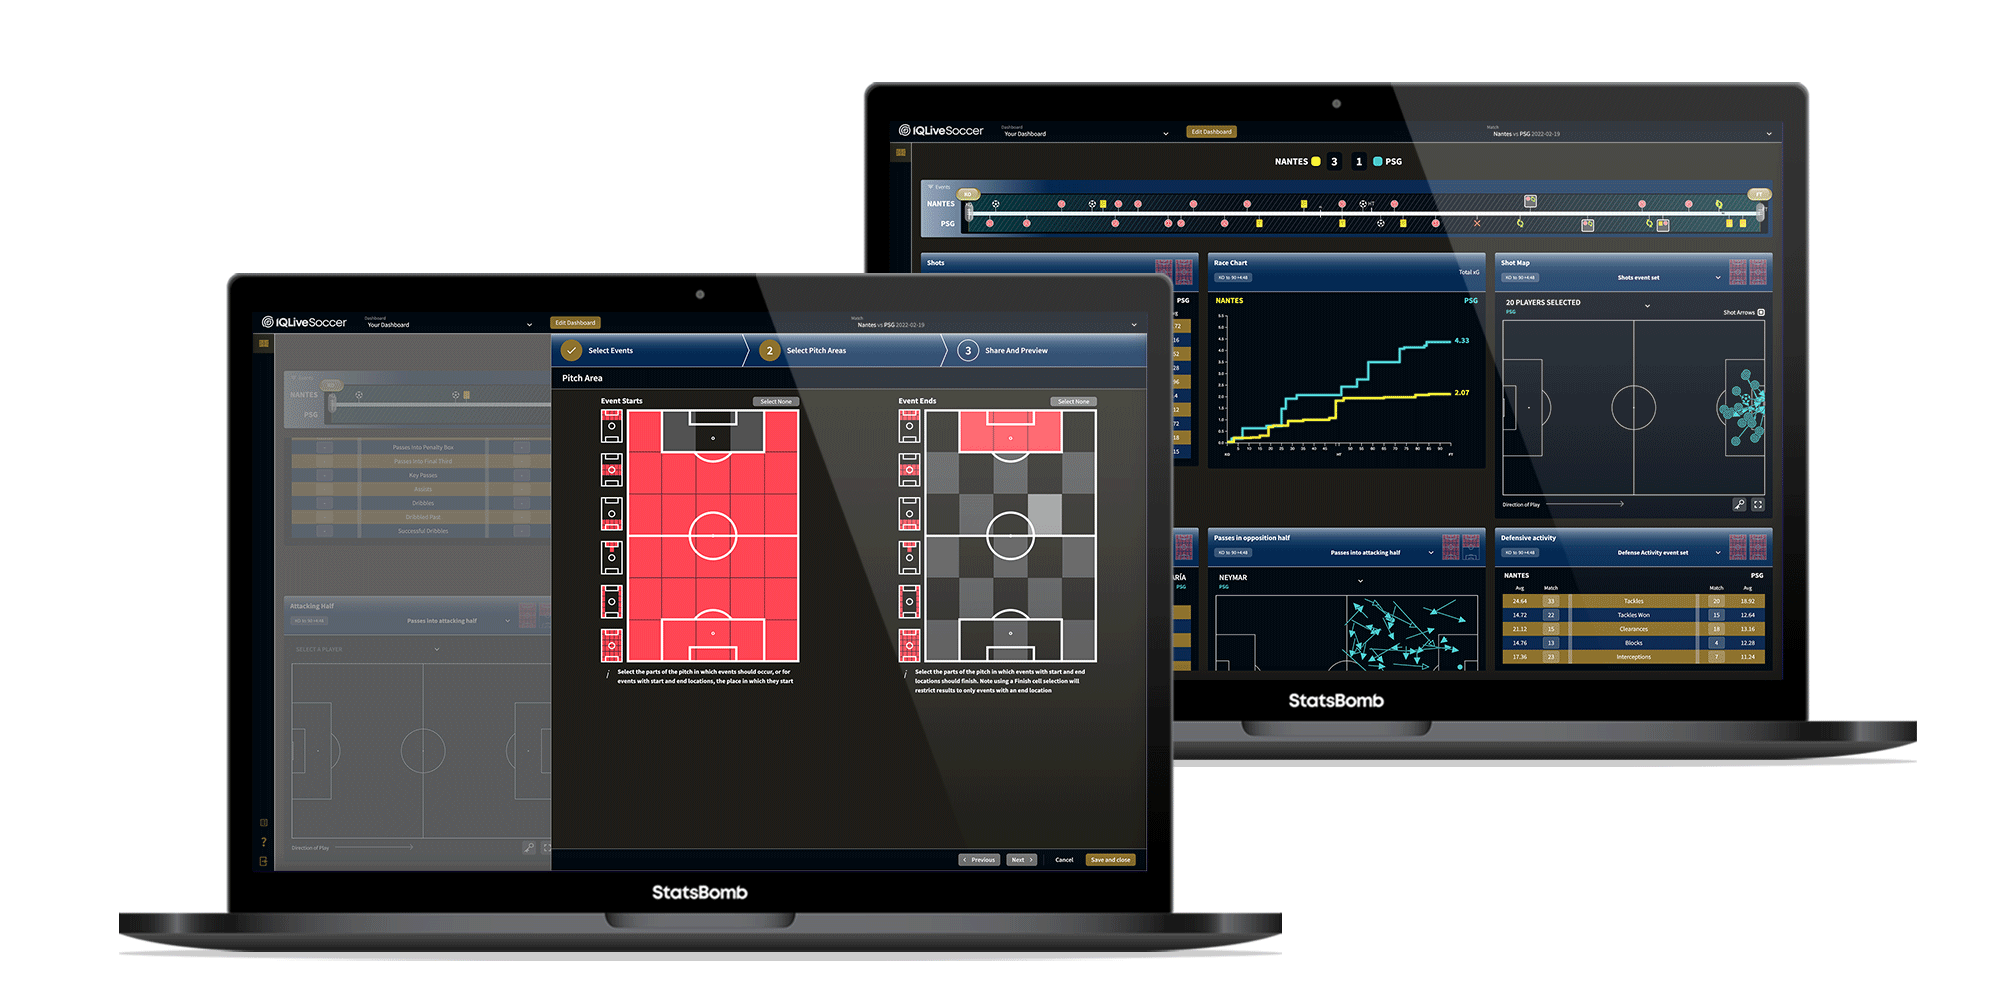
Match Timeline
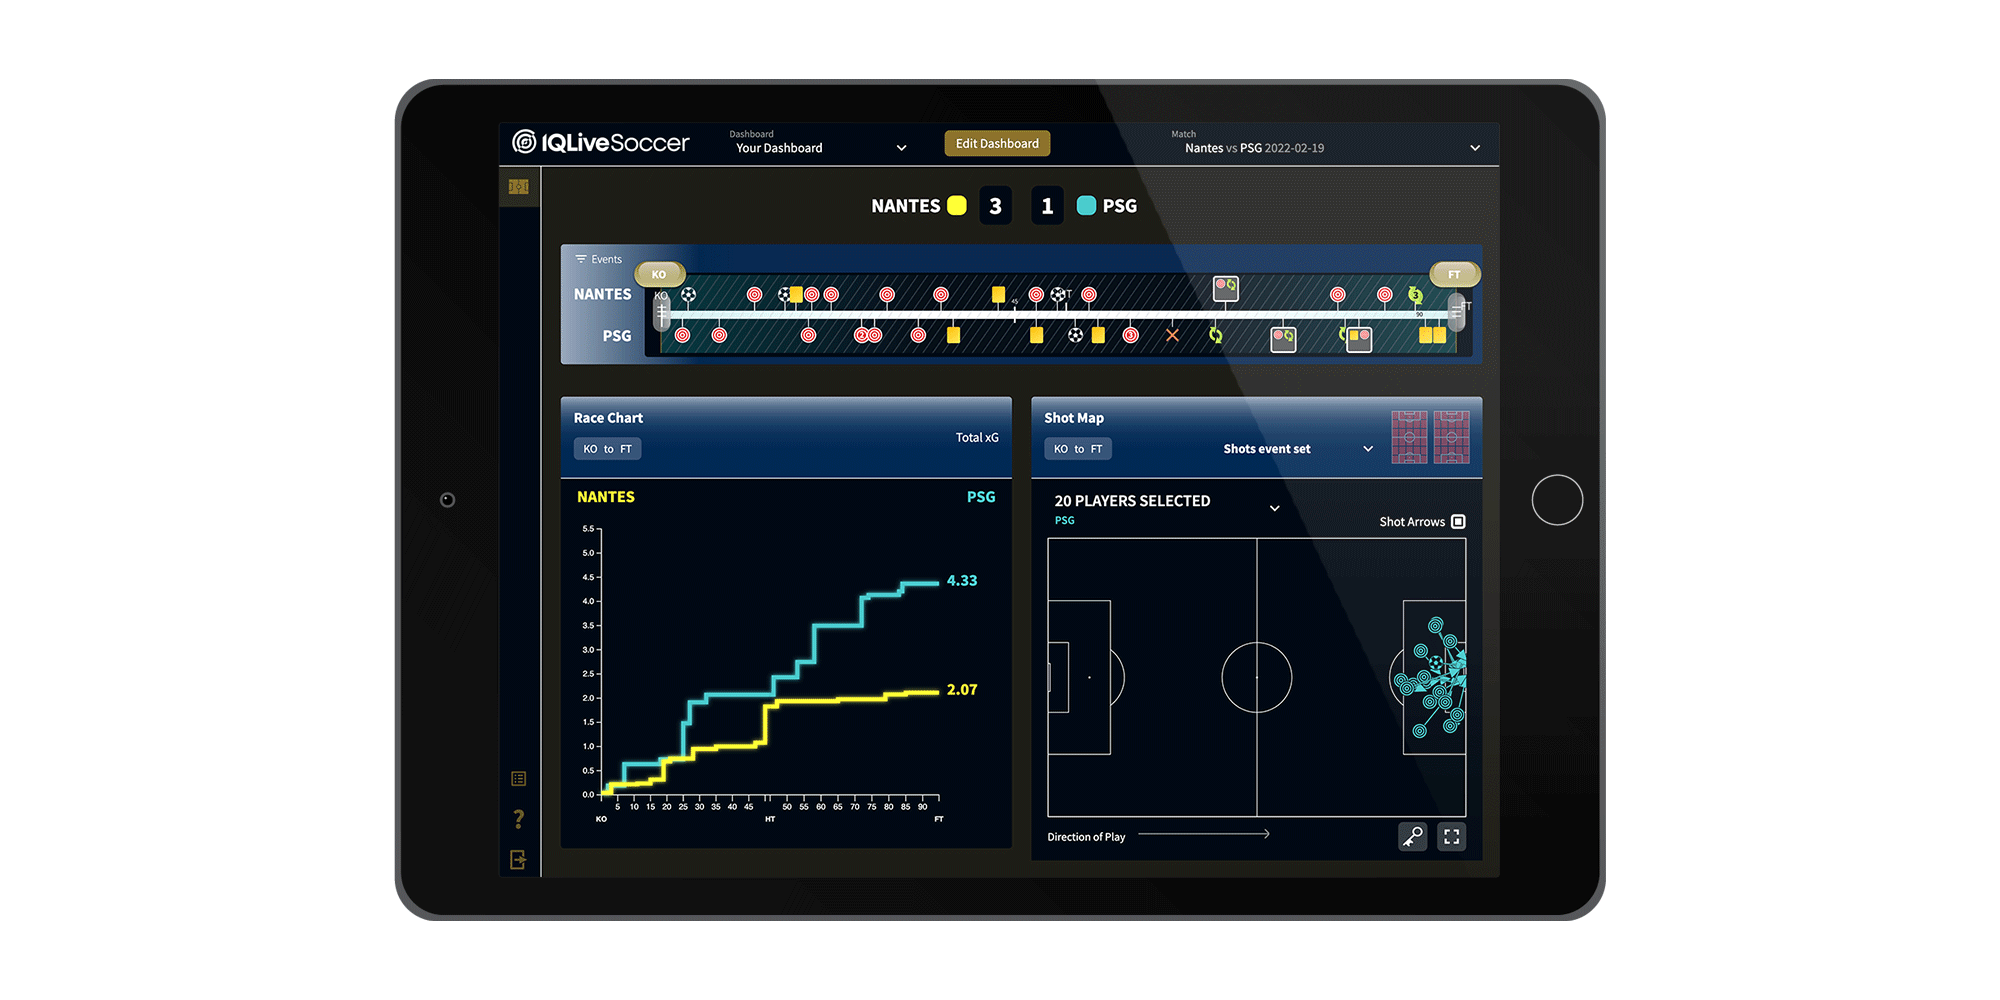
See every shot taken instantly. Use the timeline’s range selectors to select any part of the match, see substitutions and cards as the dashboard automatically updates every second
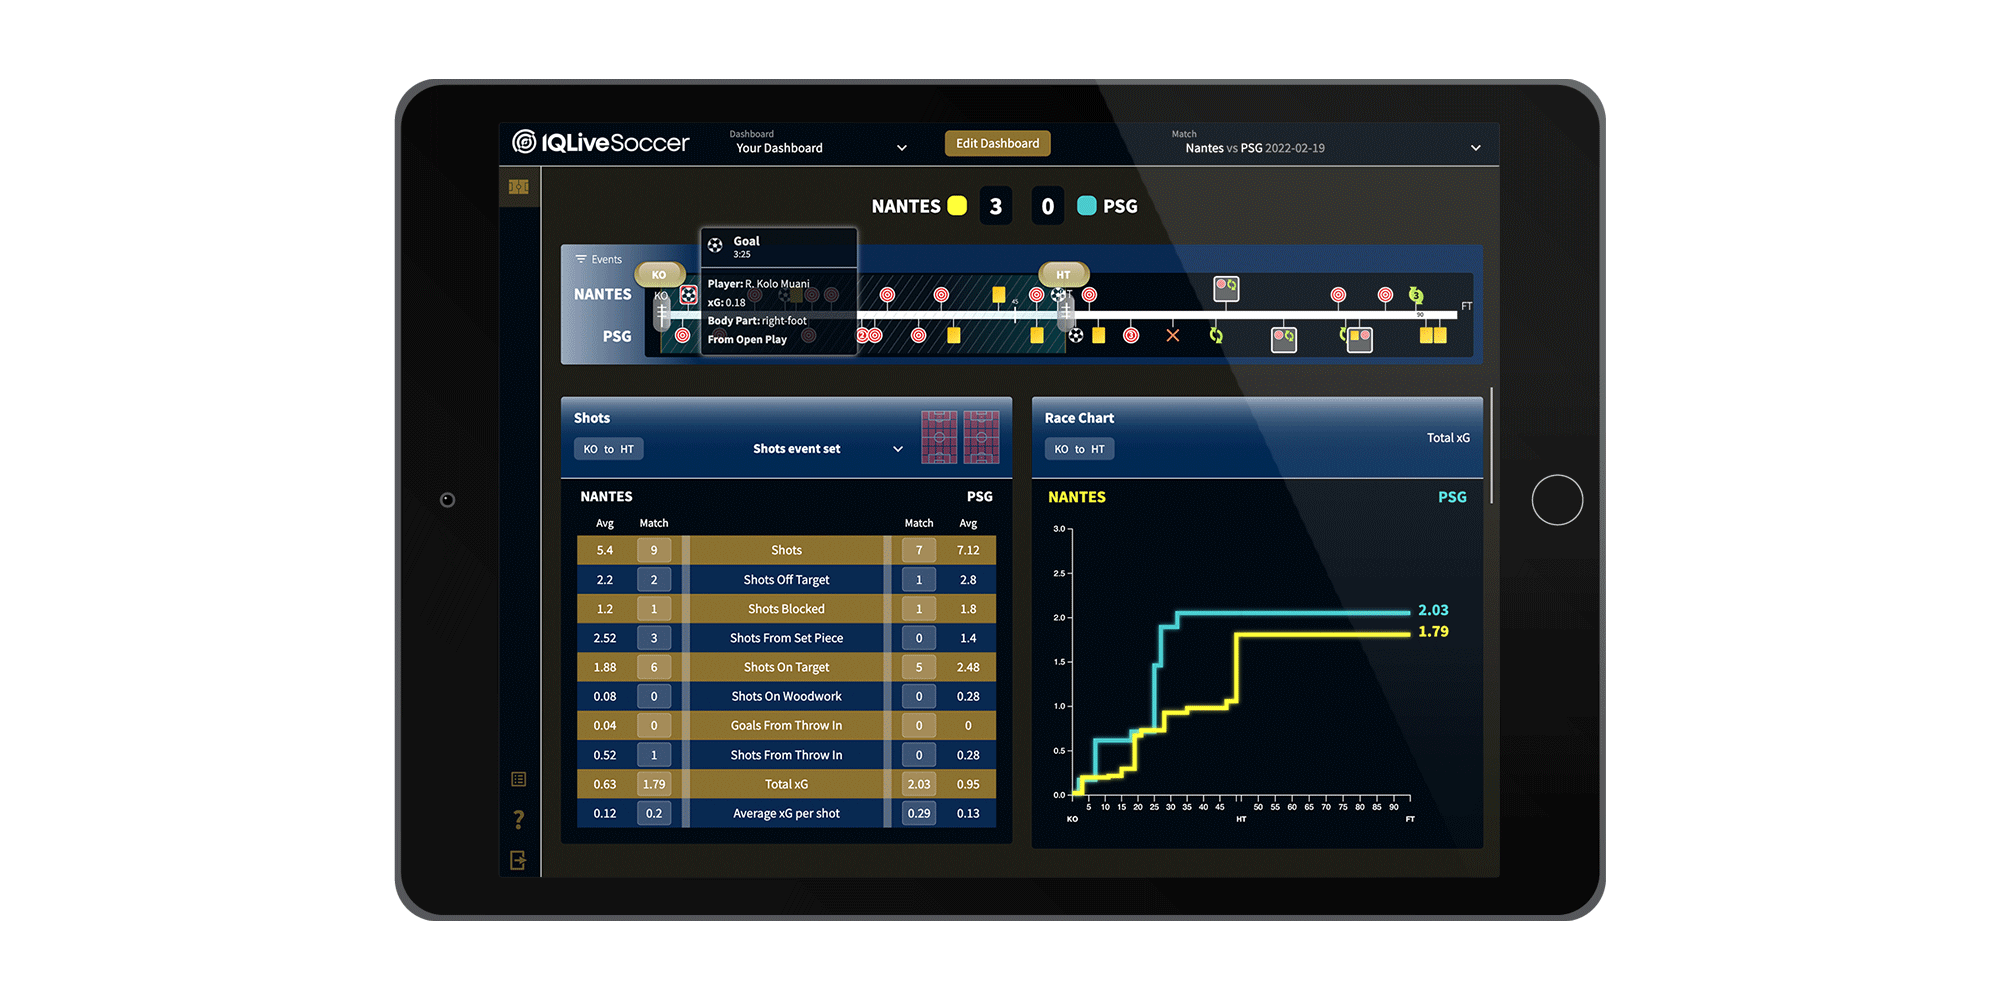
Race Chart
Allows you to monitor the flow of the match and measure the quality of the chances both created and conceded
Shot Map
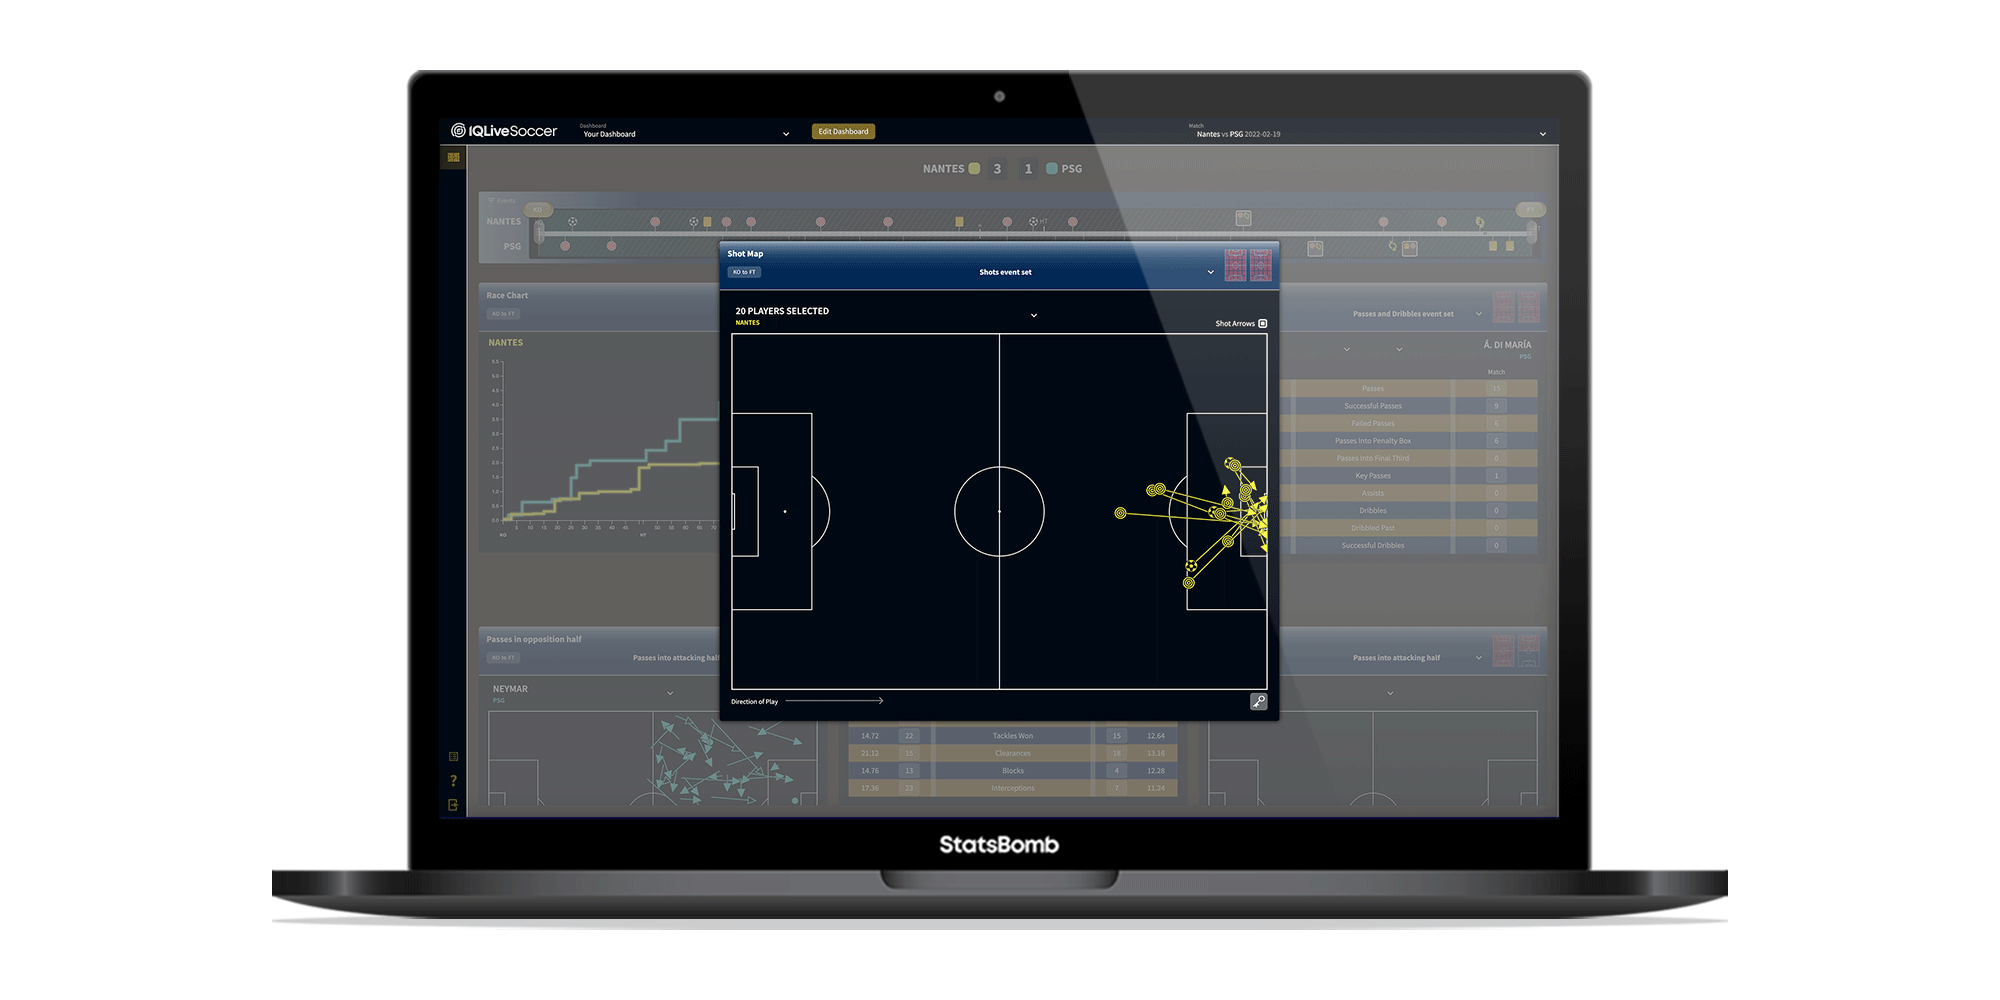
Show the locations and quality of shots from any area, players or either team
Flexible Tables
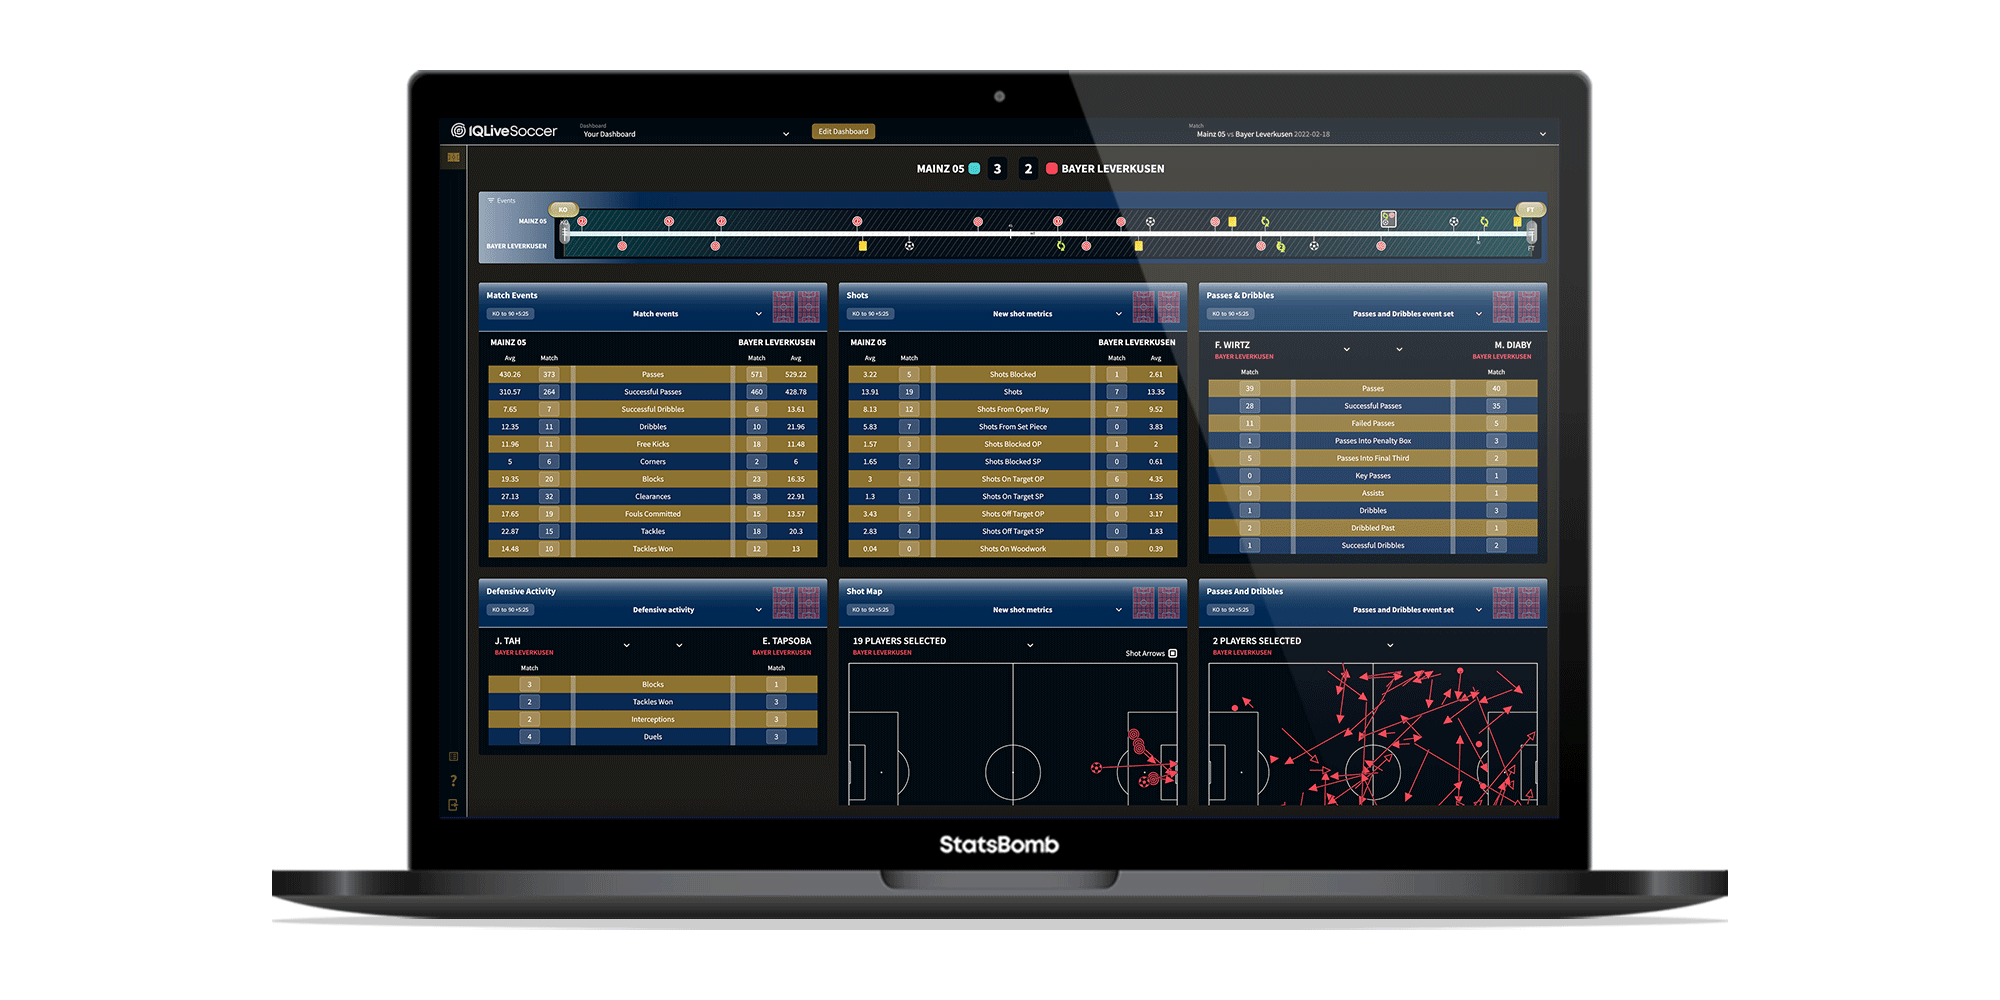
Whether you use one of our templates or want to build your own, our tables quickly group metrics and stats from all phases of the game
Event Location Widgets
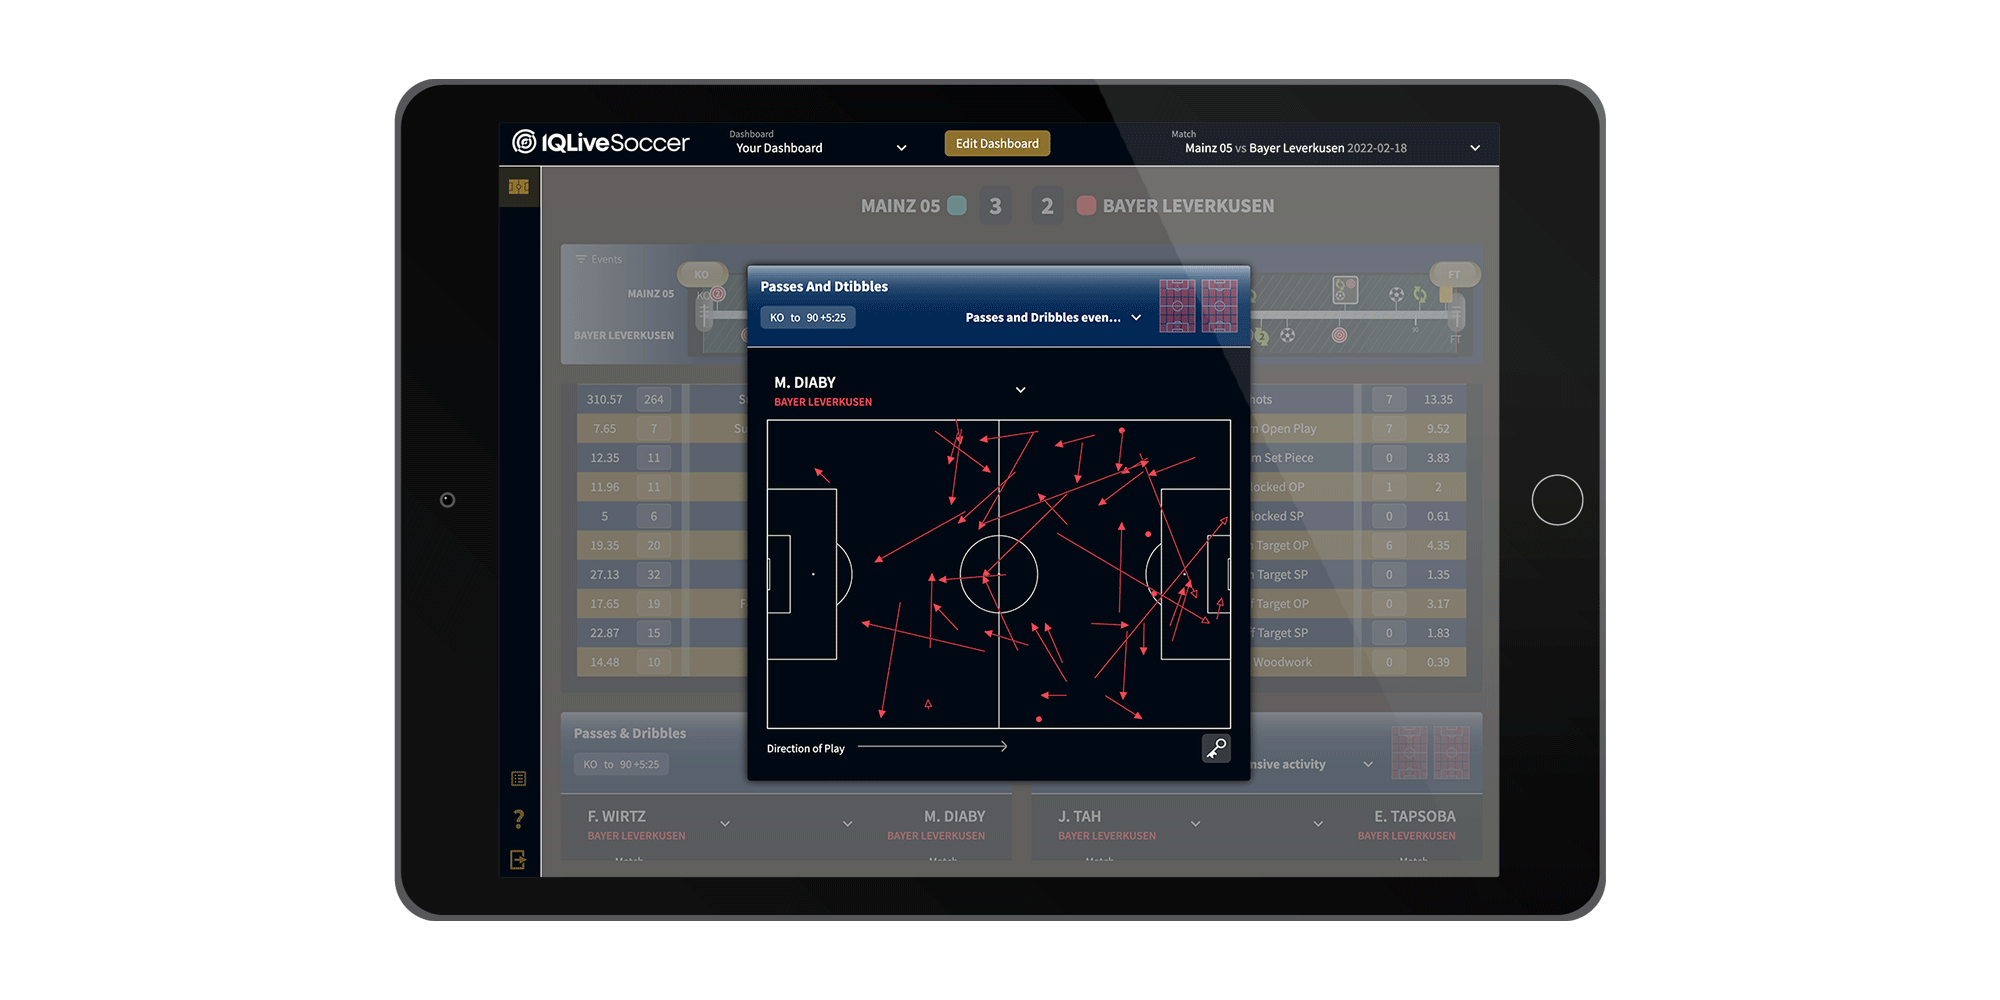
Highlight the events or metrics that matter and export impactful images at half-time, during the match or whenever needed
Seamless support
Integrated directly into our Live Analysis Platform, Hudl StatsBomb Assist is our self-service support platform filled with video-based tutorials, answers to the most commonly asked questions and the latest product release notes
Learn more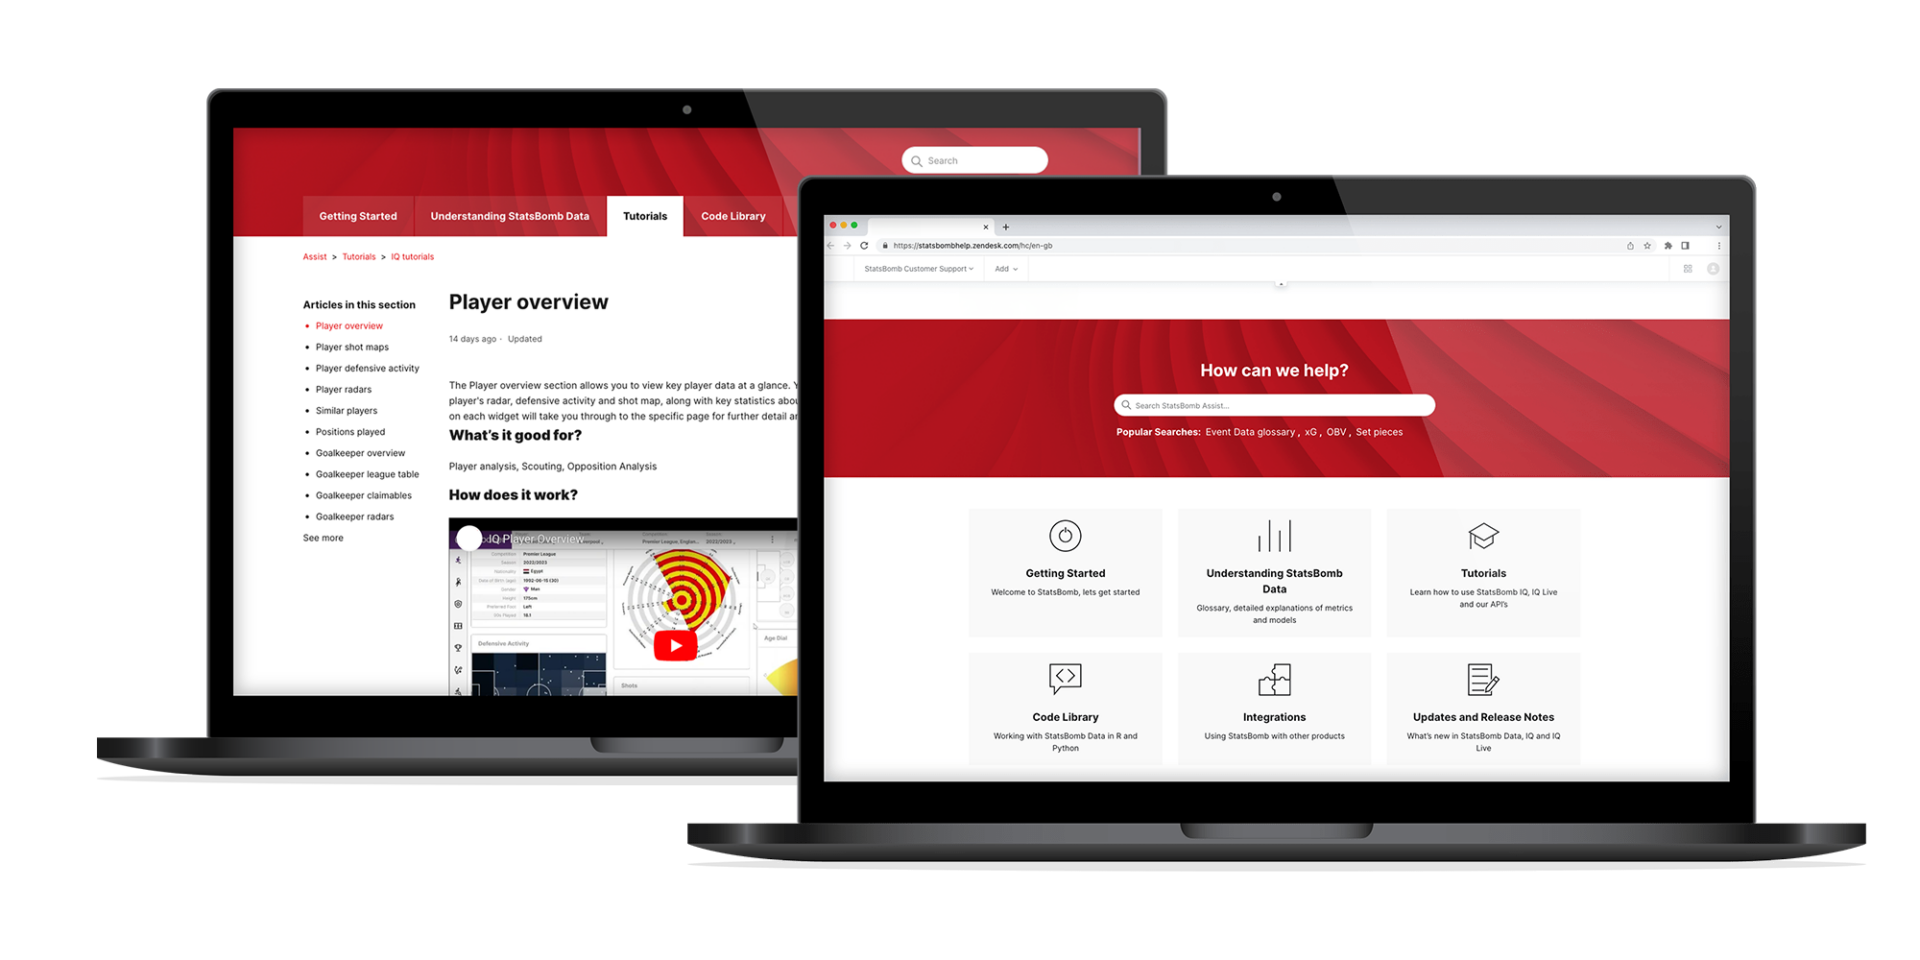

Related products
Every Hudl Statsbomb product has been built to solve real problems and unlock real opportunities
Data
The best Soccer Data ever created for 140+ competitions. Why settle for anything less?
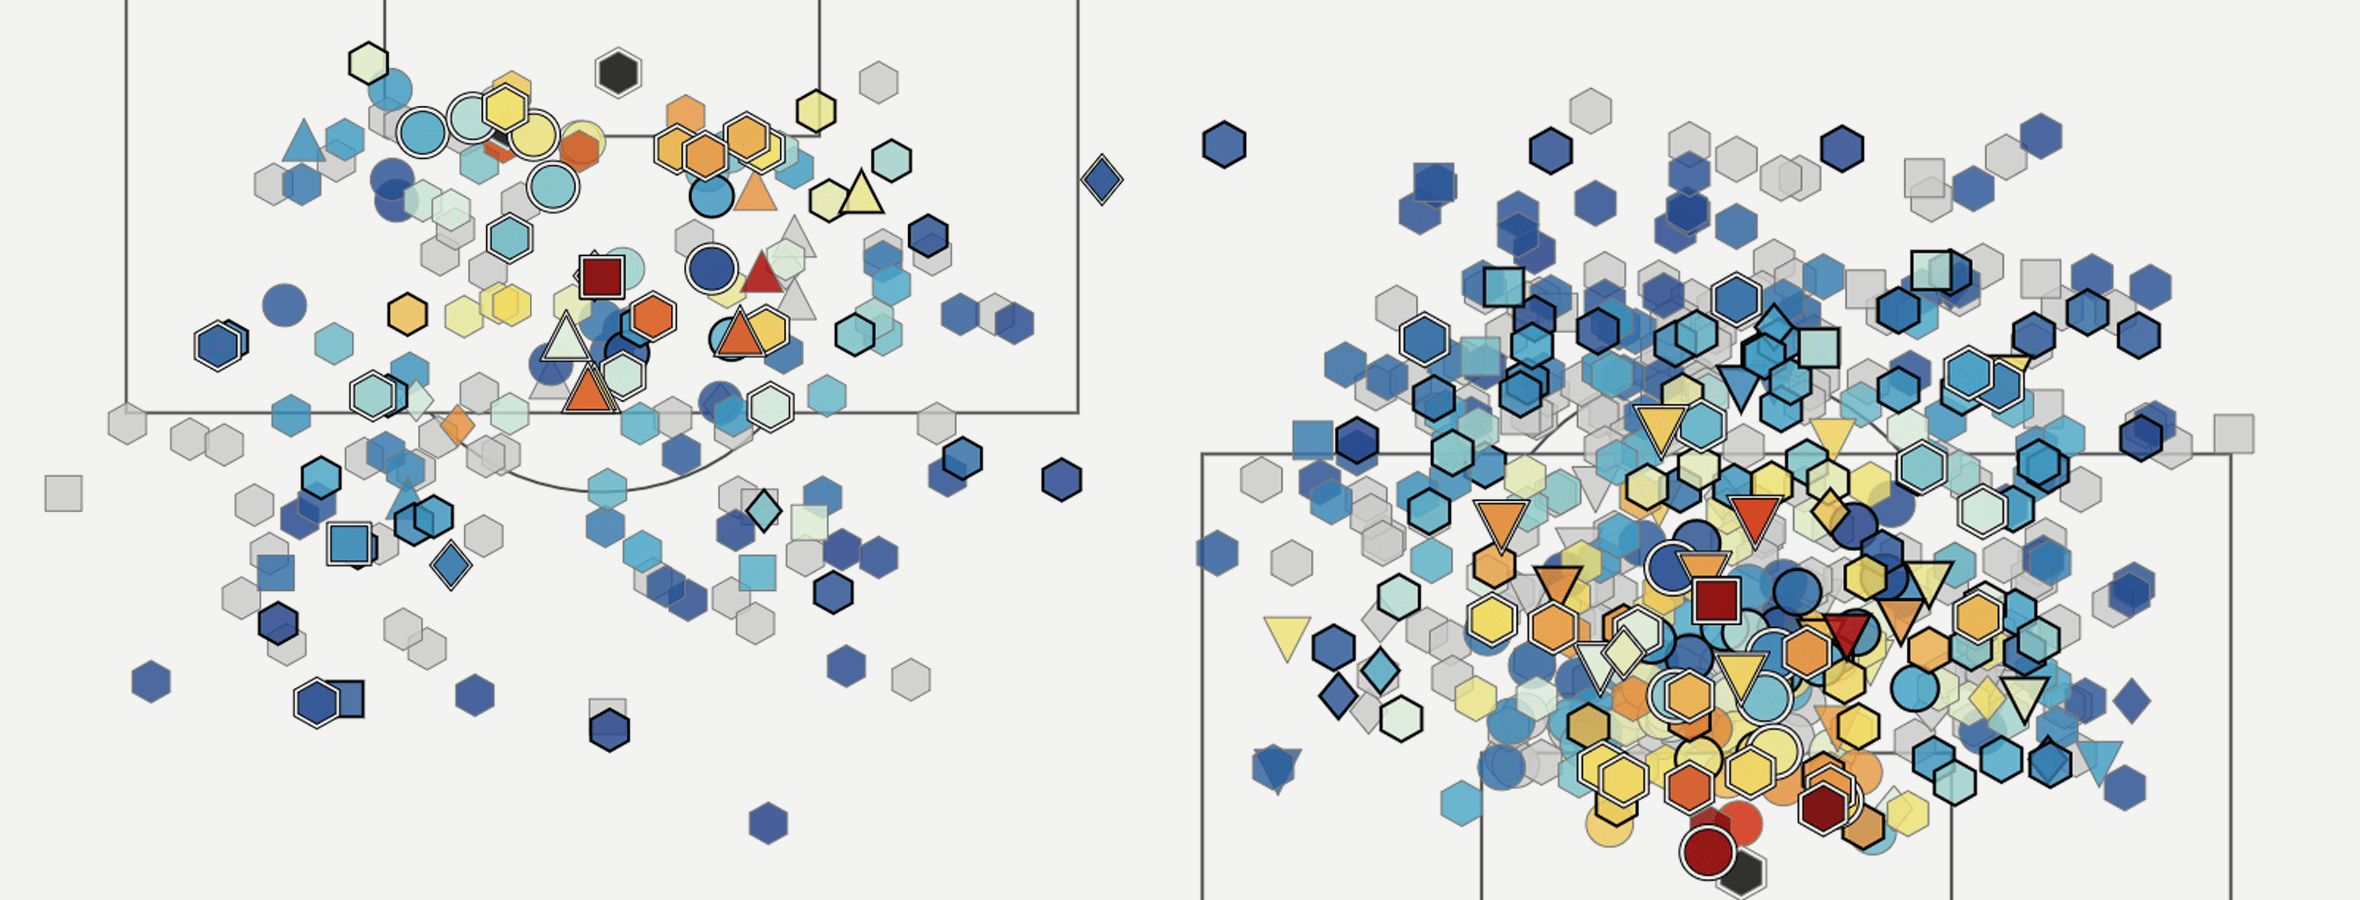
Analysis platform
Critical decisions are made easier and more efficient with intuitive, accessible and immediate visualisations of our world-class data
