With Man City's win over Aston Villa on Wednesday night it now appears that Liverpool will narrowly fail in their quest to win the 2013/14 Premier League. Regardless of the destination of the Premier League title, the general consensus is that the Reds have improved considerably from last season. A cursory look at the league tables appears to confirm this to be the case.
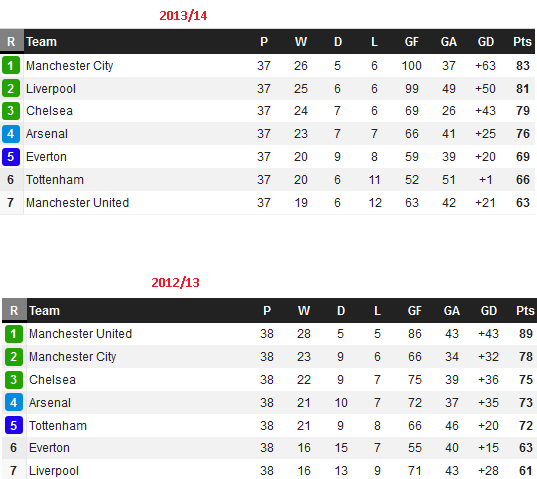
With one game left to play, Liverpool have already gained 20 league points more than last season. Unsurprisingly, their goal difference is also showing a marked improvement as they have scored 28 goals more whilst conceding just 6 goals more than last term – this equates to an improvement in goal difference of 22 goals compared to 12 months ago.
However, for me, the improvement in the general performances of the team isn't quite as marked as the league table suggests being the case. Before Liverpool fans shut down this page please note that this isn't entirely a bad thing.
Last Season
We live in the “here and now” and a lot can happen in 12 months, much of which we seem to have the capacity to forget. The Liverpool team of 2012/13 that were dreadful in front of goal now seem to be from another era. Last Summer Constantinos Chappas wrote specifically about Liverpool’s wastefulness in converting chances during the 2012/13 season in this article The second plot in that article shows that Liverpool were just the 14th best Premier League team in terms of how they finished their chances (once the chances were controlled for quality).
Fast forward 12 months and things are entirely different, with the triumvirate of Suarez, Sturridge and Sterling seemingly knocking in goals for fun.
Expected Goals 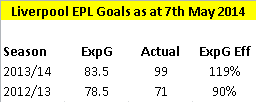
Based on our ExpG model (in short it assigns goal scoring probabilities based on the specifics of the shot) we expected Liverpool to score 5 goals more than last season. However, we have seen that they have scored a whopping 28 goals more than last term. This substantial increase in goals scored is due to the double effect of Liverpool’s finishing last season being very poor and this one being exceptionally good.
Liverpool fans may say that the brand of football their team is playing this season is much better and expansive than last season, that there has to be a greater difference than just 5 goals between what my model has expected them to score last season and this; that my model is wrong.
To coin a phrase use regularly used by Simon Gleave, this may be a case of Scoreboard Journalism. We (be that football fans or members of the media) tend to evaluate events by reference to the once off outcome rather than evaluating the process or by adequate reference to what “should have happened" . The difficulty with deciding what "should have happened" is that there is no one agreed uniform metric for how to measure this, but all I can say on this is that our ExpG measure is an objective measure that has used the same claculation method over the two seasons in question.
Liverpool's Fast Breaks
Perhaps my ExpG measure doesn’t accurately take account of the scintillating counter attacks that seem to have been the signature of Liverpool’s charge for the title. Thanks to some research undertaken by Andrew Beasley we can see that Liverpool have had 27 shots from counter attacks this season. So how does that compare with last season?
It may surprise you to discover that they also had 27 last term!!!
In Beasley’s article he makes the point that there is some subjective assessment by Opta in what qualifies as a Fast Break and there may well be attacks that many observers would think qualifies as a Fast Break but which Opta haven’t denoted as such. However, on the assumption that Opta have been consistently applying the same criteria in denoting a Fast Break over the last few seasons then this point is moot for the purposes of this analysis as the same narrow definition would have been applicable last term too.
It appears that Liverpool haven’t actually had more Fast Breaks than they had last season, but their conversion rate of 33% (9 goals scored compared to just 1 last season) on such attacks has perhaps fooled us into thinking that this form of attack has been used more often this season than before. Perhaps that notion can be put down to Scoreboard Journalism as well, although I do agree that there is the possibility that Liverpool attack in a manner that could provide them with good scoring opportunities which Opta do not classify as a Fast Break. More on this later.
Liverpool’s Shot Choices
Liverpool’s average shot quality has improved this season, with their average ExpG per shot (exc penalties) of 0.118 dwarfing the 0.101 they achieved last season. However, this improvement in shot quality has partly been offset by the fact that they are shooting considerably less than last season. With 1 game remaining, the Reds have taken 101 less shots than during 2012/13. I’m not arguing that this drop off in shot volume is necessarily a bad thing (as the conversion rates are so low on long distance shots) but it helps explain why we have Liverpool in for just 5 more goals than last year despite an increase of almost 20% in their average shot goal chance.
The difference in the shot choices taken by Liverpool this season can be clearly seen in the Shot Charts, with the 13/14 chart being shown on the left, and last season's Shot Chart appearing on the right.
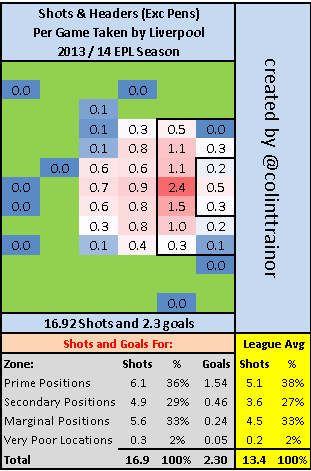
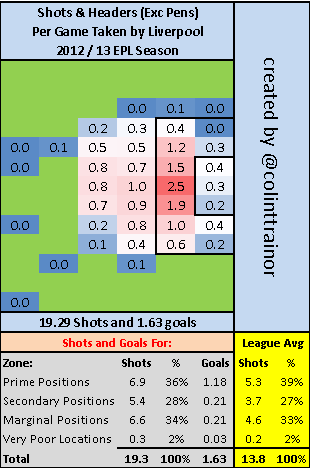
We can see the noticeable reduction in shooting volume by almost 2.5 shots per game (19.3 down to 16.9), but the shots from within the Prime Zone (central area inside the penalty area) has reduced by just 0.8 per game. The remaining decrease of 1.5 shots per game in shot volume has occurred in the Secondary and Marginal zones, where the expected conversion rates will be lower.
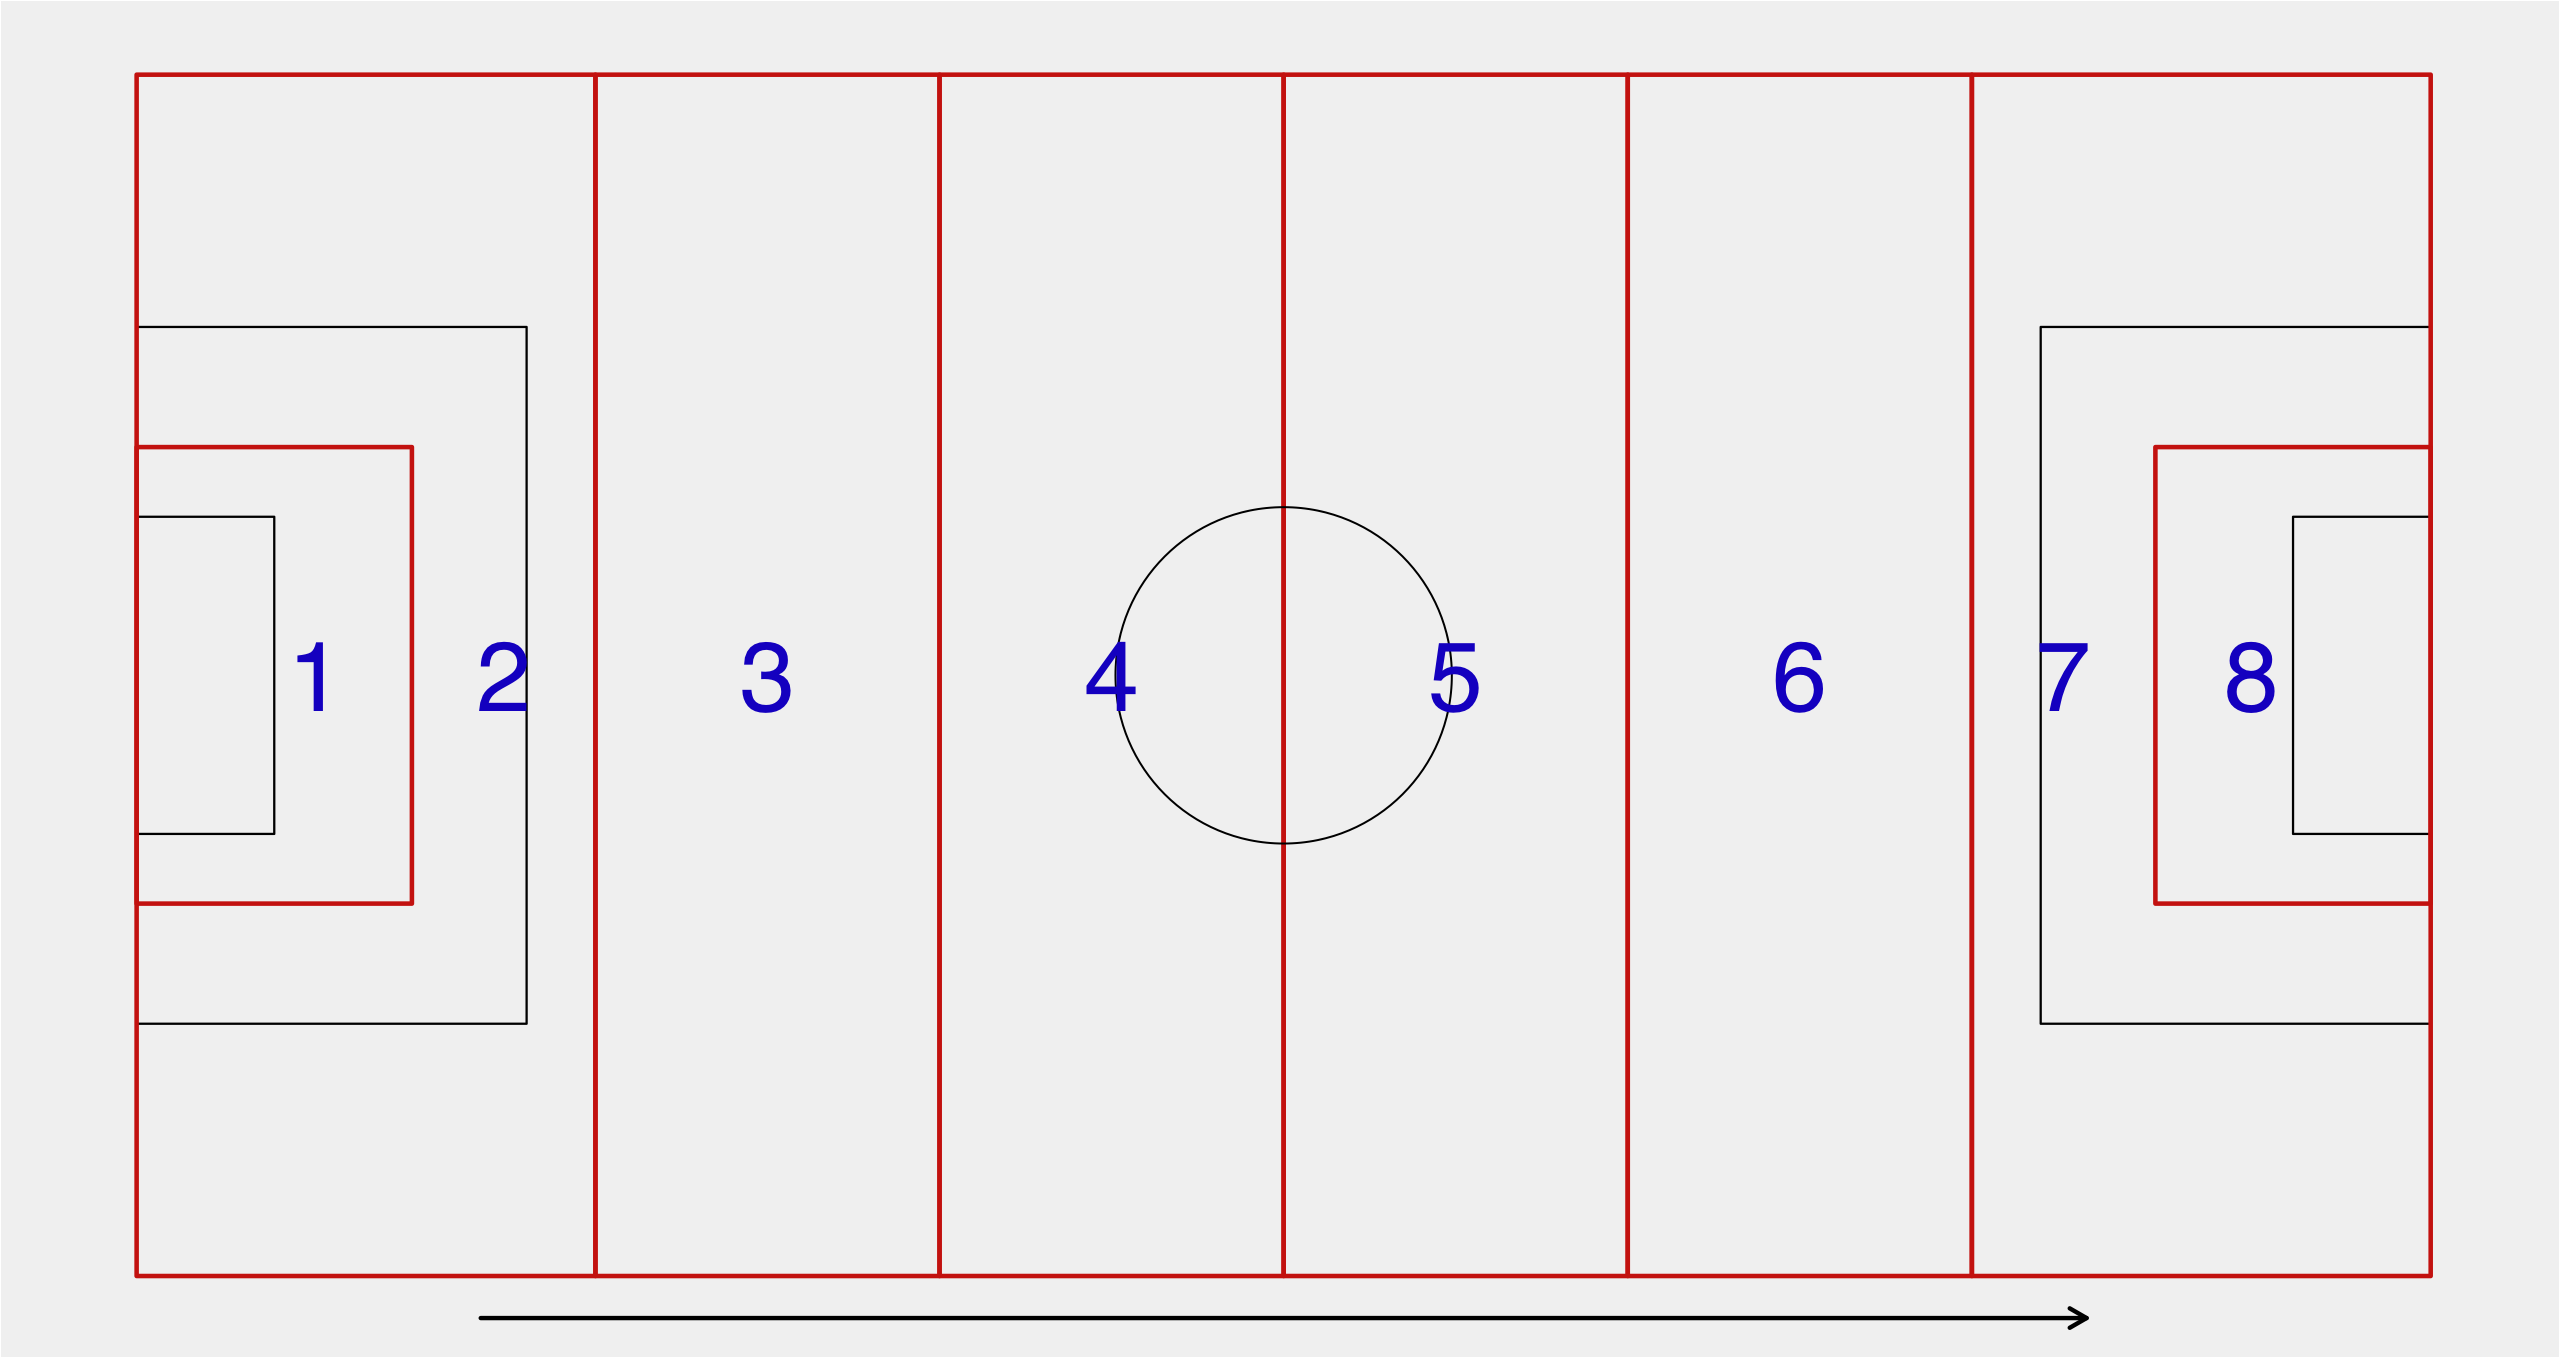
A template outlining the perimeters of the four zones has been included at the bottom of this article.
Although Liverpool are now shooting from smarter locations on average we can see why this only has the impact of increasing their Expected goal total by 5 year on year (albeit I am comparing the 37 games played so far this season with the previous full 38 game season).
So how the hell have they managed to score 99 league goals so far this campaign?
A 1 in 14 Season
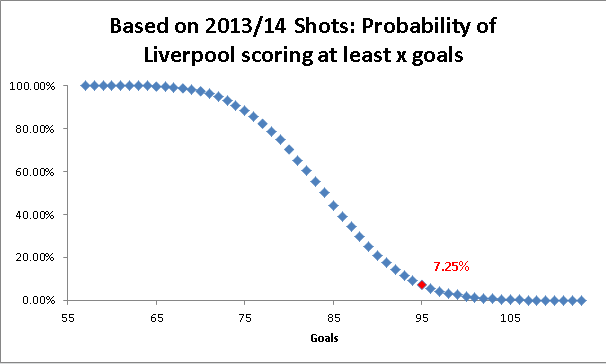
Very simply, Liverpool have had an amazing season in converting their chances; they have ran incredibly hot. I processed 10,000 simulations of the shots that Liverpool took this season and they achieved their current total of at least 95 goals (as this excludes Own Goals) just 7% of the time.
So, based on their shots taken, just 1 time in 14 could they be expected to score at least as many goals as they have achieved.
 Comparing to previous Premier League Performances
Using Opta data I have gone back 5 seasons in the EPL (until the start of the 2009/10 campaign) – this gives me a sample size of 100 (5 x 20) individual team seasons.
Shot Conversion %
Liverpool’s current conversion rate of 16% (99 goals from 638 shots) is the highest conversion rate for any team over the last 5 seasons. That is quite the accolade. Interestingly they are closely followed by this current Man City team.
(The table below includes OGs)
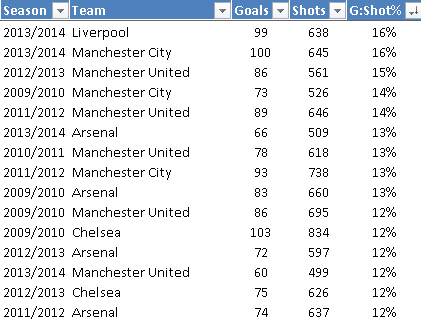
The two teams that immediately trail Liverpool in this metric are the mystical 2012/13 Man United side who somehow won the Premier league last year and the current version of Man City.
We have shown that Liverpool’s chance quality has improved this season, but their average ExpG (exc penalties) of 0.118 is lower than the two Manchester teams that immediately follow Liverpool in this table. Man United’s average shot quality was 0.13 last season, and the 2013/14 Man City team has an even higher average shot quality of 0.132. All three of these teams mentioned have over performed their Expected goals total, but none by as much as Liverpool have done this season.
On my numbers, Liverpool couldn’t have expected to convert at a rate of 16% of the shots they took this season - even allowing for their improved shot quality. However, this is exactly the feat they achieved and I can help to understand how that happened.
Liverpool’s Blocked Shots
As we draw towards the end of the season and I reviewed Liverpool’s shot numbers, the lack of Liverpool’s blocked shots was extremely noticeable. Using the same 100 team sample as outlined above, I looked at the rate which those teams had their efforts at goal blocked.
Once again, the Anfield side sit proudly atop this particular table, and comfortably so.
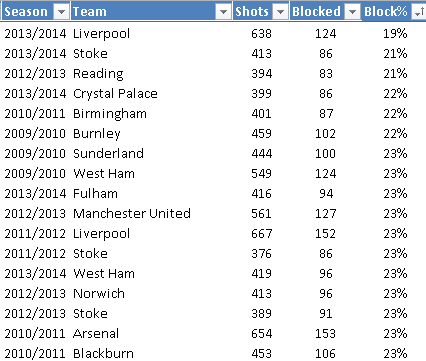
The other 99 teams had their shots blocked between 21% and 31% of the time, but we can see there is clear space between the remainder and Liverpool’s incredibly low blocked shots ratio this season of just 19%. It may be suggested that with Liverpool’s very fast transitions it is reasonable to expect a lower rate of blocked shots than the average team due to the opposition defences being unable to set themselves properly. However, I have shown that, according to Opta, Liverpool had the same number of Fast Breaks as they had last season and at 27, they have just 6 more than Man City have had this season.
It is possible that Liverpool’s attacking strategy is such that they do have faster transitions than other teams, yet they don’t trigger Opta’s definition of “Fast Break”. However, in the absence of more detailed data I have no alternative but to work with this (possibly) narrow definition. I would like to revisit this area again if detailed event data becomes available, but until then I can only make reference to the Opta designated Fast Breaks and this metric doesn't seem to explain away such a low rate of blocked shots.
Having Few Blocked Shots is good?
Of course this is the case, but if I were a Liverpool fan I would want to know how likely it is that their team will enjoy such a low rate of blocked shots again next season. Is this aspect of Liverpool’s attacking strategy something that they can hope to replicate next season?
Looking at the EPL for the last 5 seasons I plotted the correlation between Blocked Shots % in Year n and Year n+1, ie how repeatable are offensive blocked shot percentages.
As I needed two consecutive seasons in the Premier League, I was left with 68 pairs of Blocked % to plot as follows:
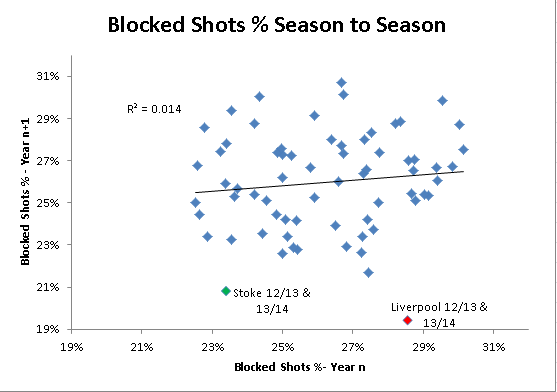
Although the sample size is small, unfortunately for Liverpool there appears to be virtually no correlation between a team’s percentage of shots that are blocked from one season to the next. A perfect example of this is Liverpool themselves.
The Reds’ record low Blocked % of 19% this season follows last year’s 29%. Out of the 100 teams, their 2012/13 rate of blocked shots was 84th, but just 1 season later Liverpool followed that up with the best ratio posted in terms of blocked shots %!!
I have previously shown that the further out a shot is taken the greater the chance that it will be blocked. We have seen that Liverpool have been shooting smarter this season, however, the differences in the rate of being blocked are nowhere near large enough to explain a difference of even 1%, never mind 10% over their entire shot sample for the two seasons in question. The above plot also visually shows us just how much of an outlier Liverpool’s rate of blocked shots this season has been.
Based on the data available to us, which currently excludes very detailed event data, I don’t see any reason for Liverpool to expect to enjoy such a low rate of blocked shots again next season. There is always the possibility that I’ll be proven wrong as every outcome has a chance, no matter how small - just like Liverpool had an extremley slim 1 in 300 chance of winning their 11 games in a row. Perhaps Brendan Rodgers may do something that EPL managers have generally failed to do over the last 5 seasons, ie come up with a tactical wrinkle that leads to a consistently low rate of blocked shots. But until that point, I’m firmly in the “Liverpool will regress in respect of their percentage of blocked shots next season” camp. Needless to say, if that does happen then Liverpool's scoring percentage will correspondingly drop. Liverpool’s Defense
One aspect that Liverpool could improve on next season is in defence. Jamie Carragher, amongst others, has been critical of Liverpool’s defense.[youtube id="ptF89E-MEAs" width="640" height="360"]
I’m not going to comment on whether Liverpool have been below par in preventing opposition chances, but my numbers tell me that Liverpool have defended the chances they have conceded poorly with the concession of 6 more goals than I would have expected based on the opposition shots.
When I take into account the shot placement, it is clear that Simon Mignolet has had a poor season (as far as shot stopping is concerned). There are 17 Premier League goalkeepers that have faced at least 100 on target shots this season, and Mignolet has been the worst performing keeper of them.
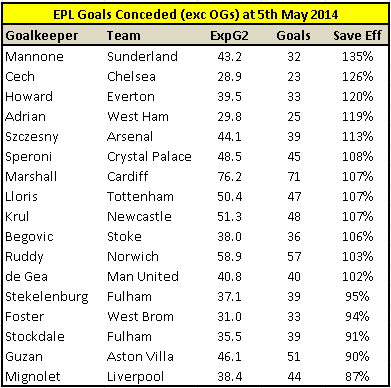
Based on the Shots on Target faced by the Belgian, I estimated that he should have conceded 38 goals, instead of the 44 (this excludes Liverpool’s 5 Own Goals allowed) that he did concede. These numbers result in a save ratio of 87% which places him at the bottom of my Goalkeeper Saves ranking table for 2013/14 (of those that have faced at least 100 shots).
Although this information will make sorry reading for the Liverpool defence, the analytical work undertaken in the area of goalkeeper saves, such as this by Sander Ijstma suggests that there is next to no correlation in terms of how saves above or below expectation correlate from season to season. One possible reason for this is that the difference in shot stopping skills between professional top-flight goalkeepers is so small that the inevitable variance inherent in facing less than 200 shots per season drowns out any signal that there may be in the data.
As with Liverpool and their blocked shots, Simon Mignolet is a perfect example of this variance. Last season he was the 4th best Goalkeeper in the EPL as he conceded just 50 goals compared to the expected 62, yet 12 months later he appears right at the foot of the table. Proof, if it ever was needed about how volatility and variance plays such an important part in football, even over a full 38 game season.
The Future
In the event that Liverpool do not win the league this season I think that they will really rue this lost opportunity. Leaving analytics aside, the media have latched on to the fact that this season was a terrific opportunity for them to lift the title and there are several reasons why it might be more difficult for Liverpool to launch a similar title charge next term. Without me repeating these often trotted out reasons, example of same can be found here and here.
The reasons stated in those article may or may not come to pass, however I am confident that Liverpool have had a season in front of goal that they are unlikely to replicate in the near future. And, in the likely event that they don’t win the league this season, their inability to take full advantage of the way the cards have fallen in terms of their incredible shooting numbers will surely be frustrating for the fans and those involved with the club.
Liverpool fans point to the fact that they would have settled for Top 4 at the start of the season. On my ratings, Liverpool deserved to win a Champions League place last season. It was just their rank bad shot conversion that prevented this happening, but the underlying numbers don't back up the thought that there has been huge improvement in performance that the two league tables would suggest at first glance. As almost always is the case, when looking at two extremes I would suggest that the true picture is somewhere in the middle.
Liverpool are certainly amongst the best four teams in the country, and have been for at least the last two seasons. But although they could count themselves unfortunate to have come up against a Man City team that themselves have overperformed in terms of ExpG this season (although not as much as Liverpool have done) I can't help but feel that this was a terrific chance for the Reds to win their first Premier League.
Finally, unless their chance quality improves even more next season I'll be surprised if Liverpool are able to post the same sort of goal totals that we have seen this season, in which case 2013/14 really was a missed opportunity.
Unless of course that Man City do the untinkable on Sunday at home to West Ham.
Zones Template for Shot Charts