
We’ve known for a few months now that defensive rate stats at the team level are fairly useless. Tackles and interceptions – the base defensive action metrics - have almost no correlation between shots allowed or goals scored. However... once you adjust these numbers at the team level for amount of possession, the r-squared when compared to shots conceded, goals allowed, etc generally shoots up in the .4 range, which is about the same as you get for possession itself. This isn’t perfect, but it’s not meaningless, which is a positive.
The reason we see a much higher correlation when we adjust defensive stats for possession is simple: opportunity. If your team has possession of the ball, you can’t rack up defensive rate stats. Teams that have a ton of possession don’t give their opponent the ball very often, and thus can’t accumulate defensive stats.
What do you do when you know the basic rate stats are meaningless? You adjust them. Hopefully in a way that isn’t completely terrible, but we’ll wait and see on that.
But what about at the player level? Shouldn’t a guy who plays on a team that always has the ball (think of Sergio Busquets) get more credit than a guy who plays defense for a team that never has the ball (think anyone who plays for Tony Pulis)?
Of course! Math and logic both say this is correct.
So, those of us who are working on the player stats side of things need to adjust the numbers to compensate for this. As long as you have the data, this shouldn’t be that hard, right?
*sound of crickets chirping*
The initial adjustment method I used had some issues with extreme values. Barcelona’s int + tack went from 36.8 up to 97 or so. When you distribute that at the player level, what you end up with is Dani Alves making 13.4 tackles and 10.6 interceptions. I like Dani Alves a lot, but... that’s a tough pill to swallow. This is especially true once I started thinking about changing the radars to account for this. One of the things I like about the radars themselves is that they are a snapshot of reality. These are actual numbers produced by a player in a season. By not using abstraction (like percentages), you keep them approachable to your average fan.
24 interceptions and tackles a match for Dani Alves is no longer approachable.
Thankfully, I work with really smart people like Marek Kwiatkoski, and he helped me find a better fit for the adjustment that remained at least somewhat attached to reality and maintained the solid correlation between goals conceded/shots conceded and possession adjustments. If you want to know more, skip to the methodology section at the bottom.
So What Now?
The point of all this was to see what we end up with at the player level if we adjust for a team’s possession. Tackles and interceptions as they currently exist are mostly just noise because they don’t account for opportunity – can we do better? Whatever we end up with, do you see the best players on high possession teams rise to the top of the rankings? If so, we’re probably on the right track in developing defensive metrics that also correlate to things that help clubs win matches.
Well, let’s see what happens to our tackle and interception rankings when we adjust them at the player level. We are working on English Premier League data for 2014. I’ve listed the rank of top 15 tacklers here by the sigmoid adjustment, then the simple adjustment (see the methodology section), and finally by their base numbers.
![]()
As you can see, the two forms of adjustment produce fairly similar ranks to each other, but can produce dramatically different rankings than the base numbers. And this is how the interception rankings change with the adjustments.
![]()
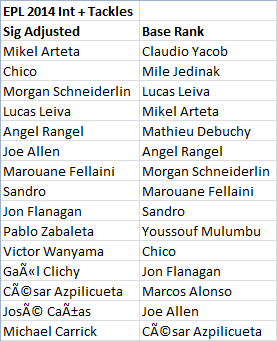
And finally the combined defensive output of interceptions plus tackles.
![]()
And if you want straight player names next to each other, the column on the left here is the sig adjusted rankings, the column on the right is the base rankings. Notice all the guys who play for top teams on the left hand side? That’s pretty cool.
Additionally, here’s a look at how much the numbers change from the base vs the sigmoid adjustment for the top 15 adjusted Int + Tackle guys in the league.
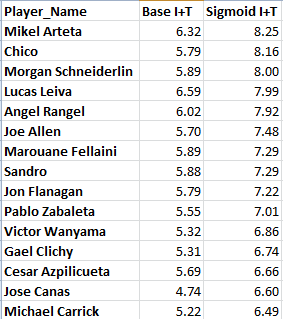
Those numbers are no longer “real” numbers. You could think of them as tackle and interception points or "defensive things" instead, if that makes it easier to swallow. They are, however, much more closely related to outputs that help teams win matches, which is exactly what we were looking for at the start.
This could probably be another 5000 words long looking at different leagues and such (people will obviously want to look at Barcelona stats with La Liga as well as what Pep is doing at Bayern Munich – we’ll get to it), but for now I’m going to leave it here.
Any surprises listed there? Problems you see? Complaints? This is totally new research, so I expect there will be additional fixes/adjustments/hiccups before we get to a final product. If you’re really interested, check out the methodology discussion below.
Thanks,
--TK
@mixedknuts on Twitter
Methodology Info - In Steps Marek
First of all, the sample used at the team level was 4 full seasons from 2009-2013 across Ligue 1, Bundesliga, Serie A, EPL, and La Liga. When I did my initial research on this a few months ago, I was looking at the defensive rate metrics at the team level compared to shots conceded, goals allowed, goal difference, etc.
I was talking about this to my sometimes partner in crime Marek Kwiatkowski, and he suggested using a slightly different approach for the player info than I was initially using. Instead of taking the full difference in possession, Marek’s first new approach (which I called the “simple approach” above) was to attach everything to a base of 50, which is the game by game mean. So a 66.7% possession rate would go from 2:1 to 1.33:1.
I liked this because it delivers numbers more attached to reality, especially for extreme possession numbers. However, at the team level, it lowered the r-squared from shots conceded to .24 from .4. This is more correct than just using tackles and interceptions. It is possibly less correct than the full base team adjustment I was working with initially.
The next step Marek suggested was testing out a sigmoid function, which I had never heard of. Swapping this in pegged the r-squared for both shots conceded and goal difference at .39, meaning we’re explaining about 39% of the variation in both of those outputs with adjustments to two simple defensive rate stats. When I first looked at this I was a bit disappointed, but given how complex football is, I actually think that’s pretty good.
Here’s the equation for those who are interested. The bit at the end is the possession adjustment.
Tackles * 2/(1 + e^(-0.1*(x-50))), x/50 for x in [0,100]
As noted above, the basic adjustment and the sigmoid version produce very similar ranks. It’s just that the sigmoid one gets more extreme in adjustment as you get further away from 50% possession.
All of this assumes that I have also done the basic queries correctly in pulling game by game possession stats for each game the players were involved in. I don’t have that info on a minute-by-minute basis right now, so it’s not game-state adjusted or anything.
It also assumes that adjusting defensive stats by possession to increase correlations makes sense and doesn’t simply fall on its face from a methodology standpoint. The logic behind it makes sense to me, but I’m just some guy who works in gambling, not a Ph. D. in stats or math.
Again, we’re probably imperfect at a number of levels.
But it’s a start.