In an article published last October I took my first look at some defensive metrics. That piece was very much an introductory one as I offered up a few of my initial ideas for consideration. I’m now going to take the opportunity to expand on one of the ideas that I wrote about in that initial article, Passes Allowed Per Defensive Action (PPDA).
In this article, with the use of detailed Opta data, I am going to create a metric that I believe can quantify the extent and aggression of high presses employed by teams, both over a season and in any specific match. I’m going to see if it is possible define the intensity of a press with the use of numbers, more specifically by using some of the events that Opta record.
Why would anyone want to do this?
Well, for pretty much the same reason that we undertake any analytics study. If we can develop an objective scale which measures the intensity of a press then coaches can quickly see at a glance the strength, or otherwise, of the high pressing that their opposition has utilised in recent games. Teams or fans can also assess how much pressure their team exerted on the opposition in deep positions, and who knows, perhaps in time we will be able to assess the effectiveness that individual players have on the ability of their team to press. In essence we can take what is otherwise a subjective description and reduce it to one number so that it allows for comparison, analysis and ranking, if so desired.
Passes Allowed Per Defensive Action (PPDA Metric)
Although I introduced this concept in my October article, I wasn’t able to analyse the defensive pressure by specific areas of the pitch – I simply had to use whole game stats. However, I can now extract the required information from the detailed Opta files and begin to create a meaningful metric. I have no doubt that this will be an iterative process and that modifications and improvements will be made in due course, but we have to start somewhere……
Defensive Actions
The defensive actions that I am using are the following four Opta defined events:
- Tackles
- Interceptions
- Challenges (failed tackles)
- Fouls
For this analysis I am not concerned about whether the opposition made or completed passes. I want to measure the pressure that the defending team puts on the opposition players when they are in possession of the ball; and I think those four stats suffice in this regard. I am developing a descriptive measure, and at this stage whether the press is successful or not is not the aim of this initial step.
The PPDA metric is calculated by dividing the number of passes allowed by the defending team by the total number of defensive actions; both values will be calculated with reference to a specific area of the pitch.
PPDA = Number of Passes made by Attacking Team / Number of Defensive Actions
A smaller PPDA value signifies a greater level of defensive intensity, as in essence, the defence has allowed a smaller ratio of uncontested passes to be made.
Not every pressing team will press all of the time; perhaps they wait for certain pressing triggers, other than just the position of the ball. However, this metric provides an objective measurement as it is calculated with reference to the number of times that it is possible for the defensive team to press, ie on all opposition passes in the specified area of the pitch.
Which area of the Pitch?
The major decision I had to make was in relation to the area of the pitch that I wanted to use to measure the intensity of the pressing. I am conscious that there is probably no right or wrong answer for this, but I tossed it around for a few days and I also asked Rene Maric from the excellent Spielverlagerung tactics focussed site. The short answer is that we both eventually settled on the pitch area that, in Opta parlance, has an x co-ordinate of greater than 40.
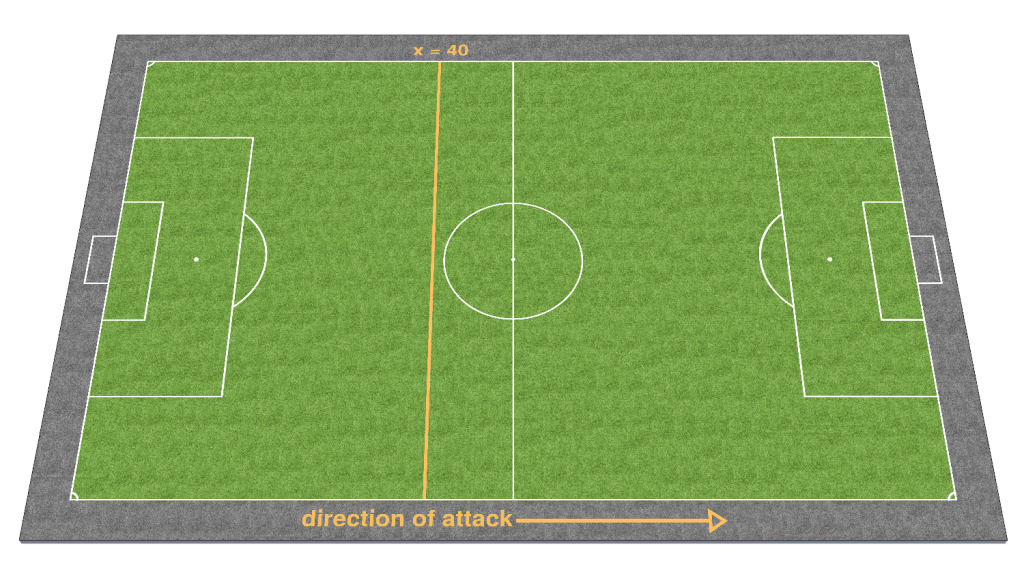
Pitch image created by Valentin
We are looking at the pitch from the perspective of the team playing left to right, ie defending the goal to the left. We are using the Defensive Actions (tackle, interception, challenge or foul) that occur to the right of the line that is denoted by “x = 40”. So this includes all defensive actions in a team’s attacking half as well as a little bit into their own defensive half.
I outline the complete logic that I used to settle on x = 40 as the boundary at the bottom of this piece.
From now on, all PPDA values refer to PPDA Beyond40 (ie the metric only uses defensive actions and oppositon passes that occurred beyond the x=40 line) as that is the boundary I have decided to use to assess the intensity of the high pressing by the defending team.
So what do the PPDA values look like?
Mauricio Pochettino is one of the poster boys for the high press, and this is a great analytical piece on the Argentine manager written by Michael Caley.
The side he managed, Southampton have, over the last two seasons served as a very good example of what the PPDA values can look like.
Note: to smooth out the variations that any metric can show on a game by game basis I have plotted the PPDA values on a 6 game rolling average basis.
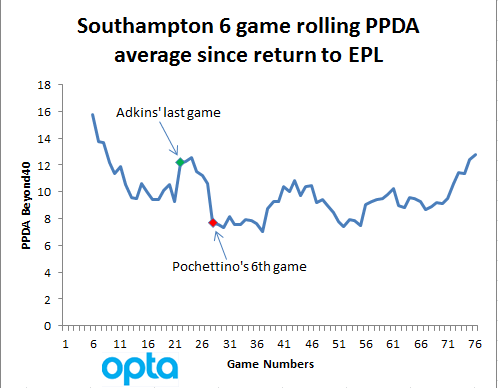
Remember: Lower PPDA value means a high level of pressing
During Nigel Adkins’ spell as Southampton boss the South Coast club had a 6 game rolling average PPDA that ranged from just under 10 to 14. The new PPDA metric easily captures the impact that Pochettino had as soon as he arrived at St Marys. The Saints’ PPDA value fell in an almost straight line fashion during their first six games, with the result that the rolling 6 game value was less than 8 at the end of this six game period. We can see that Southampton maintained this level of pressing right throughout the remainder of the 2012/13 season.
However, this metric suggests that Southampton hasn’t been nearly as intense in terms of pressing over the last half of the 2013/14 season as they had been during the first 12 months of Pocchetino’s reign. Ironically their 6 game rolling PPDA value at the end of the 2013/14 season was higher than when Nigel Adkins departed from Southampton in January 2013. I don’t recall this being widely picked up or reported upon.
In fairness, Southampton had “nothing to play for” in their final 3 or 4 games of the season. Perhaps their drop off in pressing intensity at the end of the season, which is apparent from the above plot, was solely due to that. Regardless of the reason for their drop off in intensity, I assume they will be very disappointed with the PPDA figure of 14.5 that the Saints recorded in their home game against Cardiff towards the end of the season.
This really uncharacteristic performance, unsurprisingly, resulted in a 1-0 away win for the relegated Cardiff side; in fact it was only Cardiff’s second away win of the campaign. Southampton’s lack of aggression in attempting to win back possession may help explain why they lost that game.
Barcelona after Guardiola
Pep Guardialo is another famed exponent of the high defensive press, first at Barcelona and also now at Bayern Munich. He clearly believes in pressing aggressively in offensive areas in an attempt to regain possession very quickly. Unfortunately, for Barcelona, the man that was chosen to succeed Pep, Tito Vilanova, at the end of the 2011/12 season seemed to have a different view of how his team should defend.
The following plot shows Barcelona’s rolling 6 game average Pressing Score (PPDA) over the last 4 seasons, starting with 2010/11):
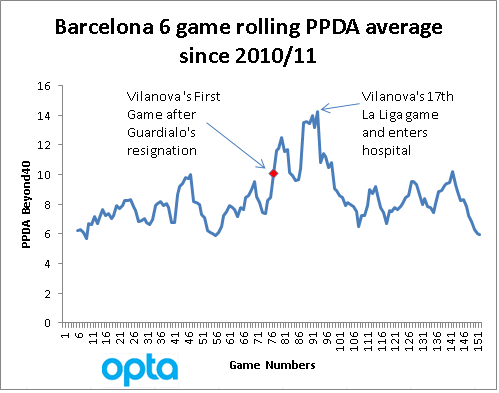
During the two seasons that Pep was in control at the Camp Nou, Barca barely wavered from the range of 6 – 9. However, as soon as Vilanova took the reins we can see that the team’s PPDA value started to rise. In other words, Barcelona attempted fewer defensive actions per pass they allowed beyond the x = 40 line than they had previously done. They had abandoned the way that they played when they weren’t in possession of the ball.
Sadly for Vilanova, we are all aware of what happened next. After 17 games of the 2012 / 13 season he was admitted to hospital where he underwent cancer treatment. Officially, the Barcelona team was under Tito’s management for the entire season, however, it seems pretty clear to me that as soon as Vilanova was admitted to hospital Barcelona began to revert to the game plan that had held them in such good stead under Guardiola.
The rate at which Barcelona reduced their PPDA metric in early 2013 (Game number 91 onwards in the above plot) is nothing short of remarkable. The Catalan giants performed a huge about turn in how they approached the game when they weren’t in possession of the ball. Either Vilanova had a tactical rethink during his period of convalescence or it seems that Jordi Roura was actually in charge of the team’s tactics during this period. Given the stark differences in the PPDA values, I know which of those two options my money is on.
The above Barcelona plot is very useful as it shows the impact that a manager can have on the intensity that a team presses with, regardless of the players at their disposal. And I believe it also provides an answer as to why anyone would wish to measure this at all.
We know that attacking strategies can be measured / defined with reference to stats, is there a reason that we can’t strive to do the same for the defensive side of the game?
Pressing Intensity by League
We have seen in the two examples cited in this piece that whether teams press or not seems to be a decision of the manager or coaching staff. It appears that the right group of players is capable of playing whatever way is asked of them. It follows therefore that the position of the leagues in the next table is attributable to the tactics that are pervasive throughout the respective leagues:
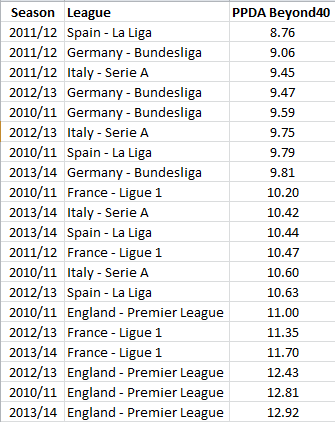
Out of the 20 leagues / seasons that we have the data for, the 2013/14 EPL season has got the highest PPDA value, ie it seen the least amount of pressing. It seems that Mauricio Pochettino is still very much the exception, and not the norm in the Premier League.
We can also see that the three leagues / seasons that witnessed the highest levels of intense pressing were all during the 2011/12 season.
Is this simply some variance associated with small sample sizes or is it a coincidence that this was the last season that Guardialo was in charge of Barcelona and tika taka was all the rage? We can’t be certain either way, but it is interesting that all of the 2013/14 season PPDA values are relatively high – this suggests that pressing as a defensive tactic is not as dominating as it has been in the recent past.
2013/14 Premier League
If we turn our attention to last season’s Premier League, we can see the spread of PPDA values across the twenty teams. It’s no surprise to see that Southampton were the team that recorded the strongest pressing value in England’s top flight last season, however the values posted by teams on the far right side of the chart below suggest almost a total lack of pressuring the opposition in deep positions.
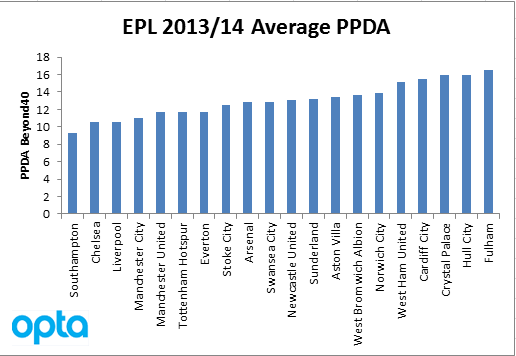
Those teams on the right of the chart seemed to be content with basically conceding possession in the opposition half and presumably funnelling men back behind the ball to defend much closer to their own goal.
In fact, of the six teams that recorded the highest PPDA values (and thus the weakest press) in the Big 5 leagues last season, five of them played in the Premier League. Lorient in France’s Ligue 1 makes up the passive half dozen.
For all the influence of foreign coaches and exposure to continental tactics it is pretty clear that there are a large number of Premier League managers and coaches that are still very partial to the traditional method of English defending – getting men behind the ball.
More than One Way to Defend
This article concentrated on creating a method to define and measure the intensity that teams employed when attemping to win the ball back in high up-field areas. I am very aware that the use of the high press is not the only way to defend, and over the coming weeks I’ll have a look to see if it is possible to measure and define other defensive systems being used by coaches and managers. In the meantime, fire away with any suggestions or other ideas you might have for how we can create some more defensive metrics.
Appendix: Logic for settling on x = 40 as boundary for pressing
I ultimately decided on x =40 as the boundary for this pressing metric as I wasn’t comfortable with using just the actions that took place inside the opposition half (x=50). A team may be happy to concede possession in the opposition half but tenaciously apply pressure on the ball when they cross the half way line. The use of x = 40 ensures that such a team will receive credit for the pressure they apply as soon as the ball enters into their own half.
I didn’t want to go closer to the defending team’s goal than x = 40 because x =33 is right back into the defensive third of the pitch. We would expect all teams to make tackles and challenges in that area of the pitch as part, and so it seemed wrong to count those defensive actions in any potential metric that is intended to be used for identifying how defences press.
As a final check on which of the boundaries to use (x =33, 40 or 50) I actually collated and analysed the data for all three potential boundaries. Obviously some teams will differ in the intensity of their pressing depending on which of our potential cut offs we use, however, it was encouraging to see that there was actually quite a high degree of correlation between all the potential cut off values.
Correlation (r^2) values between boundaries on an individual match by match basis:
x= 33 with x= 40: r^2 = 0.84
x= 40 with x=50: R^2 = 0.81
The pressing metric value (PPDA) at x= 40 explains more than 90% of the PPDA at each of the other potential boundaries. So as well as making practical football sense to use x=40 as the boundary for this metric it is clearly a good approximation of how teams press regardless of the exact cut off value that is used.
