Assessing the skills of goalkeepers is exceptionally difficult, and it’s why I have never attempted to do it. As well as the basic and fundamental skill of shot stopping, the best goalkeepers will be able to effectively assess situations and decide whether to advance or stay on their line. How they deal with a high ball is also important, as is their distribution and their communication and organisational skills. Combine those altogether and you have a range of skills that would be very difficult to measure using conventional statistics.
Although I don’t think we are in the position of being able to rate goalkeepers in terms of their entire skillset we are in the position of being able to assess their shot stopping attributes. I’ve been told that the best way to eat an elephant is “one bit at a time”, and so we’ll take the same approach to rating goalkeepers. Let’s start the process by having a look at goalkeepers’ shot stopping numbers. The dataset that I’ll use for this analysis is Opta data for the four complete seasons from 2010/11 to 2013/14 covering the Big 5 leagues (EPL, La Liga, Serie A, Bundesliga and Ligue 1). This gives me a dataset of more than 64,000 on Target shots which were faced by 393 goalkeepers.
Goalkeepers with Best Save Percentage
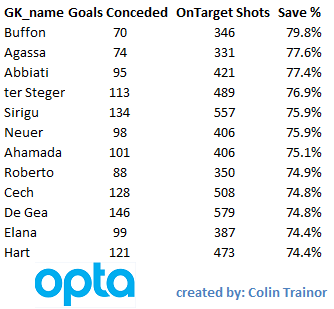
To get our bearings we’ll take an initial glance at the Top 12 goalkeepers from the last four seasons as ranked by Save Percentage (Saved Shots / Total OnTarget shots faced) and I’ve applied a cut-off of a minimum of 300 shots.
This list seems to make some sense; we have Buffon topping it and it includes other accomplished net minders such as Abbiati, Sirigu, Neuer, Cech, De Gea and Hart. With the possible exception of Victor Valdes, it’s fair to say that this list of Top 12 Shot stoppers (ranked by Save %) includes most of the names that would quickly spring to mind. The football world will be glad to hear that, even when looking solely at numbers, some goalkeepers appear to be better than others. OK, so that isn’t exactly ground breaking; but it’s a starting point. At this point it’s also worth considering whether, just because the best shot stoppers have the highest save percentage, it means that the keepers with the highest save percentage are necessarily the best shot stoppers.
Repeatability
In terms of assessing the shot stopping skills of goalkeepers, the question about whether we can tell the great stoppers apart from the average ones is not the most important question for me. What is important is the timescale, or quantity of On Target shots, that we need to observe before we are in a position to be able to soundly judge shot stopping skills.
Why is this important?
If it takes a very long period of time before we can be confident that a goalkeeper’s save numbers are repeatable then that has to have implications for football teams. How do teams scout for a goalkeeper?
How can they possibly tell whether the saves a potential new signing made in the handful of games he was watched is likely to be repeatable going forward?
How do they know when to drop a goalkeeper due to a few bad performances?
For me, it’s apparent that we need to be able to assess how repeatable shot stopping performances are for a goalkeeper from one period of time to another. To do otherwise means that any decisions or judgements that are based on the outcomes achieved during the first period of time may be built on shaky foundations. This viewpoint seems to be shared by Billy Beane, as in an interview last week with Sean Ingle he was quoted as saying:
“You don’t have a lot of time to be right in football. So ultimately, before you mark on anything quantitative, you have to make sure you have scrutinised the data and have certainty with what you are doing, because the risk is very high.”
How to Measure Shot Stopping ability
For this analysis I am going to use two forms of measurement for assessing the quality of shot stopping performances. The first measure is the simple Save %, and this was the metric that the first table in this article was ranked by.
The second measure is based on our (created with Constantinos Chappas) Expected Goals model, or specifically our ExpG2 component of the model. This ExpG2 value is the expected value of the shot AFTER it has been struck. This means it takes into account all of the factors that existed at the point the shot was struck (ie location, shot and movement type etc) but it also includes the shot placement, but doesn't include the location of the GK at the time of the shot.
As expected, the shot placement is a huge driver of the ExpG2 value. A shot arrowed for the top corner will have a much higher ExpG2 value than a shot which was taken from the same location, but which was placed centrally in the goal. ExpG2 can be used to measure the placement skill of the shooter, but it also has great use in measuring the shot stopping performance of goalkeepers.
It is only right that a ball that hits the net in the very top corner reflects less badly on the keeper than one which squirms through his body in the middle of the goal; the ExpG2 metric achieves this. This analysis will use ExpG2 Ratio, which is calculated as: ExpG2 / Actual Goals Conceded An example: 12.34 ExpG2, but the GK conceded 14 goals. The ExpG2 ratio in this case is 0.88. A value of 1.00 means that saves have been in line with expectation, a value greater than 1 suggests the keeper has performed better than the average keeper would have done for the shots he faced, and a value of less than 1 means he allowed more goals than the average keeper would have done.
Repeatability (yes, that word again)
The key point in this analysis is not to measure the shot stopping performance of any goalkeeper, but to instead look at how repeatable the shot stopping performances are from one period to another. After all if they aren’t repeatable, be that due to variance, luck or something else we aren’t currently measuring, decisions and actions taken by teams shouldn’t be the same as those that they would take if they were known to be repeatable.
Isn’t that right football industry?
In March this year, Sander Ijtsma published a piece where he suggested that you could practically ignore save percentages. I wanted to expand on that concept a little.
Method of Analysis
I sorted all the On Target shots by date and sequentially numbered each shot faced by each goalkeeper. I created a variable, n. This allowed me to divide the shots faced by each keeper into sets of n size. I then calculated a single correlation value for each level of n by plotting all the individual save performances achieved in Set 1 (which will be of size n) on the x asis against the individual save performances achieved in Set 2 (which will be of size n) on the y axis.
It would probably help to use an example; let’s say n = 50. For each GK I measured the save performance for their shots numbered 1 – 50, 51 – 100, 101 – 150, 151 – 200 etc. I then plotted the relationshion between shots 1 – 50 and 51 - 100. I did this as I wanted to see how repeatable the save performances were for goalkeepers from one set to the next. I also plotted the relationships between shots 51 – 100 and 101 – 150, as well as between 101 – 150 and 151 – 200 etc. I continued on using this logic to plot the relationship values for each consecutive set for each goalkeeper until I couldn’t compare any more sets of n on target shots for them.
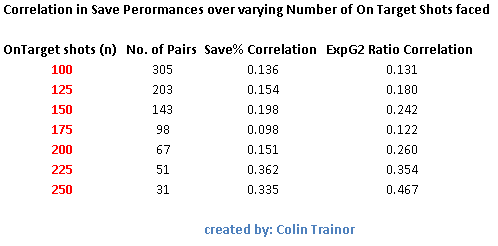
A single correlation value was then calculated for each level of n. I made n a variable so it could be changed to assess the level of correlation (repeatability) between consecutive sets of On Target shots faced by goalkeepers based on the number of shots in each sample. The table below sets out the extent of the correlations for varying sizes of n.
The values in the two columns on the right of the table show the correlation for the save performance of a goalkeeper over two consecutive sets of facing n On Target shots. The third column shows the correlation for the simple Save % metric, while the final column shows the correlation for the ExpG2 Ratio measurement.
A brief reminder that a value of 1 means the save performance of the two consecutive sets are perfectly positively correlated, while a value of 0 indicates that no correlation exists whatsoever. I don’t want to make this piece any more technical than it already is but I’ll simply state that the correlation coefficients themselves have confidence intervals around them, these are primarily driven by the number of pairs for each level of n.
Let’s walk through one of the lines in the above table, we’ll use n = 100. There were 305 instances (pairs) in my data set where goalkeepers faced 100 on target shots followed by another 100 on target shots. The correlation in their save performance when measured by the simple save ratio between the first and second sets of 100 shots was just 0.127. When we instead measure the keepers’ save performances by the ExpG2 metric the correlation increases to 0.232. A correlation of 0.232 is a weak correlation as it means that just 5% (0.232^2) of the variability in the second set of 100 on target shots is explained by the first set of 100 on target shots. That is startling.
Even when we use the advanced ExpG2 metric to assess how well a goalkeeper performed over a series of 100 on target shots we can still only expect it to explain just 5% of their performance over the next 100 on target shots he faces.
As an average goalkeeper faces approximately 4 on target shots per game this means we need to assess a keeper over about 25 games to only get a 5% steer towards how he will perform over the next 25 games. Pause and think of the implications of that. Even a sample size of 250 shots (n = 250) has a correlation, using the more detailed ExpG2 metric, of just 0.405, this level of correlation is generally described as a moderate correlation as it gives an r2 (variance) value of just 0.16.
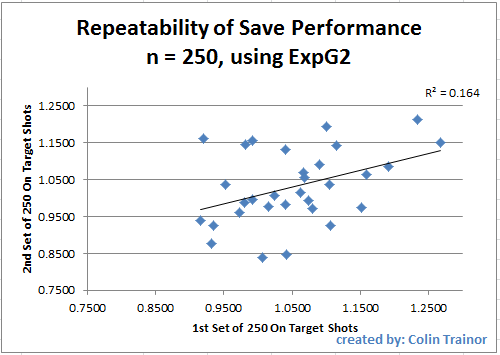
At this point I cannot calculate correlations for n greater than 250 as I do not have enough data in my dataset. To give you an idea of the amount of dispersion of save numbers from one set to the next I have produced below the plot for the 31 consecutive sets of 250 shots (which means the goalkeeper has had to face at least 500 on target shots):
Does the shot order matter?
Daniel Altman read a draft of this piece and he suggested I should look at whether I am introducing some bias into the correlations due to the way that I populate the two groups of n shots. You will recall that I carried out the above analysis by splitting the shots into groups based on the sequential order the keeper faced those shots, and doing this inevitably builds a time and age factor into the makeup of the groups.
This is fine as I initially only wanted to measure sequential relibality (as this is what happens in the real world when it comes to assessing a goalkeeper's performances at a certain point in time), but this may cause difficulties if we attempt to measure innate talent. To address Altman's prescient point I randomised the order of the shots and conducted the same analysis as before. The correlation values between consecutive sets of n shots (with the shot groupings decided on a random basis) are as follows:
As expected, because we chose a different basis on which to create our sets of n, there are some differences between the correlation values in this table and the one that appeared earlier in this article. However, at n = 250 the correlation value of 0.467 still means that we would only expect 22% of variability in the second set of 250 on target shots to be explained by the first set of 250. This is still quite a low value and suggests that even when we strip away any impact of age / time bias there doesn't seem to be a great level of repeatability in terms of goalkeeper save performances.
Conclusion
Of course there are goalkeepers that save shots better than others. But for every goalkeeper such as David de Gea that have consistently over performed (1.23 and 1.21 is the ExpG2 Ratio for his two sets of 250 shots) we have a Stephane Ruffier who notched up ExpG2 ratios of 1.15 and 0.98 in his two sets of 250 shots.
If those two players had been assessed after their first batch of 250 on target shots (which would have taken almost two full seasons to amass) they would both have been assumed to be well above average shot stoppers. However, only one of them went on to repeat it again after they faced another batch of 250 on target shots. Imagine the analyst that recommended signing Ruffier on the strength of his save performances using an advanced metric over a “large” dataset of 250 shots or 60 games. This is a good time to recall Billy Beane's assertion that we need to make very sure that we know what we are doing with our data as the stakes will be high for any club that truly embraces the use of data in their decision making process.
When this level of variance exists after 250 shots, it is easy to see how Simon Mignolet went from being one of the best shot stoppers in the EPL in the 2012/13 season (ExpG2 ratio of 1.25) to being one of the worst in 2013/14 (ExpG2 ratio of 0.88). Very simply, trying to judge how good a goalkeeper is at saving shots based on one season’s worth of data is little more than a craps shoot such is the divergence on performance over 150 shots. Just 11% of his performance next season can be explained by his performance in the season just passed.
It looks to me that the very fact a player is good enough to be a goalkeeper for a top tier club means that he has achieved a level of performance that is difficult for even advanced numbers to distinguish, at least not until he has faced a very large number of shots. I’m just not sure yet how large that number needs to be. Remind me never to advise a club when they are looking at buying a goalkeeper as the shot stopping facet of the goalkeeper’s skillset was supposed to be one of the easier ones to measure and interpret.
Thanks to Constantinos Chappas and Daniel Altman for allowing me to bounce off them some of the more stat heavy angles of this piece. Cover picture by Steve Bardens.


