If you pay attention to our social media, you know that we recently released the new goalkeeper(GK) module on our analytics platform StatsBomb IQ. This past weekend, phase 2 of the module went live, and included in that release were an awful lot of things, not least of which were the long-awaited GK radars.
Today I'm going to discuss what we've done with the GK metrics, why they differ from what you might see elsewhere, and why this is something people in football really need to care about. (Note: For those of you who want to know more about the framework we have chosen to analyse GKs, please check out my intro piece here.)
StatsBomb Data is Different
I have been working with player data in football since 2013, but I never bothered to do much work with GK data. It's not that I didn't think GKs were important - obviously they are. The problem was that I felt the data we had access to didn't add much insight into the job GKs actually do. Primary jobs for GKs consist of:
- Stopping shots
- Claiming crosses and high balls
- Distribution
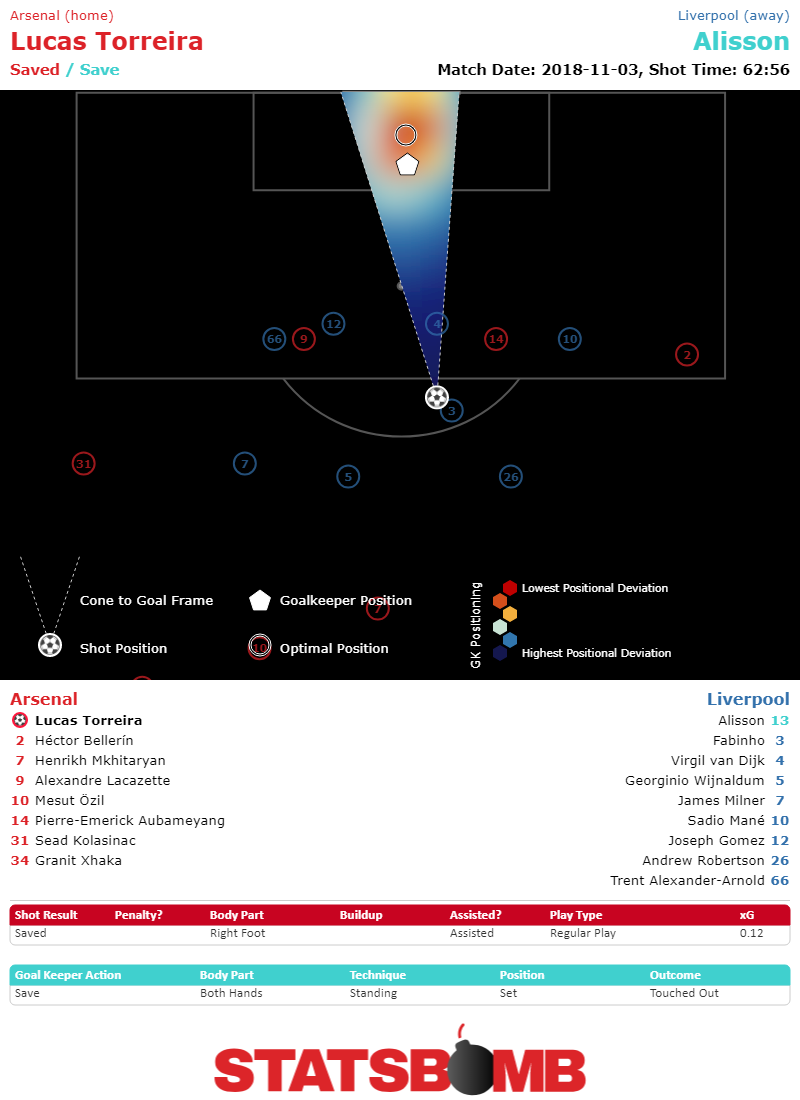
When I was designing the data spec for our new data, I went around to most of the smart people I know in football and asked them how we could improve football data without widespread tracking data. We ended up with a long list of upgrades to what our competitors offer, but probably the most important element across everyone's list was the position of the GK on every shot. And the reason for this was that a big part of the GK's job is simply being in the right place to have the best chance of saving any particular shot.
Think of what you often hear in commentary when David de Gea is playing.
"It's not really a save, the ball just hit him and bounced off."
"Another shot right at him."
"Great reflex save from de Gea, but again the ball was right at him."
Being in the right position to make saves for a keeper is a huge skill, but you can't measure that if you don't have the data.
So we collected it, along with the position of all the defenders in the frame when a shot is taken, and we call them Freeze Frames.

(Credit for all the data science heavy lifting in the GK Module goes to Derrick Yam, who did great work on this on.)
Once we had enough shots, we were then able to investigate where GKs generally should be positioned on shots from any particular location in order to make a save and put that information into a model. We then use that model to evaluate each GK on each shot and produce two shot stopping metrics.
GSAA% - Goals Saved Above Average Percentage: How the Goalkeeper performed versus expectation. Calculated as: (PSxG - Goals)/Shots Faced
Positioning Error - How far from the optimal position for facing a shot the Goalkeeper is (on average).
The next two metrics we produced focus on GK activity around the box.
CCAA% tries to answer how active are GKs at gathering claimables - high balls and crosses into the box that could be claimed.
The claimables model first defines the likelihood of a pass from and to a particular location being claimed and then evaluates GKs based on their activity. (This is made easier because StatsBomb Data also includes pass height as you wouldn't generally expect GKs to claim ground passes.) Busy GKs that come off their line to claim lower xCL balls are graded higher than those who are consistently rooted to the goal line. The reason is because claims have some level of value in cutting out opposition chances, and GKs can be rewarded and penalised based on this activity.
(Note: There are a lot of additional technical details behind the scenes here that are only available to StatsBomb IQ customers right now.)
For GK Aggressive Distance we wanted to look at how active are GKs generally at moving off of their goal line to do football things? We investigate the distribution of the distance from goal for goalkeeper actions that are not passes, saves or claims. This includes clearances, interceptions, tackles and ball recoveries. This shows the presence a goalkeeper has further up the pitch and measures their defensive contribution in a manner more common to field players.
Finally, you get to the distribution metrics. Admittedly, these are as more stylistic profiles as opposed to telling you whether a player is strictly good or bad at a skill set, but we chose these because we liked the insight they deliver in this area. In real world analysis, we produce something like twenty different distribution metrics in this area to dig deeper.
Pass into Danger% - Percentage of Passes made where the recipient was under pressure or otherwise in Danger.
Positive Outcome Contribution - How frequently is the player involved in sequences that soon resolve with a Postiive Outcome.
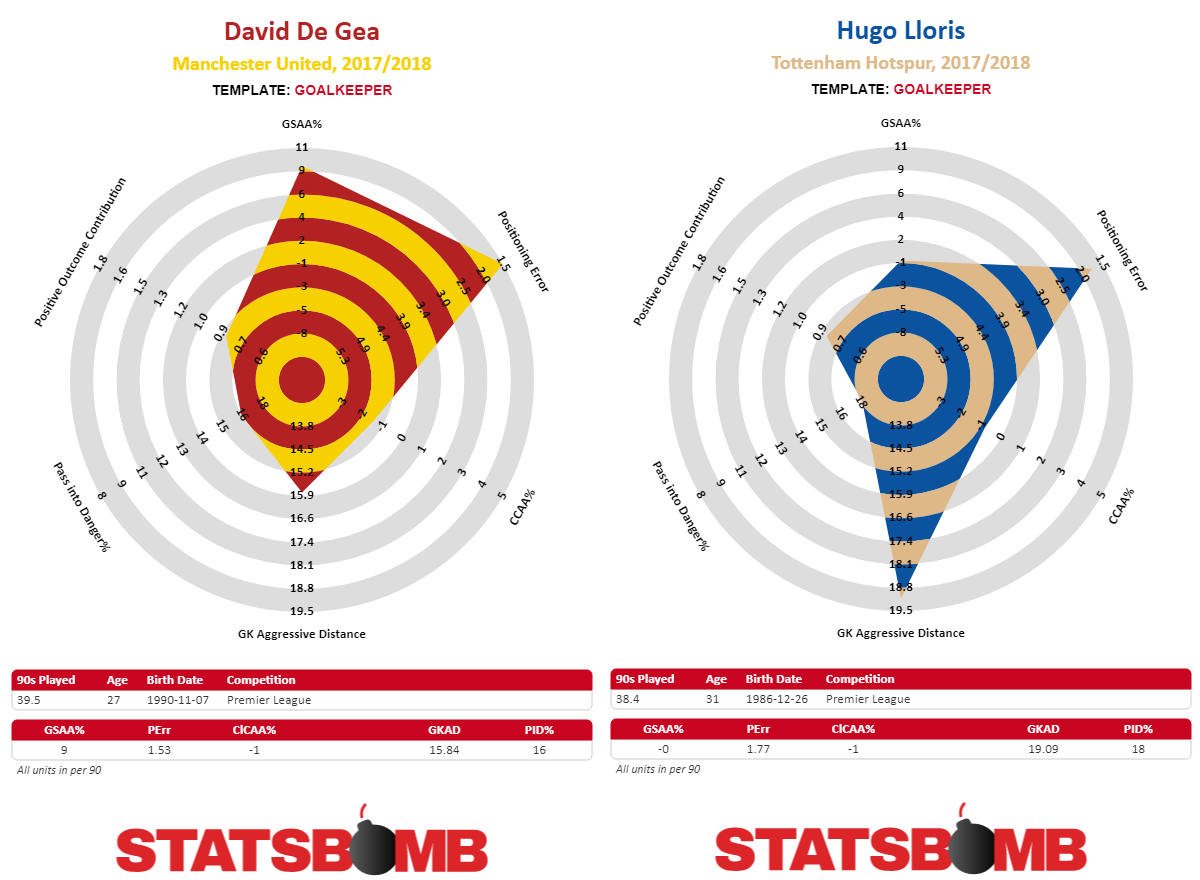
Combine all of those into a visual plot with the outside ring as a top 5% cutoff and the inside ring as a bottom 5% cutoff and you get this:

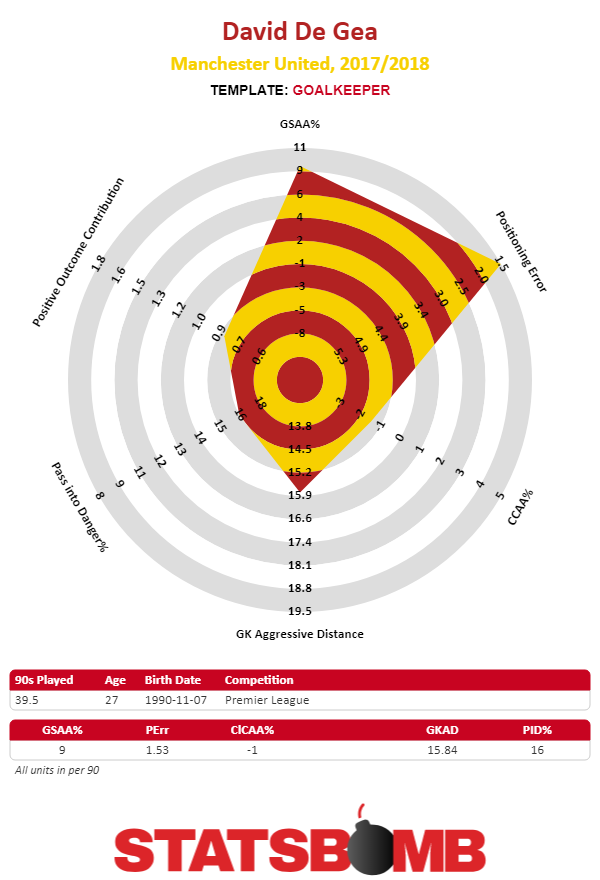
If you have watched these GKs quite a bit over the years, these really do feel "right" in terms of profiling their skill sets. De Gea is great at stopping shots, but doesn't do that much with regard to coming off his line. Lloris is a solid shot stopper who remains very busy around his own penalty area.
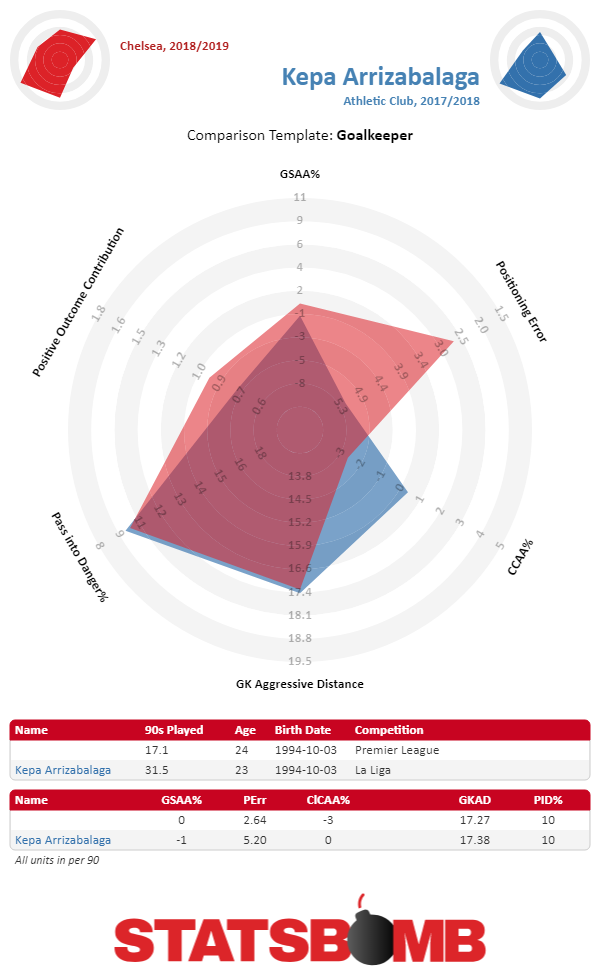
What about Chelsea's Kepa, who Derrick analysed early in the season as being largely average in most of our metrics?

And with our data, we now have detailed GK metrics for every league we collect, from the Premier League right down to League Two. Or MLS. Or Poland. Or your academy...
Goalkeeping is Unsolved
I hinted at this a little in my Barcelona presentation, but from talking to teams around the world, I get the impression very few understand goalkeeping from an analytic and training standpoint, and almost no one is closing the loop with regard to data driven coaching. I've been working with football data for nearly six years now, and it took us until now one to build a framework we liked to evaluate GKs analytically. Because of this, there are just so many things we don't know.
- How do GKs age? What does the age curve look like?
- Does shot stopping ability - which appears largely stable - increase, plateau, and decrease at certain times?
- Are shot stopping and positional error negatively correlated to claim activity and defensive aggression?
- How do GK skills transfer from lower quality leagues to higher ones?
- How do they transfer across top leagues?
- Our model thinks David de Gea saved Manchester United thirteen goals more than an average GK would have last season. Is that type of elite performance sustainable?
And that barely scratches the surface. Not knowing things in sport is dangerous. It throws a random factor into every decision you make that could be tremendously costly down the line. But ignorance becomes way more dangerous when it shifts from "no one really knows these things" to "we're the only ones who don't know these things." If your opponents have better info, and you are the only sucker left on the block...
We designed StatsBomb Data to allow coaches and analysts to ask questions they never could before. And with StatsBomb IQ, we deliver powerful, easily understandable insights to answer those questions.
We're not just here to stop teams from making mistakes, though data is super useful for that. We are here to deliver info that makes teams better in every area of the game. Recruitment, self-analysis, opposition scouting...
And now goalkeeping.
--Ted Knutson
ted@statsbomb.com
@mixedknuts
PostScript
For good or for ill, next month is the five-year anniversary of the first player radars I ever created. For those who want a design history and defense of the visualisation format, relevant links are below.
The first terrible introduction article.
Understanding Radars for Mugs and Muggles
Defending Radars CASSIS Presentation - RADAR WARS. (Also an excuse to poke fun at Luke Bornn and Daryl Morey)
