
One of the goals of sport analytics is to convey rich information about a player or team in a single number or statistic. In football one of the main areas of interest is how much a player contributes to scoring goals, something which can be difficult to quantify given the rarity and stochastic nature of goals. I decided to look into developing a single statistic that can be used to compare relative contributions to chance or goal creation. Taking a cue from sabermetrics and baseball analytics, I’ve developed a series of comparative statistics for attacking contributions in soccer called “Chances Created”.
Baseball Model
One of the most influential statistics developed by Bill James, the father of sabermetrics, is called “Runs Created” (RC). RC was a response to baseball’s obsession with the RBI or run-batted-in which is very context and team specific often giving a skewed view of how much a player actually contributes to his team’s offence. RC in its most basic form looks at a players contribution by multiplying the player’s on-base-percentage by their total bases. The simplest test for RC was to see if a team’s RC total roughly added up to their total runs scored and the results were encouraging with a margin of error of approximately 5%.
Since the inception of RC there have been two major advancements. The first which was given the name “Runs Created Plus” (RC+) normalizes the average player’s value to 100, so a RC+ of 115 means that the player contributes 15% more runs than the average player. The second major change was weighting the statistic for several other quantifiable factors, hence “Weighted Runs Created Plus” (wRC+).
In developing a Chances Created statistic I took this approach so there are three separate statistics: Chances Created (CC), Chances Created Plus (CC+), and Weighted Chances Created Plus (wCC+). The goal of a statistic like this is the same as in baseball, find a metric that gives a better indication of a players contribution to the attack than just goals and assists which are clouded by lots of noise.
Chances Created
A chance in football corresponds to a shot, whether on target or not. There are two actions which directly create a chance, a shot and a pass that leads directly to a shot (a key pass). So at its core CC is just an accumulation of shots and key passes, but adjusted for playing time to shots and key passes per 90 minutes.
![]()
The next step is to create a statistic that is normalized so that the average is 100. The problem with this is determining what the average player is in terms of chance creation. In baseball, every player has the same opportunity to bat whereas in soccer different players in different positions are expected to contribute different outputs offensively. So instead of normalizing for a non-existent, completely average player I divided players into four positions: goalkeeper, defender, midfielder and forward. Obviously there are a lot of debates about what these positions actually mean and there are players that play in different positions throughout the season. In order to keep as much objectivity as possible I’ve just used the players' positions that they are assigned by the Premier League’s official fantasy league. Not a perfect solution, but as good a benchmark as I could think of.
In creating the average player I also think it is important to only include players who played a significant role in the season, not those who only play bit-part roles. Thus I’ve only included players who have played at least half of their teams games in the season (which in the Premier League is 19).
Finally, I wanted to weight the chances created statistic to account for shot quality. We know that not all shots and not all chances are created equally, so the chances created statistic should also reflect the quality of these chances created. I decide to weight the statistic by assist rate and scoring rate which are essentially the percentage of key passes that lead to goals and the percentage of shots that lead to goals. Since I’m using an entire season’s worth of data the sample size is large enough that these percentages should align relatively closely with the percentages if I had used expected goals, or in other words the sample size should be large enough to drown out any significant noise that exists in the weights. For example if a player takes a lot of shots from poor positions their CC+ will be high, but their scoring rate will be low so their wCC+ will be lower accordingly.

Testing the Statistic
I think there are three key features that a statistic should have in order to be relevant and useful, it should have some explanatory capability, it should be repeatable and it should be simple to understand.
Explanatory: If the teams that have players with the highest CC, CC+ and wCC+ don’t create the highest number of goals then the statistic is useless since it is not connected to anything tangible that teams are trying to accomplish.
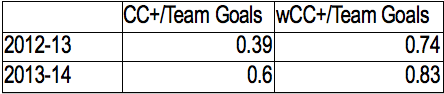
There are high r^2 values between the number of goals a team scores in a year and the average of their players’ CC+ and wCC+. The table below summarizes the r^2 values in the 2012-13 and 2013-14 Premier League seasons between the statistics and team goals scored. As the tables show wCC+ has more explanatory power than CC+ as we would expect.
Interestingly if we look at defenders, midfielders and forwards on each team individually as well as the total average and run a regression on the total number of goals the team scored the individual position specific values are not statistically significant, so everything is captured by the total team average. In simpler terms, if a team’s forwards have a higher wCC+ than their midfielders it doesn’t mean they will score more goals, it is the team average of all positions that matter.
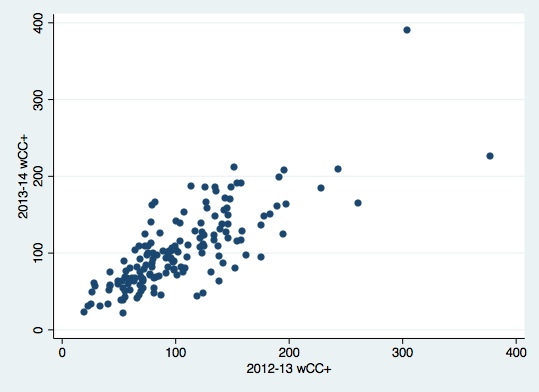
Repeatability: The statistic must have some predictive value. Therefore there must be some trend in the statistic from season to season so that a player’s CC, CC+ or wCC+ has some predictive power for their output in the following season.
Looking at the 2012-13 and 2013-14 Premier League season the r^2 value between wCC+ from one season to the next is 0.78. The scatter plot below shows the tight season to season trend in wCC+.
Simplicity: CC+ and wCC+ are designed to be as simple as possible in compare players. The benchmark of 100 for the average player at each position makes it instantly clear whether a player is above or below average in terms of offensive contribution. This is a statistic that is easy to read and even without the background on the methodology is easy to understand conceptually.
wCC+ Premier League Leaderboards
2012-13 Premier League Defenders
2012-13 Premier League Midfielders
2012-13 Premier League Forwards
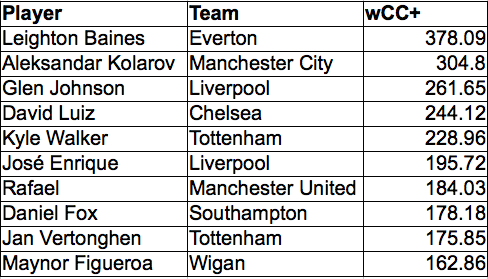
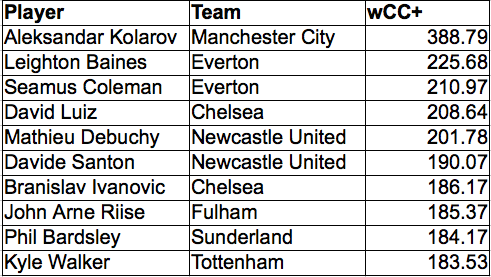
2013-14 Premier League Defenders
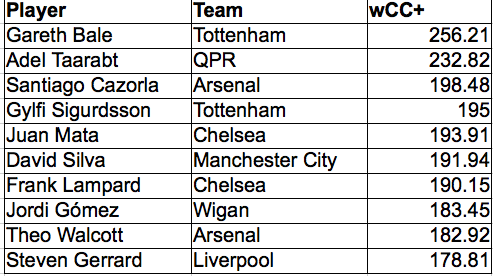
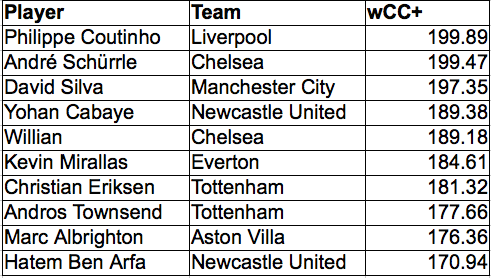
2013-14 Premier League Midfielders
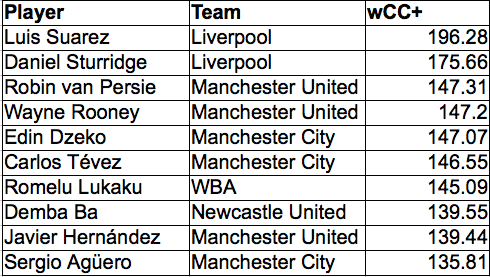
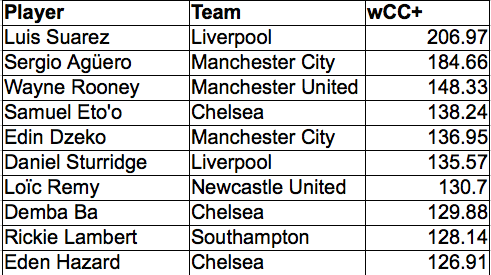
2013-14 Premier League Forwards
Some of the outliers like Kolarov and Schürrle come down to their classification as a defender and midfielder respectively when in reality they often play in more attacking positions. However, the lists in general seem to provide leaderboards that pass the “eye-test” when it comes to chance creation in the Premier League.
These leaderboards also demonstrate one of the limitations of the statistic. It can only really be used to compare players in the same position. As expected there is a much greater range for defenders than midfielders and forwards, because the denominator becomes steadily higher as we move further up the pitch. This also reflects common sense, there is a bigger range among defenders’ chance creation, who all have different roles in terms of attacking intent, than there is amongst those of forwards whose primary goal is to create chances. For example Kolarov doesn’t create more chances than Suarez despite having a higher wCC+, he just creates more relative to the average defender than Suarez does relative to the average forward.
That being said these leaderboards show how much better Luis Suarez has been than every other forward in the Premier League over the last two years. It is also nice to see this statistic reflect how vital Coutinho was to Liverpool’s 2013-14 season. The other stand out to me was Wayne Rooney’s consistency and impressive numbers over the past two years with wCC+ of 147 and 148. These production numbers fall in line with some of the other work on Statsbomb looking at Wayne Rooney’s career.
Overall I’m pretty pleased with the picture these wCC+ leaderboards give of chance creation over the last two seasons.
Next Steps
I’ve only used the data that I’ve complied to date which is 2012-13 and 2013-14 Premier League data. In order to really understand how widely applicable CC+ and wCC+ is we need to see how it works when applied to other leagues around the world.
The other area where changes could be made is in how the weights are applied. Assist rate and scoring rate are simplistic measures compared to potentially more indicative metrics like expected goals per key pass and expected goals per shot which would require a much richer data set. In the future these weights might give a statistic that better isolates an individual player’s contribution.
This is the first time I’ve ever tried something like this before so I’m open to critiques, suggestions and other tests people think would be applicable to further examine CC+ and wCC+.