With the increasing emphasis on the passing game over recent years, defenses have needed to respond in terms of their coverages and the pre-and-post snap looks they give the offense. Two-high vs single-high safety concepts are a topic du jour when it comes to analyzing defense in the modern game, particularly with regards to limiting explosive passing plays.
The release of our latest tracking dataset for the 2020 season means we can walk through some methods and analysis of the defensive side of the ball. Specifically, we'll examine how the secondary drops into coverage and how safeties line-up pre-and-post snap.
You can even play along at home and perform your own analysis using a Python notebook available here. N.B. The notebook loads in a subset of the games due to memory constraints, whereas the analysis below is on the full dataset of *checks notes* 57 games of free tracking data.
Automatic defensive level detection
Our goal in the following analysis is to dynamically detect where the defense is located on each level and how many players are on each line. If we assume a three-level defense, that would encompass the linemen on the first level, the second level positioned underneath and the third level located deeper in coverage.
We're going to employ a fairly simple method that clusters a frame based on the x-coordinate of each player. In the example below, we'll use k-means clustering with a fixed number of clusters of three (to represent our 3-level defense).
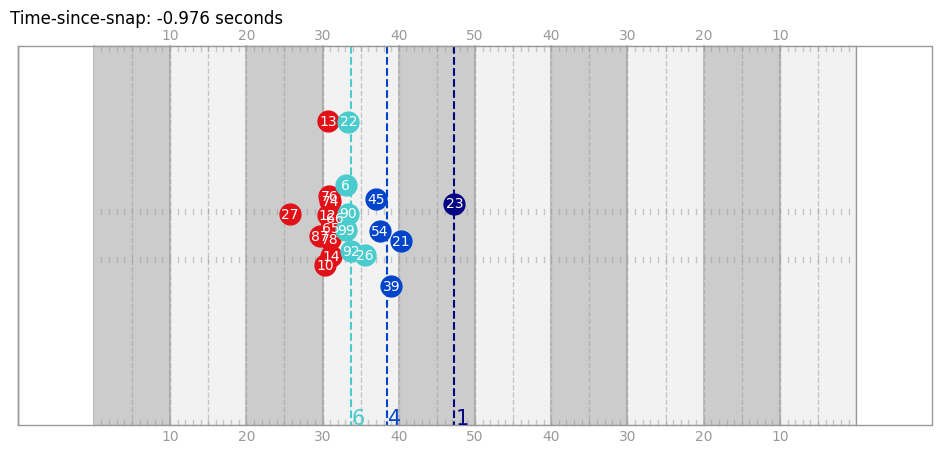
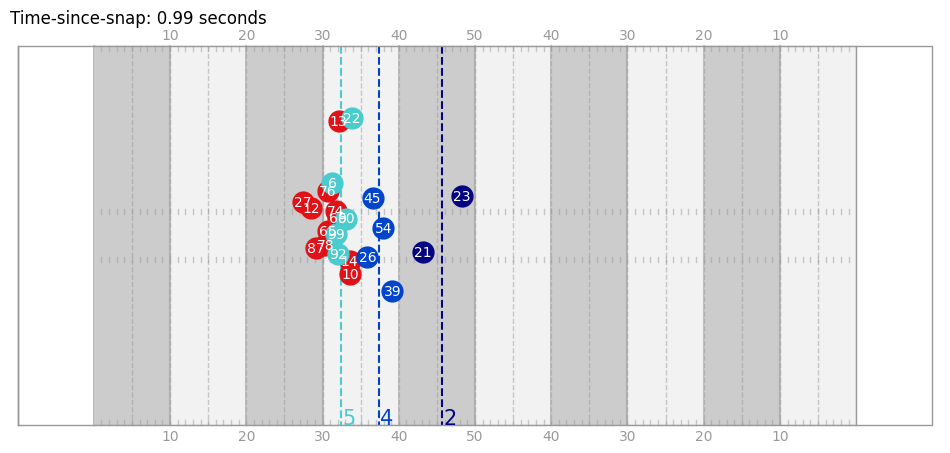
The plots below demonstrate the outputs 1-second prior to the snap and 1-second after i.e. pre-snap and post-snap. The offense is colored in red, with the defense in various shades of blue to denote each level. The dashed lines are the mean x-coordinate of each level, with the number at the bottom indicating how many players are assigned to each level.
Examining the frame one-second pre-snap, on the first-level we have 6 players with 4 linemen on the ball, with #26 set slightly back and #22 in press-coverage on #13. On the third-level we have a single deep safety (#23).
Contrasting that with the frame one-second post-snap, #26 firmly dropped back into the second-level having originally lined-up just off the line-of-scrimmage. We can see that #21 has dropped back to the third-level to form a two-safety look post-snap.
OK, so static plots of a single frame are fine, but what would a tracking data exploration be without an animation of moving dots?
The dots, they move!
We can see the initial pass rush by the linemen, with the second and third levels dropping back into coverage as the play evolves.
TB12 analysis
With three seasons of tracking data available, we can expand our analysis from the single play above to profile how prevalent certain alignments are and how they changed over time.
The table below shows how Tampa Bay’s opponents (on passing plays with TB12 in at QB) have aligned themselves on the 3rd level by season. The alignment notation here indicates the number of players on the 3rd level pre- and post-snap e.g. 1-2 indicates 1 player lined up deep pre-snap and 2 players lined up deep post-snap, like in the play example above. Alignments with more than 3% of plays in that category are shown.
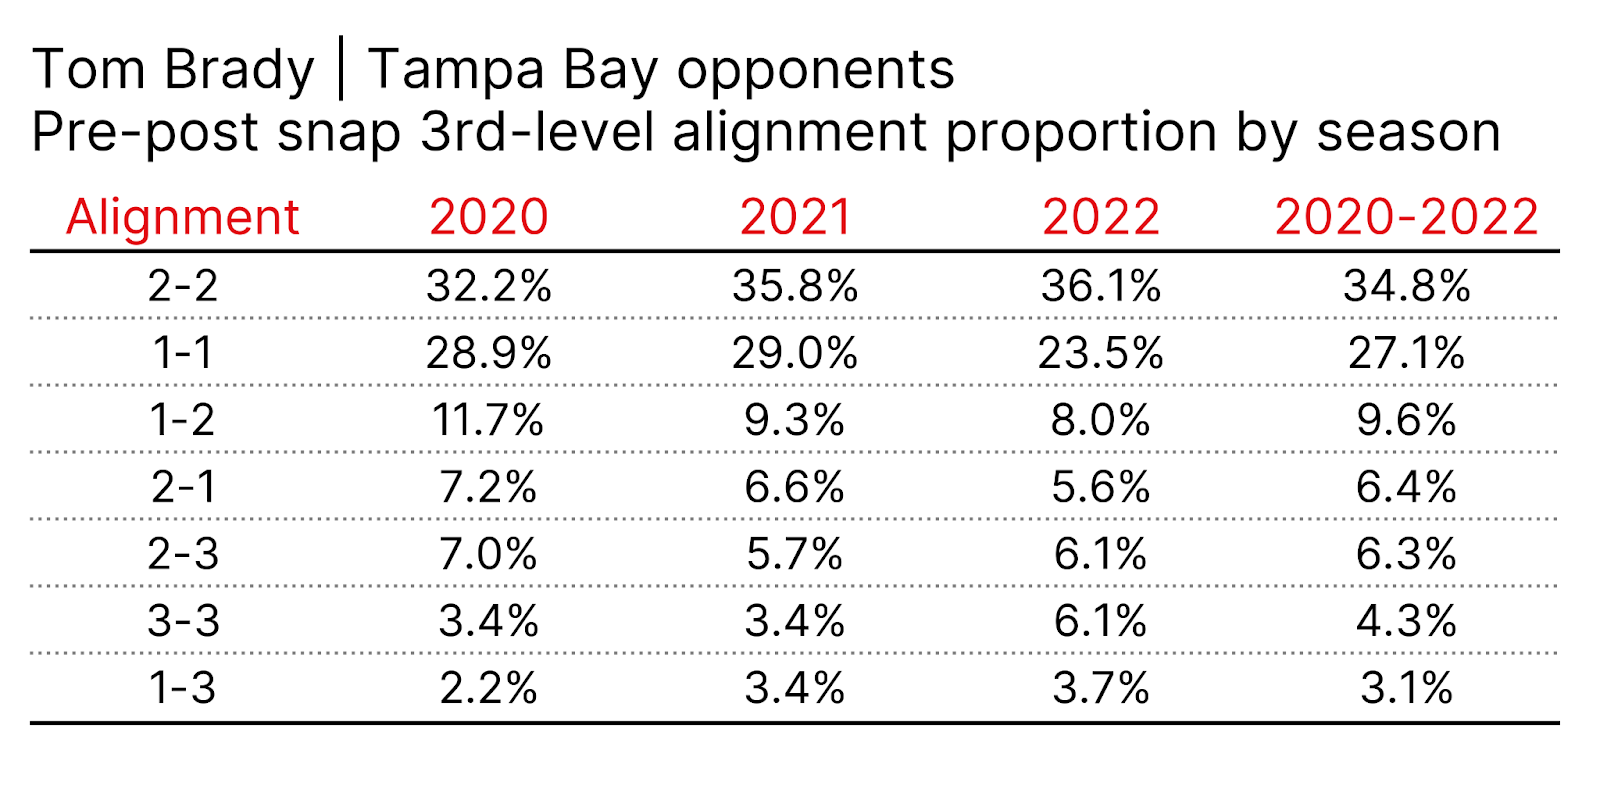
Two deep players both pre- and post-snap on 34.8% of plays was the most common alignment when facing TB12, with the proportion jumping from 2020 to 2021. Single safety looks were next most common, with a steep decline from 2021 to 2022. An interesting aspect here is that changes pre- and post-snap became less prevalent over time
Alignments with 3 or 4 defenders deep typically see 2 safeties dropping deep with one or more corners also moving back to cover deep-shots. The below play on 3rd-and-20 is a good example, with 3 players deep pre-snap followed by #35 dropping back to the 3rd level as the play progresses.
One final Super Bowl
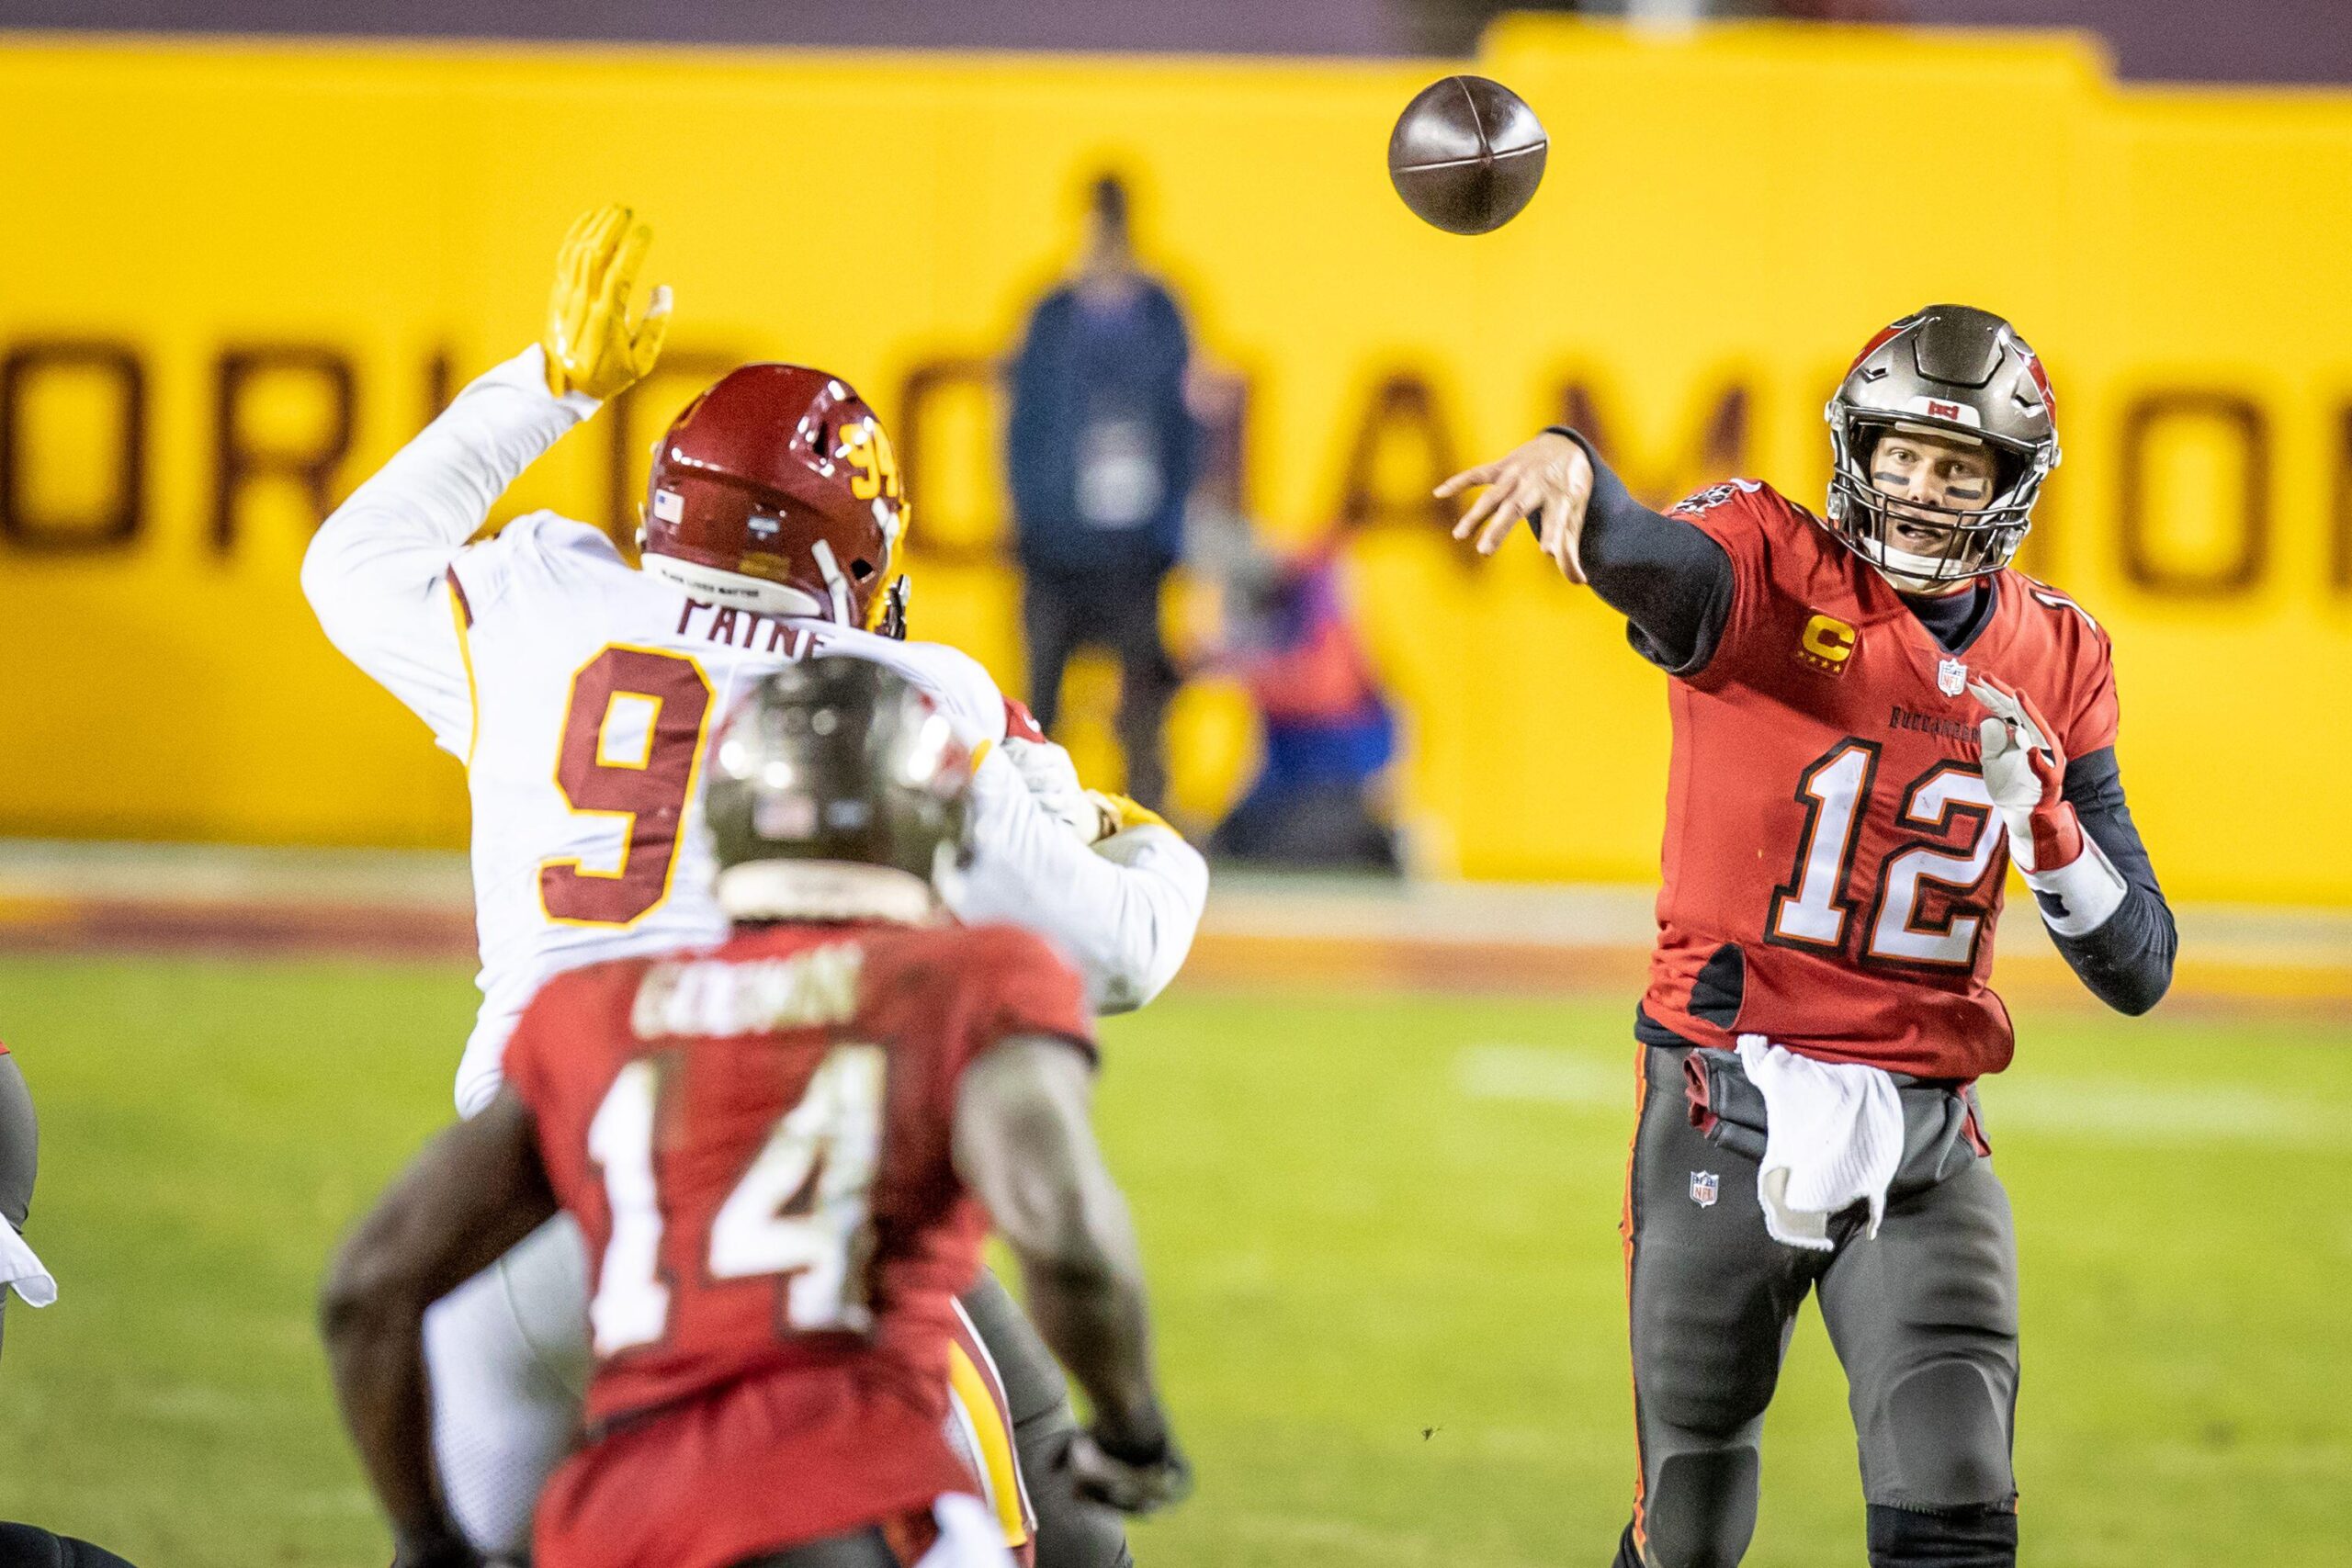
By releasing the 2020 season, we’ve now dropped Brady’s last Super Bowl where he faced off against the pretender to the GOAT throne, Patrick Mahomes. Remarkably, the Chiefs were held to just 9 points and zero touchdowns, while the Buccaneers put up 31 points and Brady picked up his 7th and final Super Bowl ring.
Over the course of the 2020 season (excluding the Super Bowl), the Tampa Bay defense ran with one-deep safety post-snap on 32.1% of it’s passing plays - this dropped to just 3.9% in the Super Bowl (two plays total). Two players stationed deep post-snap jumped from 35.6% to 52.9% over the same splits, with the corners dropping back at far higher rates as well.
Such a stark change in tactics and its execution was cited as a key factor in limiting the Chiefs’ passing offense on the day.
Conclusion
With the above method we’ve automatically identified the structures that a defense runs pre and post-snap using tracking data. There is much more that could be done along these lines – we’ve focussed here on the deepest level and broad trends rather than offensive efficiency against certain setups – which could be one avenue to explore. Tracking how individuals change level and rotate could be a further aspect.
Remember we’ve published the Python code to apply the above method, as well as a few extras. We look forward to seeing what you come up with!
