I am a sucker for alternative broadcasts. Maybe I have watched too many football games in my life (is that even possible?). Maybe I’m sick of the old cliches from announcers (“They just wanted it more today”). Or maybe I just like watching new things. Whatever the reason, I have enjoyed most attempts at different viewing options.
- Coaches booth for the NCAA National Championship - ✅
- Peyton and Eli - ✅
- Nickelodeon broadcast with fake slime, and kid announcers - ✅, ✅ and ✅
Last Thursday I got to check another alternative broadcast off the old bucket list. I finally watched the Prime Vision with Next Gen Stats broadcast on Amazon Prime and…I loved it! The information from Next Gen Stats (NGS) added so much to my viewing experience. I have always loved random statistical tidbits, and this experience was full of them. Target share of WR’s, top speeds, separation at time of throw, QB aggressiveness, and much more. It was amazing. It also reinforced the wide gap of information available from the NFL to college.
NFL Next Gen Stats
At this point, most people have heard of the NFL’s Next Gen Stats. Every player has chips on their shoulder pads, with another chip in the ball itself. Sensors are used throughout the stadium to pick up the location of the players and the ball. The sensors collect information every tenth of a second that includes information like player location, speed, acceleration, orientation, movement direction, and more. The NFL has a team of data scientists that use this tracking data to create metrics and tools for better analysis. Many of those are on display each week during the Thursday Night Prime Vision broadcast.
Data Gap
The first time I saw the NGS data was when I was working as the Director of Football Analytics at UVA. Each year the NFL hosts the Big Data Bowl where they release a sample to the public. My intern Alex Stern (currently with the LA Chargers), wanted to submit a project and asked me to take a look at the data they provided. I had been in my role for a few years, felt good about the work I was doing and thought I had a good handle on the state of football analytics. I took a look at the NGS data and was floored that there was that much data the NFL teams were getting. We were so far behind at the college level, not just in resources and manpower, but in just raw data. That gap has continued to grow as NFL teams have bolstered their analytics teams with hires like Alex, other former UVA students Joseph Wysocki (Lions) and Ella Summer (Dolphins), and others.
Aggressiveness
Our event tracking data is helping teams lower the data gap from NCAA to NFL. Not just college teams getting more data, but NFL teams getting better data on college teams. To show how this works, let’s look at one of the NGS stats called Aggressiveness.
From the NFL NGS website: “Aggressiveness tracks the amount of passing attempts a quarterback makes that are into tight coverage, where there is a defender within 1 yard or less of the receiver at the time of completion or incompletion. AGG is shown as a % of attempts into tight windows over all passing attempts.”
To create a metric like this, you need locational data of where everybody is on the field at the time of completion or incompletion (or interception). Using our data from the 2021 season, I was able to recreate the metric for college quarterbacks. The charts below show the top 10 and bottom 10 quarterbacks in Aggressiveness.
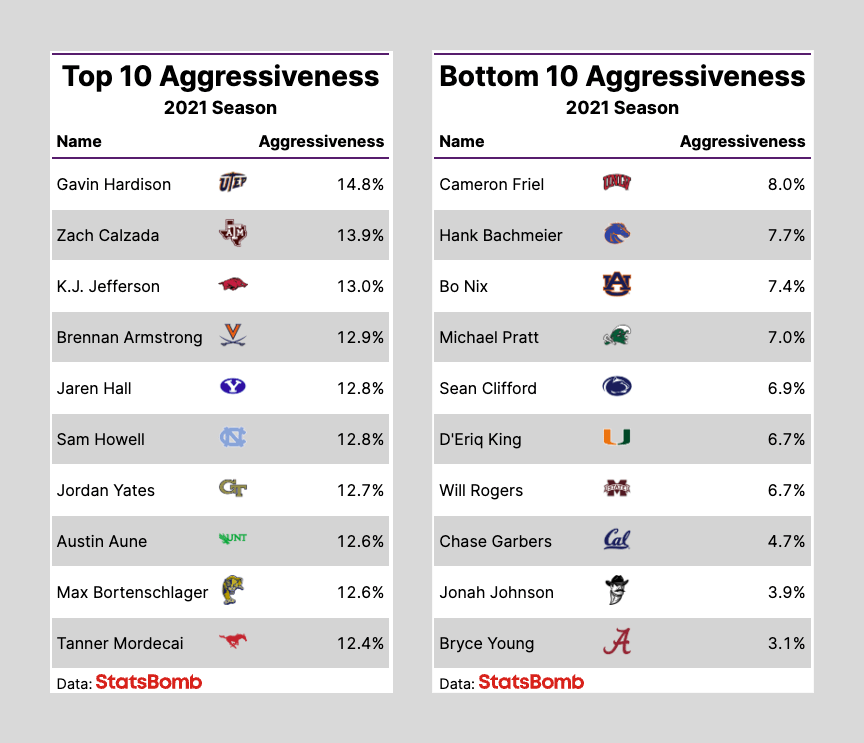
Before anyone comes after me or StatsBomb on Twitter. Aggressiveness DOES NOT mean good or bad. Bryce Young having the lowest aggressive percentage throws does not mean he is a bad quarterback. Take a look at the QB with the lowest aggressiveness percentage in the NFL for 2021…go ahead…the rest of the article will still be here for you when you get back. (For those that don’t want to go look, it was Patrick Mahomes).
If it doesn’t mean good or bad, what does this metric mean? How can it be utilized by coaches or analysts? There are many things at play with any metric, and this one is no different. Offensive scheme variety can play a big part in differentiation in aggressiveness. There is a reason Patrick Mahomes was last in the NFL in aggressiveness in 2021. Left-handed, sidearm, shovel, shot put throws. Watching him play, there is no question he is an aggressive quarterback. However, he happens to play for Andy Reid. Reid is one of the most innovative offensive minds in NFL history. Few teams do a better job creating open receivers than the Kansas City Chiefs. Looking at the NCAA numbers, Will Rogers is someone that sticks out among the QBs with the lowest Aggressiveness. Rogers plays quarterback for Mississippi State and Mike Leach. The Air Raid system they run is predicated on quick, shorter passes, which typically have more open receivers and don’t require throws into tight windows.
Another impact is the talent differential between teams. The NFL is a league that is set up for parity. The worst team each season gets the first pick and the best chance to replenish their team with good players. The schedule is set up each season where the best teams from each division play each other. Considering all of this, you would expect receivers to be fairly evenly matched with the defensive players. This leads to less separation on routes, and more aggressive throws from quarterbacks. This is backed up by the data. The NFL numbers for aggressiveness are higher than the college numbers. The talent differential, however, is more pronounced at the collegiate level. This works both ways with some offenses being much better than the talent they play, while others are much worse. This can have an impact on aggressiveness levels for quarterbacks as well.
Conclusion
The data and infrastructure gap between the NFL to other sports is astounding. MLB teams have 30-person analytics departments, and NBA teams regularly are in the double digits as well. At this point, every team in the NFL has at least one person working on analytics, but many departments are still quite small. The drop to college is even more stark. At last count, there are less than 5 college teams with full-time people working on analytics. StatsBomb is working to help close this gap. Our Data and IQ platform will give analytics teams a competitive edge in their recruitment and change how the game is analysed, forever.
Matthew Edwards
Head of American Football Analysis
@thecoachedwards
