The San Francisco 49ers journey to the Super Bowl has been built on their league leading offense in combination with a strong defense. Their passing game has particularly fired, comfortably leading the league in terms of efficiency as measured by expected points added per play and success rate. Per our numbers, their rushing game sat a close second to the Buffalo Bills - whether throwing or running the ball, they’ve caused opposition defenses extensive problems this season.
The Shanahan scheme and the positional versatility of their skill players has been often cited, plus varying degrees of credit the discourse has granted to Brock Purdy whenever you’re reading this.
Ahead of their showdown in Las Vegas, we’re going to analyze their offense through the lens of some new models we’re developing that illustrate potential drivers of their elite level of play this season.
Modelling expected pass rates
Here at StatsBomb towers, we're in the midst of developing our take on expected pass/rush rate models. The standard version of this is based on the pre-play context (down, distance, yards-to-go, time, scoreline etc.) that has been popularized by the nflverse community. The idea is that a model predicts the probability of the offense dropping back to pass. For example on 3rd and long, down 7 and with time running out we’d expect the offense to drop back and make a passing play. Conversely, teams in the lead and in short yardage situations are liable to run the ball.
Such a model provides valuable context for any analysis, as well as helping profile how pass or run heavy an offense is.
As well as the above, we're developing a version that is focused on what is presented on the field in terms of personnel and formation i.e. what “look” an offense gives the defense before snapping the ball. We know that such cues prompt adaptations by the defense, so the idea of the model is to try to quantify this.
In terms of this second model, which we’ll refer to as the “scheme” model, the most important features (in-order) are:
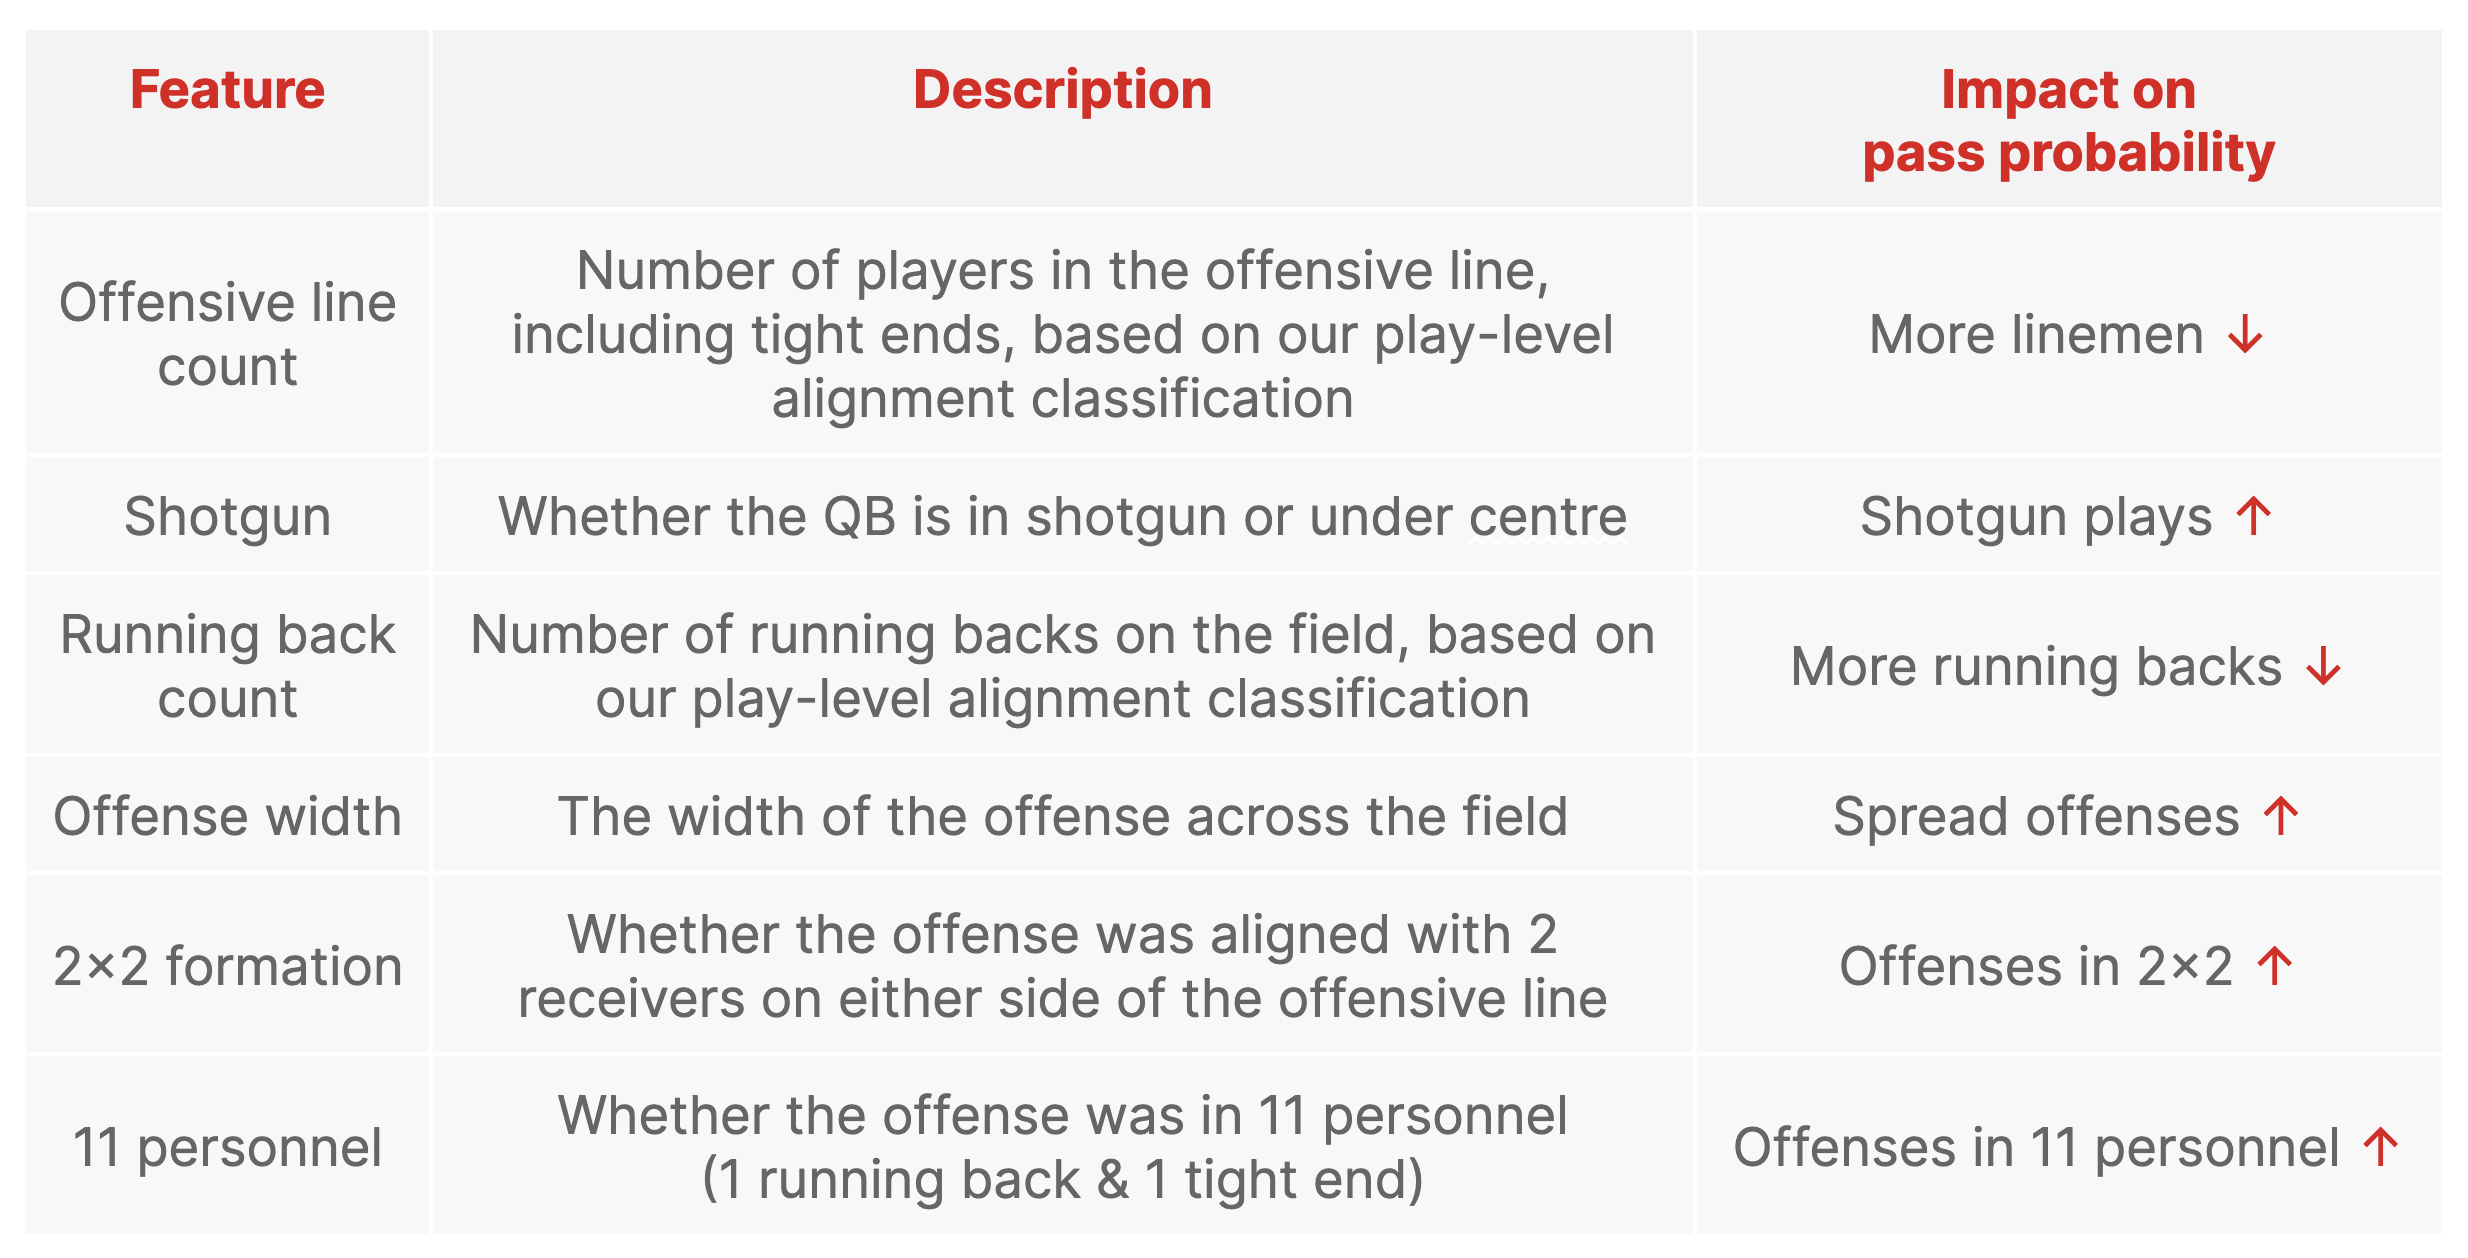
Additional formation, personnel and motion features are also included in the model, but are less important than the above key features.
From the above, we can calculate both the expected pass probability on a per play and aggregated basis, as well as Pass Rate Over Expected (PROE) to ascertain an offenses’ tendencies relative to how they’ve set up on a play.
Profiling the 49ers
In the figure below we can observe the expected pass rates from both the context and scheme models over the 2023 season - the 49ers are a clear outlier here in both models. Their propensity to score big early in the game, as well as their strong situations on a down-by-down basis leads them to have the lowest expected pass rate based on the game context. Their setup on the field skews towards the strongest run expectation as well - they are the only team below 0.5 pass probability i.e. they set up in a run look more often than not.
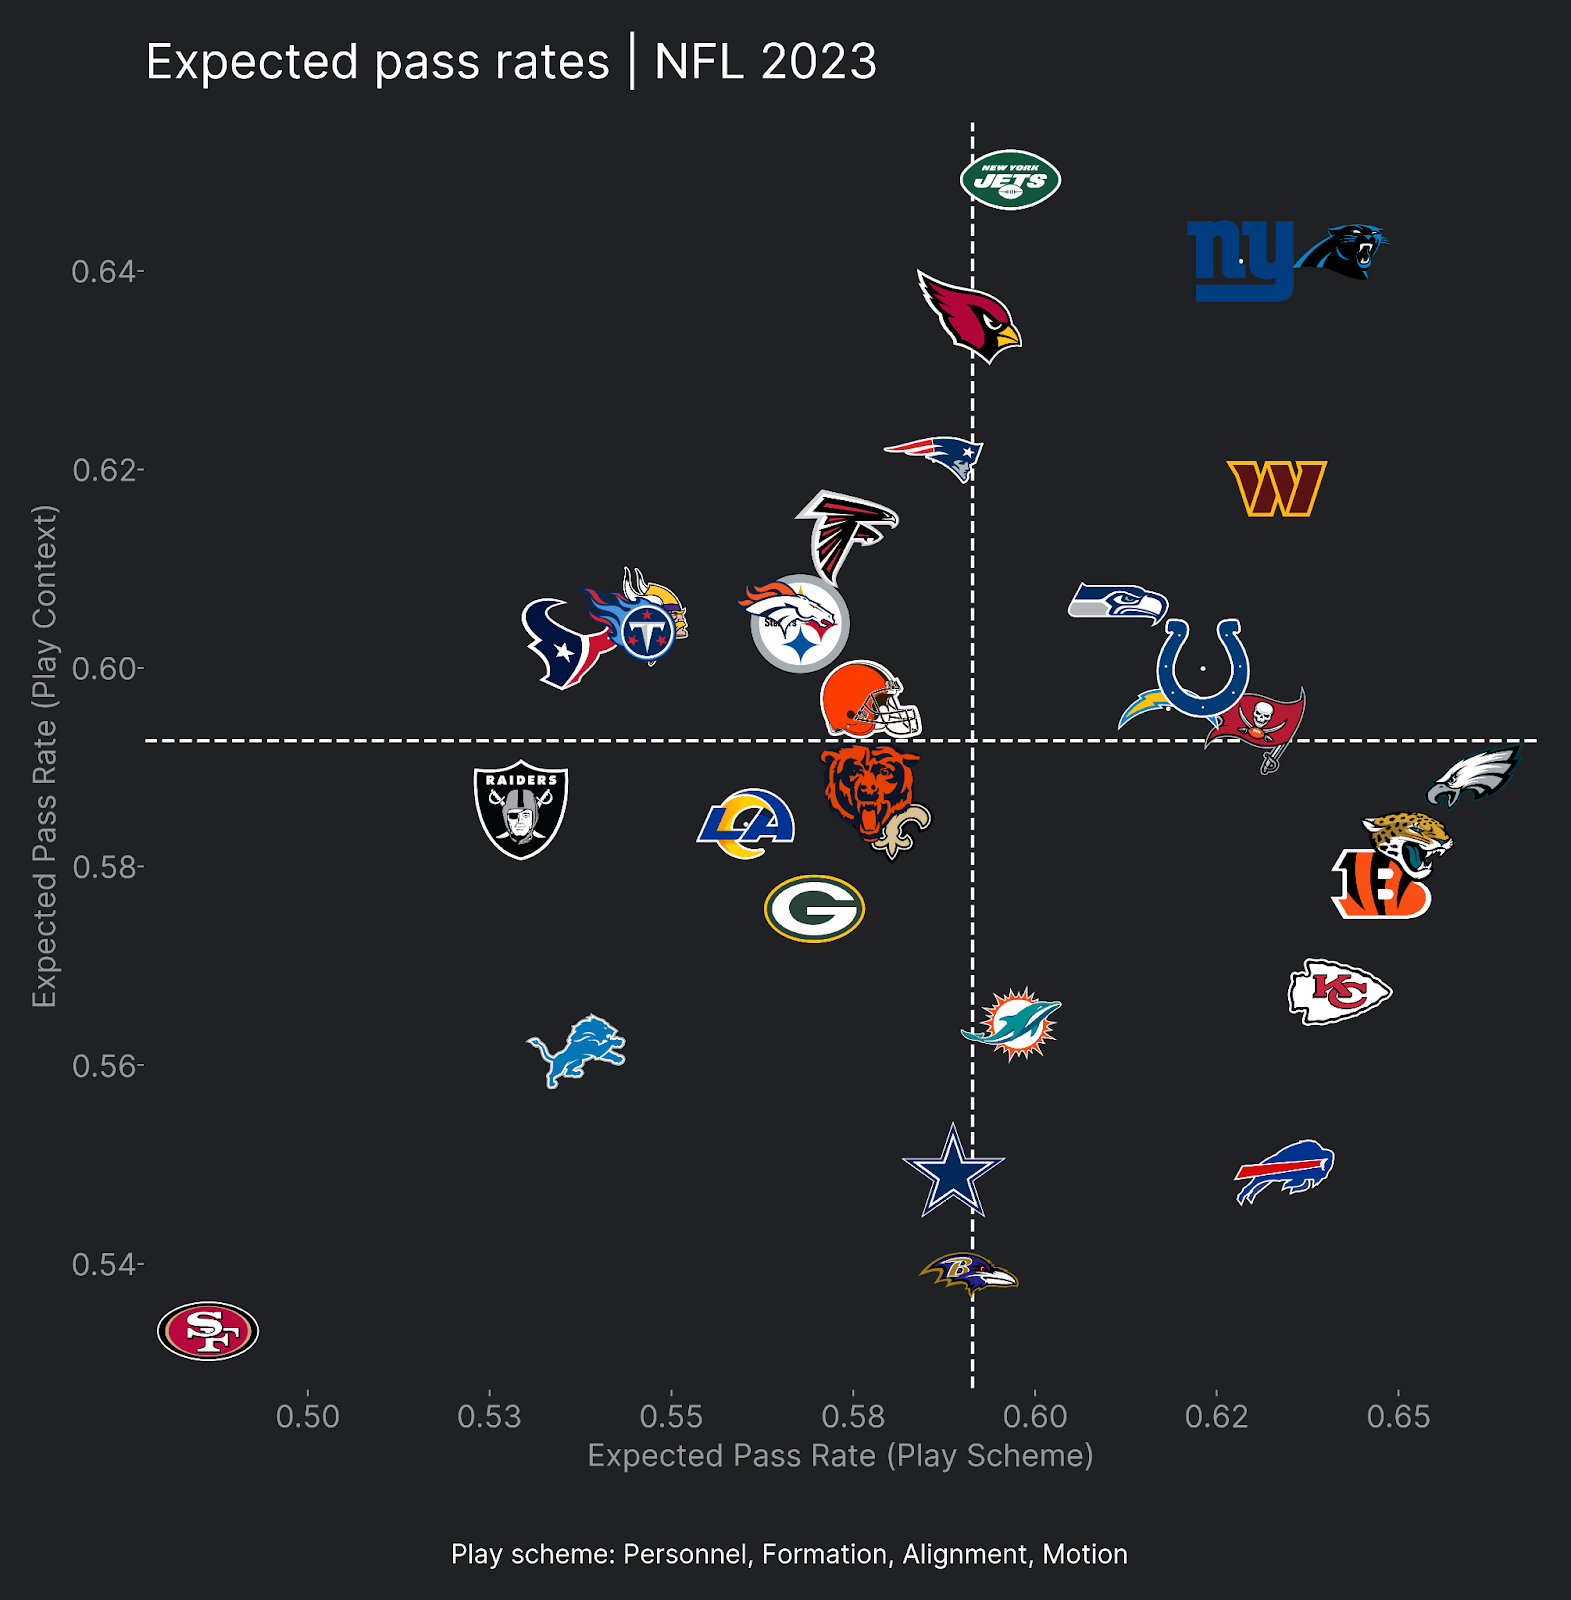
From a scheme perspective, they tick most of the boxes that drive a team towards low expected pass rates:
- Second in tight-ends attached to the offensive linemen
- Sixth lowest in plays out of shotgun
- Fifth highest rate of aligning with two running backs in the backfield
- Tied first with Sean McVay’s Rams for the narrowest offensive width
- Second and third lowest rate of using 2x2 and 3x1 formations respectively
- Second lowest rate of 11 personnel usage
- Second highest usage of both 21 and 22 personnel
OK, so it looks like the 49ers set up to run the damn ball based on their scheme and this matches expectation based on the context of the game pre-snap too. So what do they actually do?
Below we compare their PROE based on their play scheme against their expected pass rate from the same model; the 49ers rank highly here in 5th place. None of the teams above them have been good in the run game this season, with the Vikings highest ranked in 14th in EPA per rush.
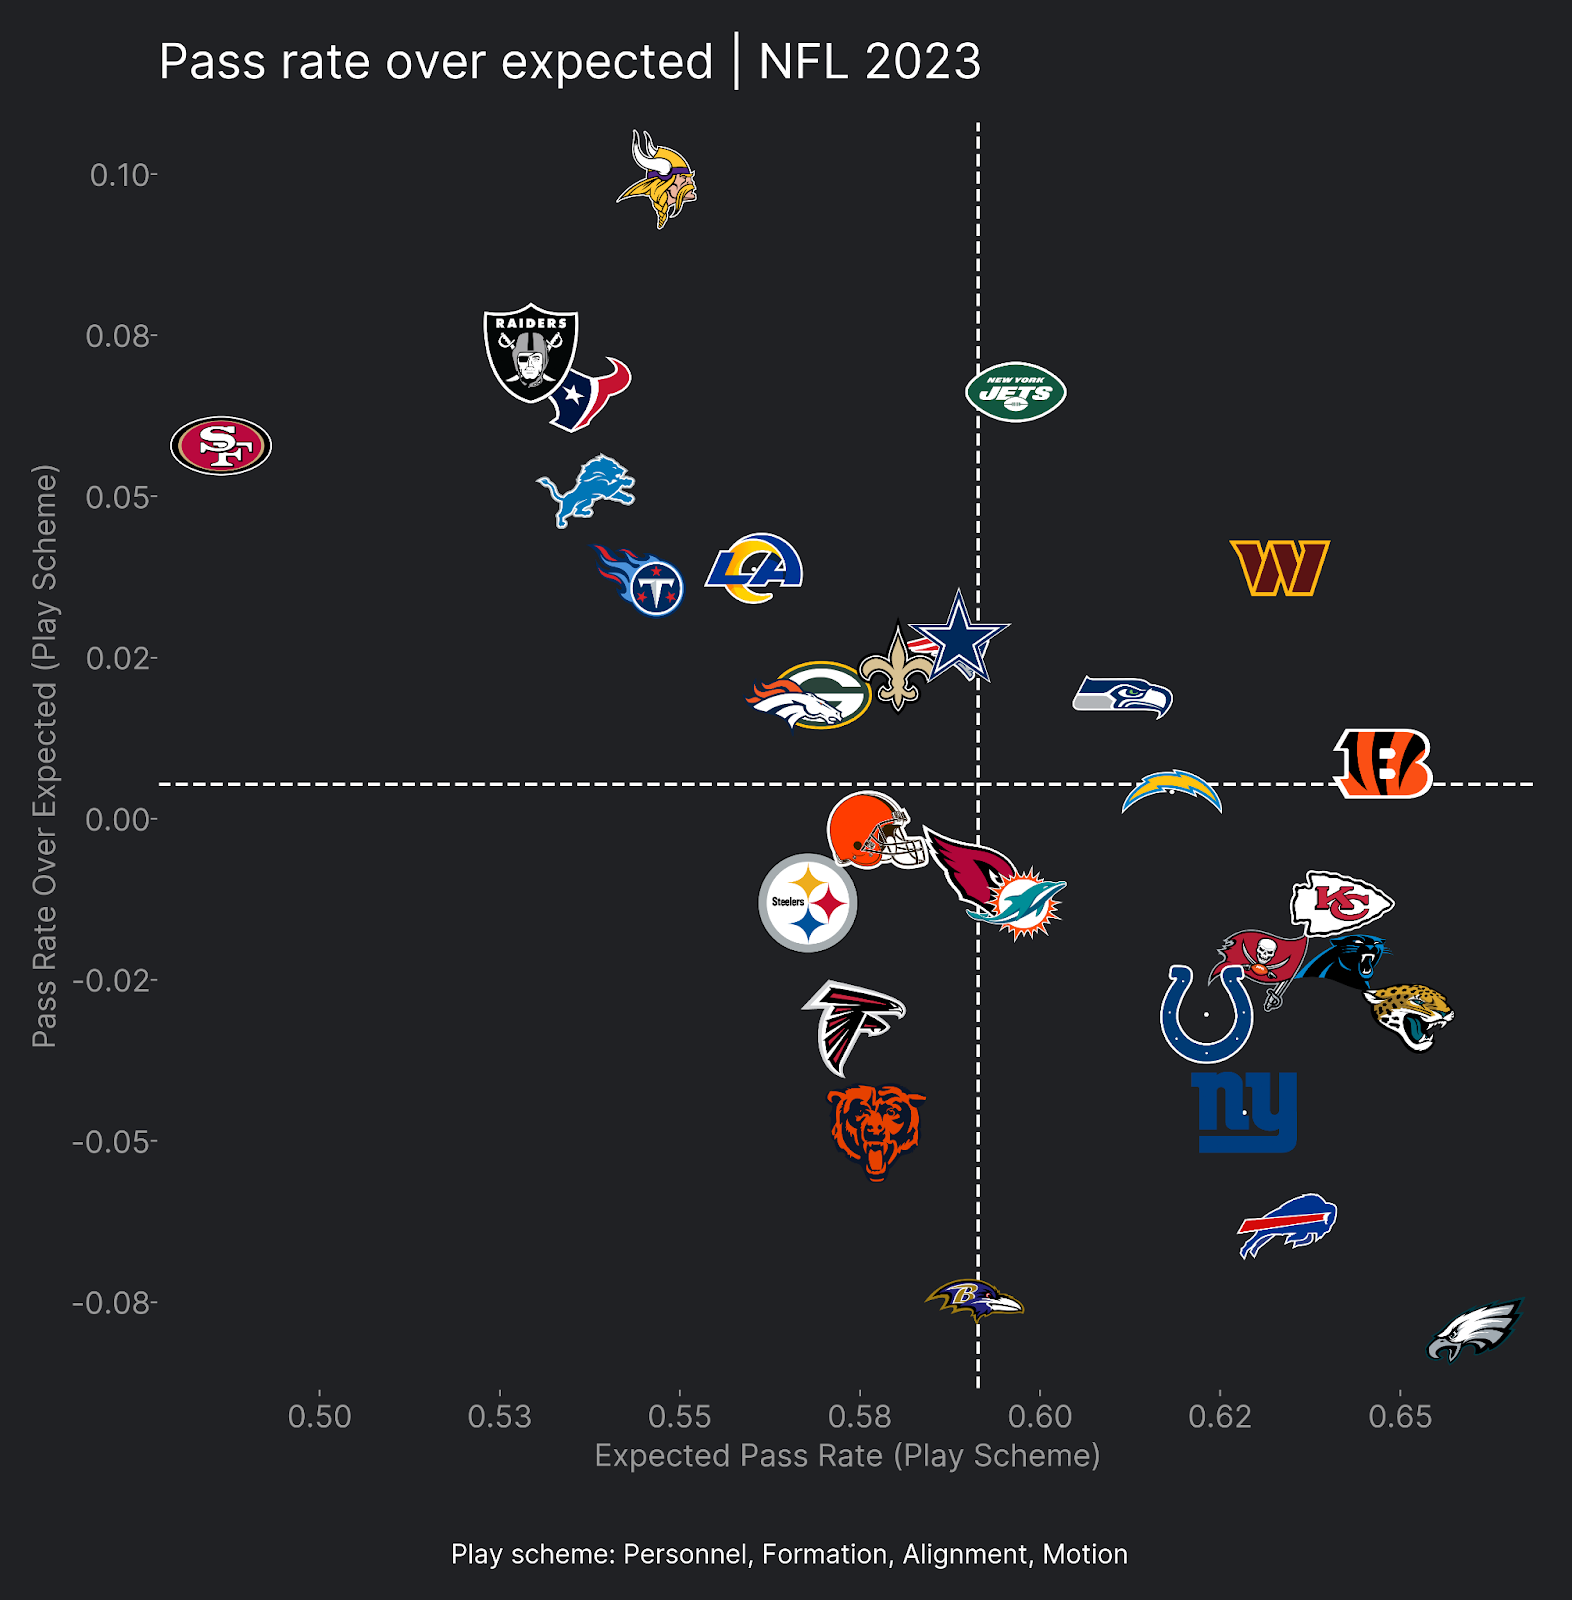
The Eagles are the flip-side here with a heavy run bias out of their shotgun heavy spread formations. The Ravens ability to run out of neutral pass/run looks relative to the league is another interesting feature here. With the Bills, Ravens and Eagles occupying the lowest PROE values based on scheme, the rushing skills of their quarterbacks is clearly an interesting observation here.
Offensive efficiency
From a performance perspective, one theory might be that teams that are able to pass out of run looks and vice versa may be more efficient if they can exploit how the defenses are set up. For example, if a defense expected the offense to pass they might go with a light box which could lead to a higher efficiency run play. Similarly a defense setup to stop the run and with single-high coverage may be at risk of giving up a big play if the offense surprises them with a passing play.
The plot below examines the relationship between EPA per play and expected pass rate from the scheme model for both passing and rushing separately. The relationship between them is calculated by fitting a Generalized Additive Model between the two variables, with the central line representing the mean and the shaded area the 90% confidence interval.
The blue line is the NFL average (excluding the 49ers) while the red is the 49ers.
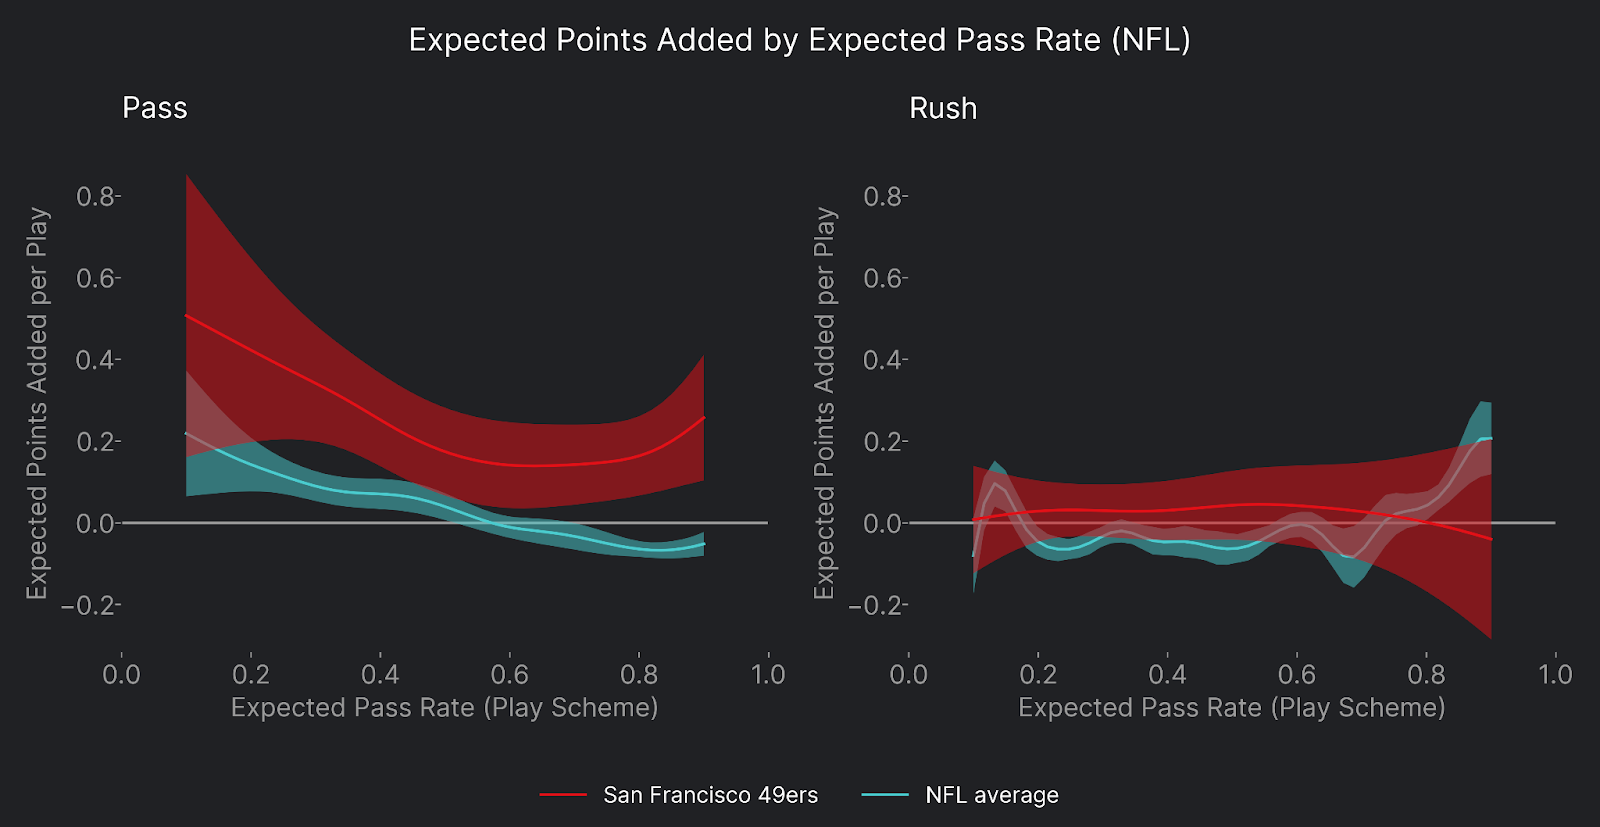
There is clearer evidence for passing plays being more efficient when teams present a run look based on the expected pass rate determined by the play scheme model. The relationship when running the ball is less clear, aside from very high expected pass rate looks where rushing efficiency does increase based on the league average.
We can see that the 49ers rushing efficiency is neither appreciably stronger as a function of expected pass rate, nor are they sufficiently different from the league average. They are though very strong in the passing game relative to the league average, maintaining positive efficiency across the board. They are more efficient at lower expected pass rates i.e. when showing a run scheme setup, but the uncertainties are relatively large here given the sample sizes here over a single NFL season.
Conclusion
Based on our initial analysis above, being able to pass out of personnel and formations that suggest a rushing play can add extra juice to an offense. Similar observations hold in college football (yes, we have all of this for college too). The conclusions above also hold when controlling for team offensive and defensive strength based on our early work in this area.
These broad conclusions hold for the 49ers in the passing game and they are clear outliers when it comes to their scheme profile and tendency to pass out of situations where they present as if they’ll run the ball. The extraordinary versatility of having two unicorn players in Deebo Samuel and Christian McCaffrey pushes them to levels above their peers, which is obviously hard to replicate.
Looking ahead to the Super Bowl, the Chiefs comparatively weaker run defense relative to their strong pass defense has raised questions over how they’ll stop, or at least slow down, the 49ers running game. The above analysis illustrates the threat that the 49ers can offer when passing out of a run set up. Their ability to generate explosive passing plays out of these could be key this weekend, and the Chiefs will need to have solutions to mitigate this key facet of their success this season.
