In most sports, statistical evaluation of offense is easier and thus mastered earlier than similar examinations of defense. Football is no exception. Most of the stats and metrics generated concern the ball; who has it? Where? How far did they go? Though it is easy to measure offensive output against a defense, that isn’t always or even usually the same thing as capturing the effectiveness of that defense. There are a number of reasons, but one stands above all else: how do you measure things that didn’t happen.
We know how many yards were gained in a game, whether a pass was completed or a third-down was converted into a new set of downs. But how much of an offense’s success is their own excellence compared to defensive failings? Without good defensive metrics, the question of credit assignment is hard to answer.
Providing better data to address those questions about defensive play is a core part of StatsBomb’s football products.
As the saying goes, to defend everything is to defend nothing. And to that end, defensive coaches have long realized that they have to pick and choose what areas to defend most vigorously in the hope that an offense will have to make a series of spectacular plays to beat them.
So the first question when analyzing a defense is what areas they are choosing to protect most fervently and which they are more willing to concede? A simple example might be looking at a team’s defensive pass maps. While this will be to some degree influenced by the mix of offenses they have faced, it will also illustrate which areas have seen the most air traffic.
For example, comparing defensive heat maps from the 2021-22 season for Miami (on the left) and Virginia (on the right) shows that teams threw over the middle much more frequently against the ‘Canes, while UVA’s opponents worked the sidelines:

Of course, it’s not simply where the opposition has chosen to throw the ball, but also the level of success on each of those throws. Plotting completions and incompletions can partially tell that story, but this also eliminates important context. For example, in many situations, a defense will be content to give up a short completion after which the receiver is immediately brought down. On the other end of the spectrum, passes that result in explosive gains are much more damaging than simply counting “completions” would suggest.
StatsBomb data allows for an assessment of opponent passes in that context. In the chart below, “successful” plays - defined as gaining 40%+ of the yardage to go on a 1st down play, 60%+ on 2nd down or passing the line to gain on 3rd and 4th downs - are in yellow while unsuccessful plays are in blue, regardless of whether the pass was caught. In addition, those plays which resulted in explosive gains of 20+ yards and/or touchdowns are identified in red. This provides an at-a-glance illustration of what areas have been most and least exploited by opposing passing attacks.
Again, comparing The U and UVA from last season:
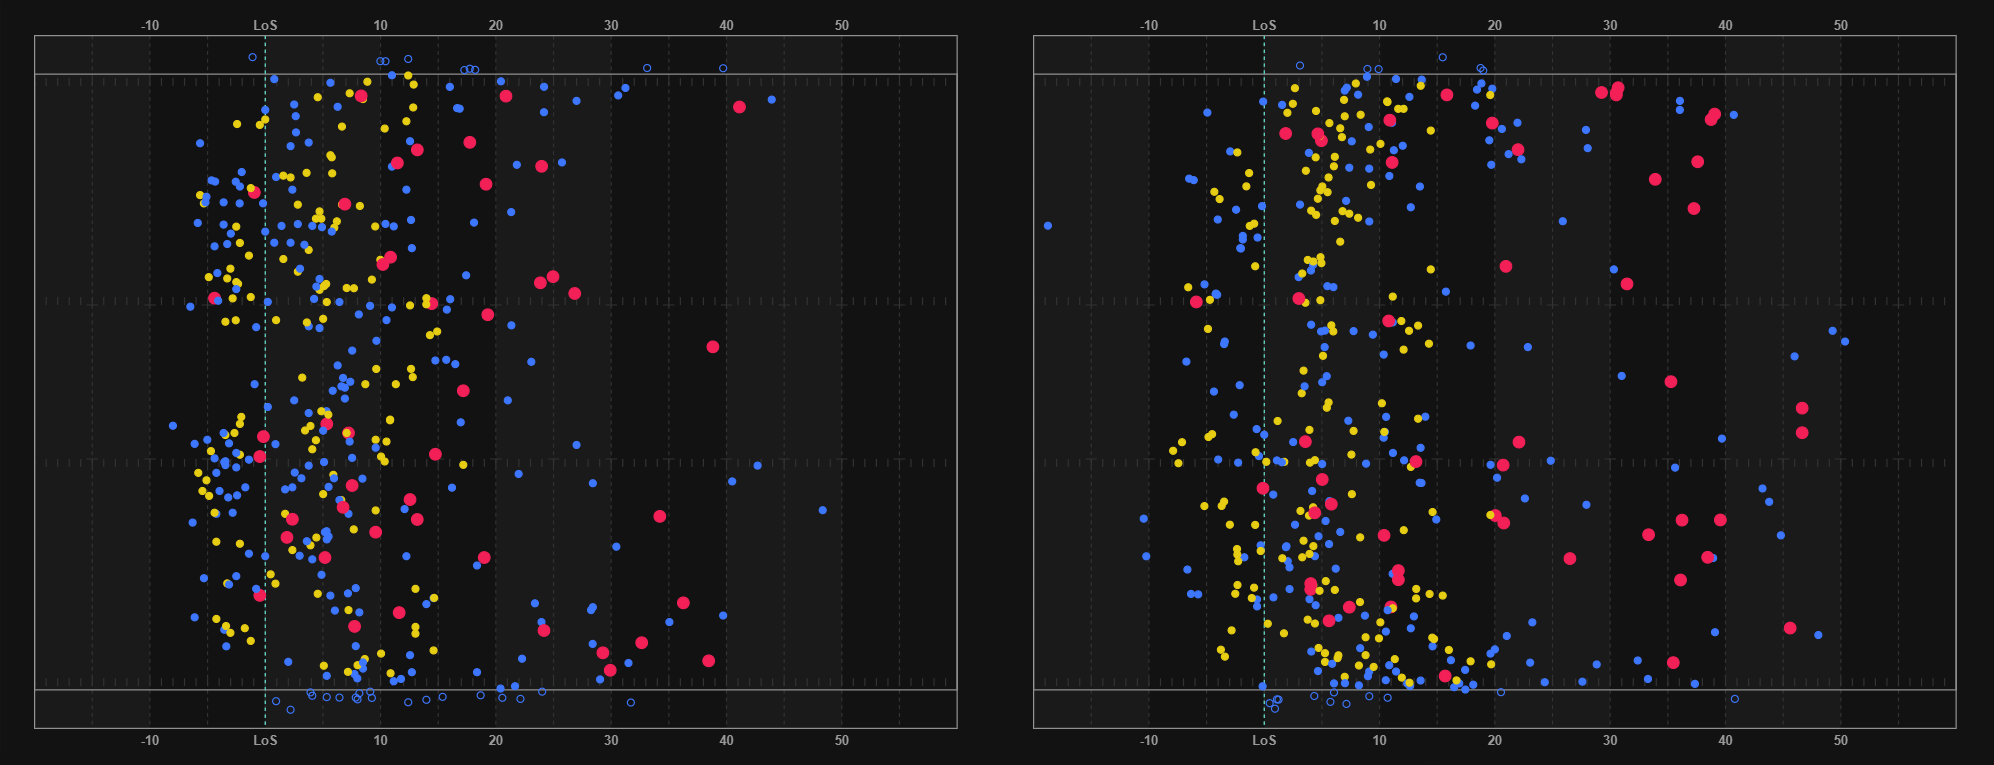
The cluster of explosive plays allowed by Miami on passes over the middle around the right hash would be worth further investigation, while UVA appears to have been susceptible to big plays on deep shots.
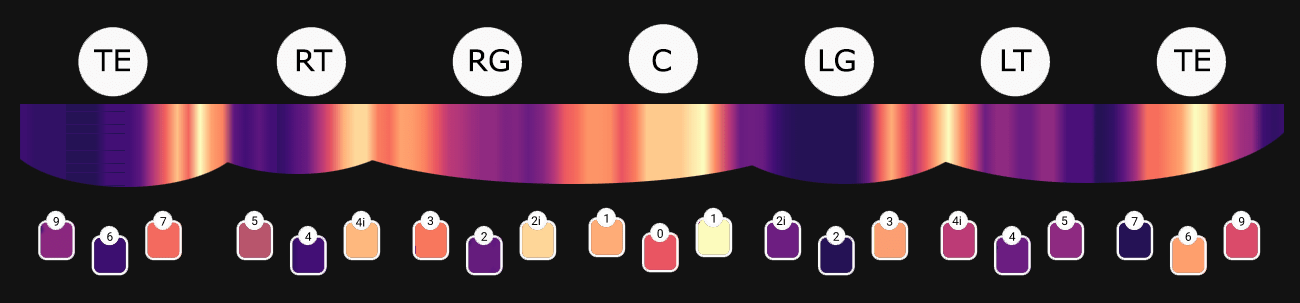
Analysis of the running game is somewhat similar. A coach needs to know both how a team is executing the designed scheme alongside judging how effective that scheme has been. One example of this would be to look at first contact on running plays. Just where is the first defender meeting the ball carrier? The chart below is color-coded by where the ball carrier was tackled behind the line or crossed the line of scrimmage, purple being outside of the left tackle, blue being between the tackles and orange off right tackle. This data can be filtered on a wide range of factors, from down & distance to personnel to run type. If a defense is struggling to get to the ball carrier, it will show up here.
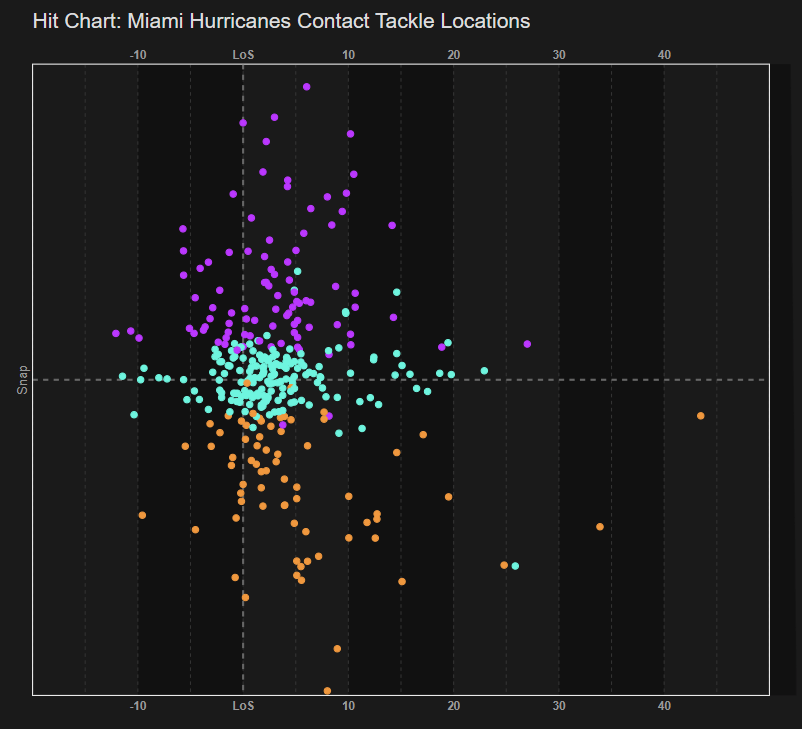
At a glance, running to the left often let ball carriers get outside contain and well up the sideline before being touched, while there also seemed to be an alarming number of runs up the middle with 10+ yards gained before anyone made contact with the running back,
First contact isn’t the end of the story. This isn't two-hand touch, and many a defense has been undone by poor tackling. By comparing the point of first contact with the location the ball is eventually downed, a coach can quickly see how often broken and missed tackles are giving up big chunks of extra yardage.
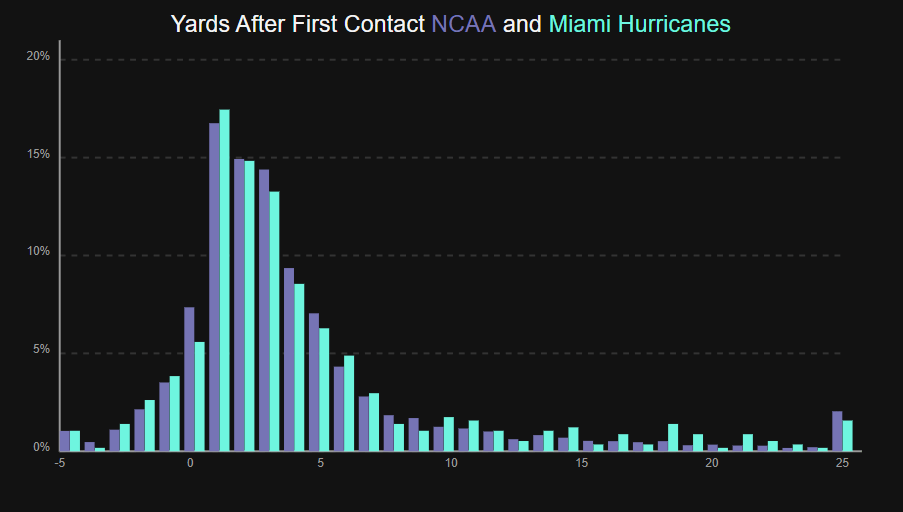
Compared to the rest of FBS, Miami wasn’t quite as good at bringing the runner down immediately, giving up an extra 2-3 yards somewhat frequently, while also allowing 10+ yards after first contact much more often than average.
I’d be remiss if I didn’t mention the big uglies up front. Line play has a tremendous impact on the end result of the play, and just as StatsBomb’s line battles data allows for evaluation of the offensive line, it can do the same for a defense. How well do defenders fill gaps and either get off blocks to make plays themselves or eat multiple blockers to allow space for linebackers to do the same in the run game? Where has a defensive front been most effective in generating pressure on the QB in the passing game?
As with all of StatsBomb Football data, the aim is to get the best information in the hands of coaches and personnel decision-makers quickly and to provide the best tools to analyze that data.
I’ve described just a few of the limitless approaches above, but if you'd like to see more of the game-changing insights our data makes possible, please get in touch via Sales@StatsBomb.com for a demo.
