When evaluating quarterback decision making and performance, it's important to consider the trade-offs as a play evolves. When pressured, the ability to judge the fine line between when to throw the ball or scramble or relocate in the pocket to avoid the sack is a key skill.
Arguably the best example of this in the current NFL is Patrick Mahomes, who combines elite passing efficiency, low sack rates and effective scrambling when required. As would thus be expected, most performance metrics for QBs worthy of the name rank him as one of, if not the best in the NFL.
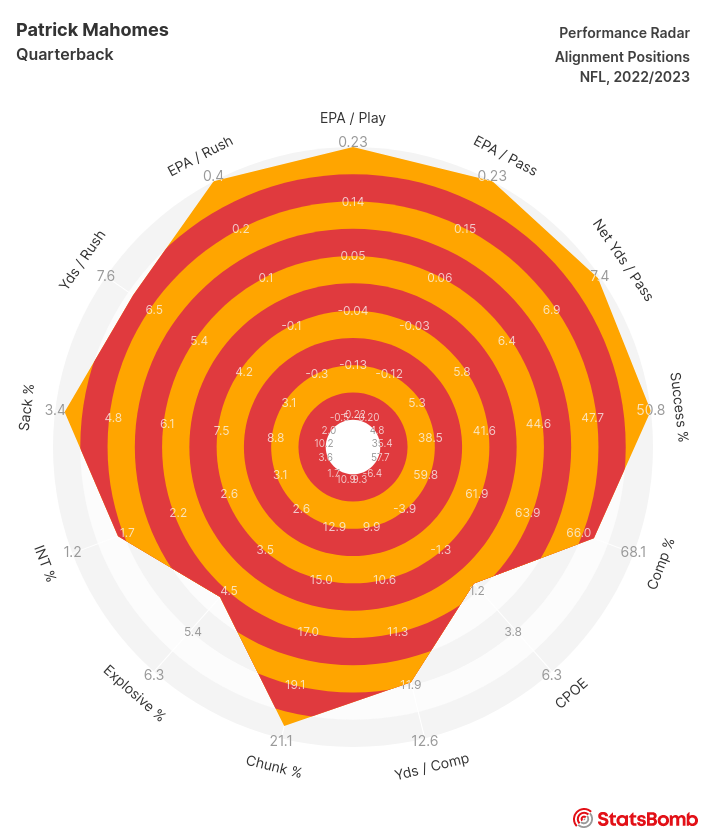
His performance radar for the 2022 season rather neatly summarizes this.
However, one metric where his performance dips is Completion Percentage Over Expected (CPOE), with both StatsBomb’s and public models routinely placing him towards or even below league average over recent seasons. Tracking-derived models have been particularly down on him. However, his stock did rise last season, particularly in the nflfastR numbers built from play-by-play data that had him at number 3 and thus a position more in-keeping with his elite reputation.
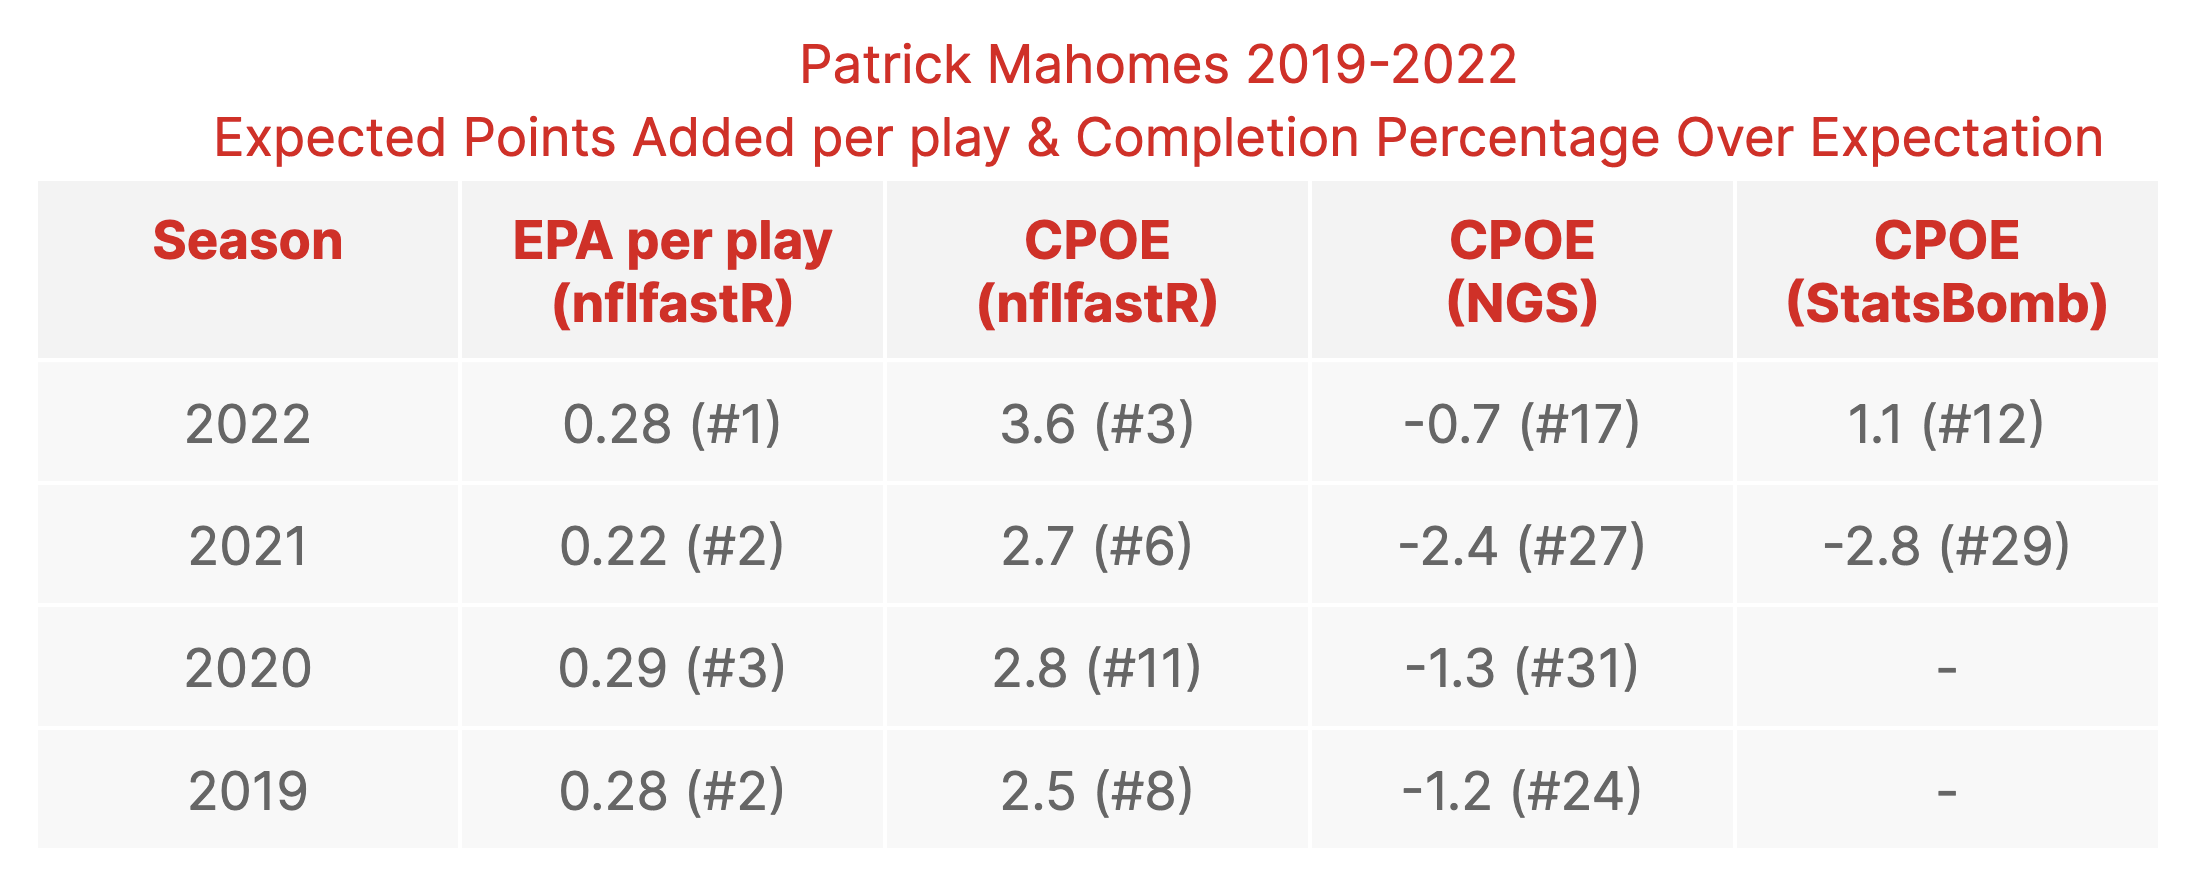
Minimum 135 passing attempts. Ranking for each metric is given in brackets. NGS data is regular season only. The data source for the nflfastR values is the nflelo website.
In soccer, we apply the “Messi test” to attacking metrics as part of the validation - if he isn’t near the summit, then questions are asked of its utility. Mahomes is probably the other football’s equivalent, so his relatively lowly status is possibly the strongest argument against CPOE as a performance evaluation metric.
(Obviously these validations are far more rounded and thorough in reality, but at some point people just want to see a ranking list of players and judge for themselves.)
Evaluation framework
When reviewing the outputs from our completion probability model on video, one thing that becomes apparent is that Mahomes frequently finds himself attempting completions in situations where many of his peers would have already thrown the ball away or been sacked.
This prompted the thought that perhaps considering all of the possible outcomes when a QB drops-back might be an illuminating means of profiling and evaluating them. Currently, these are split across different metrics/models - expected completion probability covers pass-outcomes (completion/incompletion/interception), while scrambling and sacks have traditionally been derived from counting metrics.
Given this, we developed a model to predict whether a drop-back play ends with a:
- Completion
- Incompletion (includes throw-aways)
- Interception
- Scramble
- Sack
We utilize our own event and low-frequency tracking data that tracks player locations from the start of the play and updates at a minimum of 2.5 times per second. The penultimate frame prior to the throw, sack or exiting the pocket is used to derive features up to a maximum of 2.5 seconds post-snap. We use this time-limit to avoid leaking too much information into the model training task; as time progresses on a play, sacks and scrambles become more and more likely and also quite evident in the tracking data.
We derive features from the tracking frames to quantify the pressure on the QB, plus representations of receiver separation and location relative to the QB. Note that the model differs with typical tracking-based completion probability models that use features for the targeted receiver only, whereas here we are instead interested in all of the QBs receivers as their separation and proximity will be strong determinants of the play's outcome.
Contextual features were also included (yardline, down, distance, time-to-throw).
Example of a tracking frame at the time of a throw with player tracks shown as lines connected to each player. Red markers are the offense, blue is the defense and the quarterback is highlighted in pink.
Our modelling approach is in development, with the results below from an XGBoost model trained on NFL and NCAA data from the 2022 season. We are also experimenting with graph and convolutional neural networks, which to now have had similar model performance metrics as the XGBoost version.
The most important features according to the model are pressure on the QB, time-to-throw, drop-back point and the separation generated by their receivers.
From the probabilities of each outcome, we can calculate how each QB’s actual outcomes measure up to expected rates.
Below we compare their completion rate over expected (at the play level) vs their sack rate over expected.
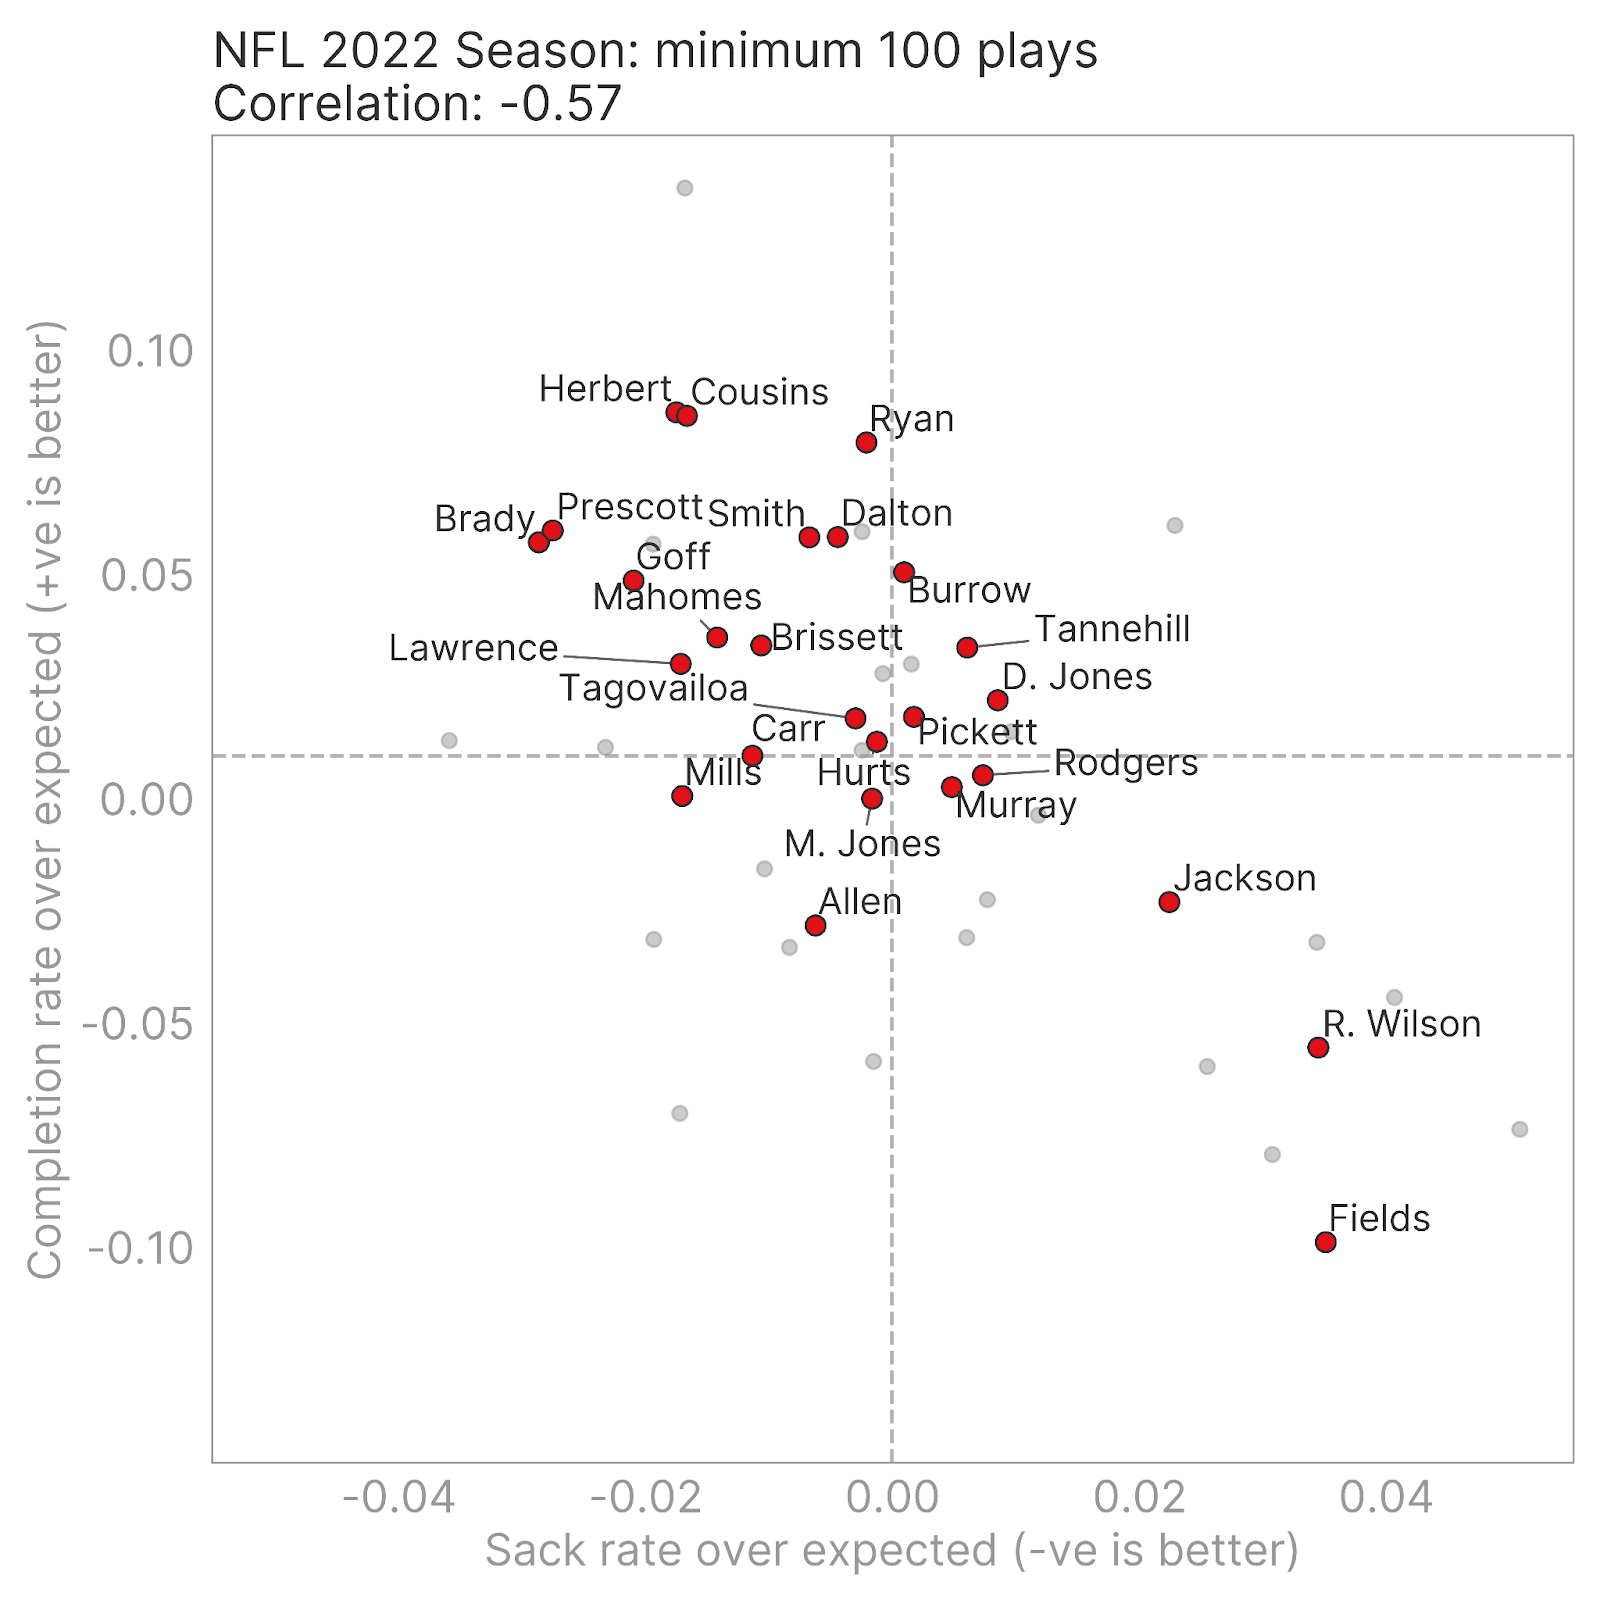
Completion rate over expected vs sack rate over expected in the NFL 2022 season. QBs with a minimum of 100 plays are shown, with those with over 300 plays highlighted.
We can observe a number of QBs maintaining strong positive outcomes, while avoiding sacks, particularly Justin Herbert and Kirk Cousins, while Tom Brady’s sack avoidance is clear to see even in his final season. Joe Burrow, who ranked third in our CPOE metric in 2022 is intriguing here as his completion rate relative to expectation is less impressive at the play level while being neutral for sacks. Justin Fields’ position belongs firmly in the “bold strategy” category.
Next we contrast their completion rate over expected vs their scramble rate over expected.
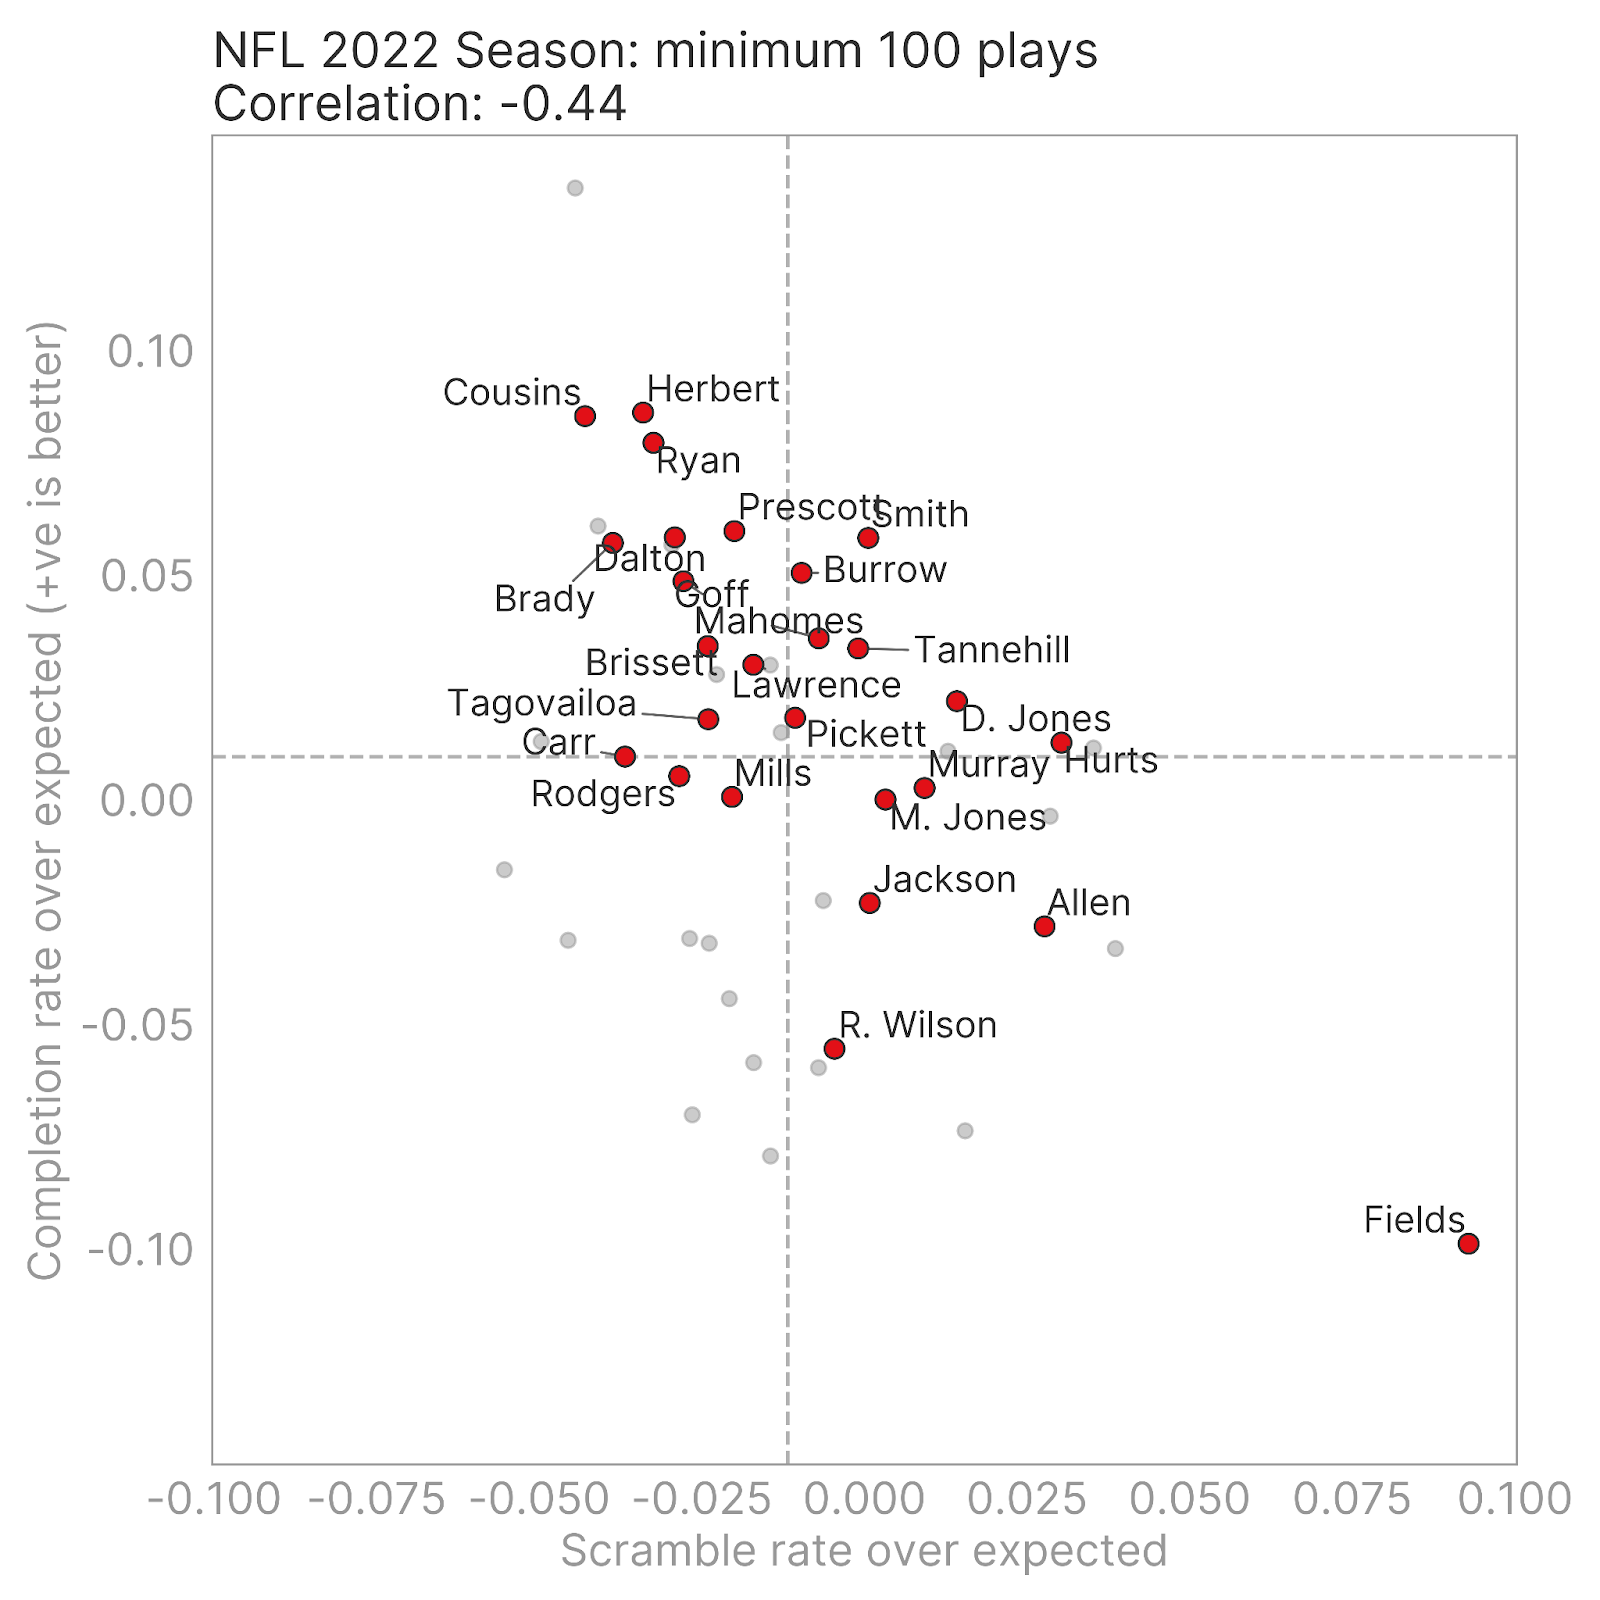
Completion rate over expected vs scramble rate over expected in the NFL 2022 season. QBs with a minimum of 100 plays are shown, with those with over 300 plays highlighted.
To an extent, this paints a similar picture to the previous figure given the association between scrambling and being sacked. Justin Fields’ scramble rate over expectation is the very definition of an outlier.
Following the above, we finally compare scramble rate over expected vs sack rate over expected.
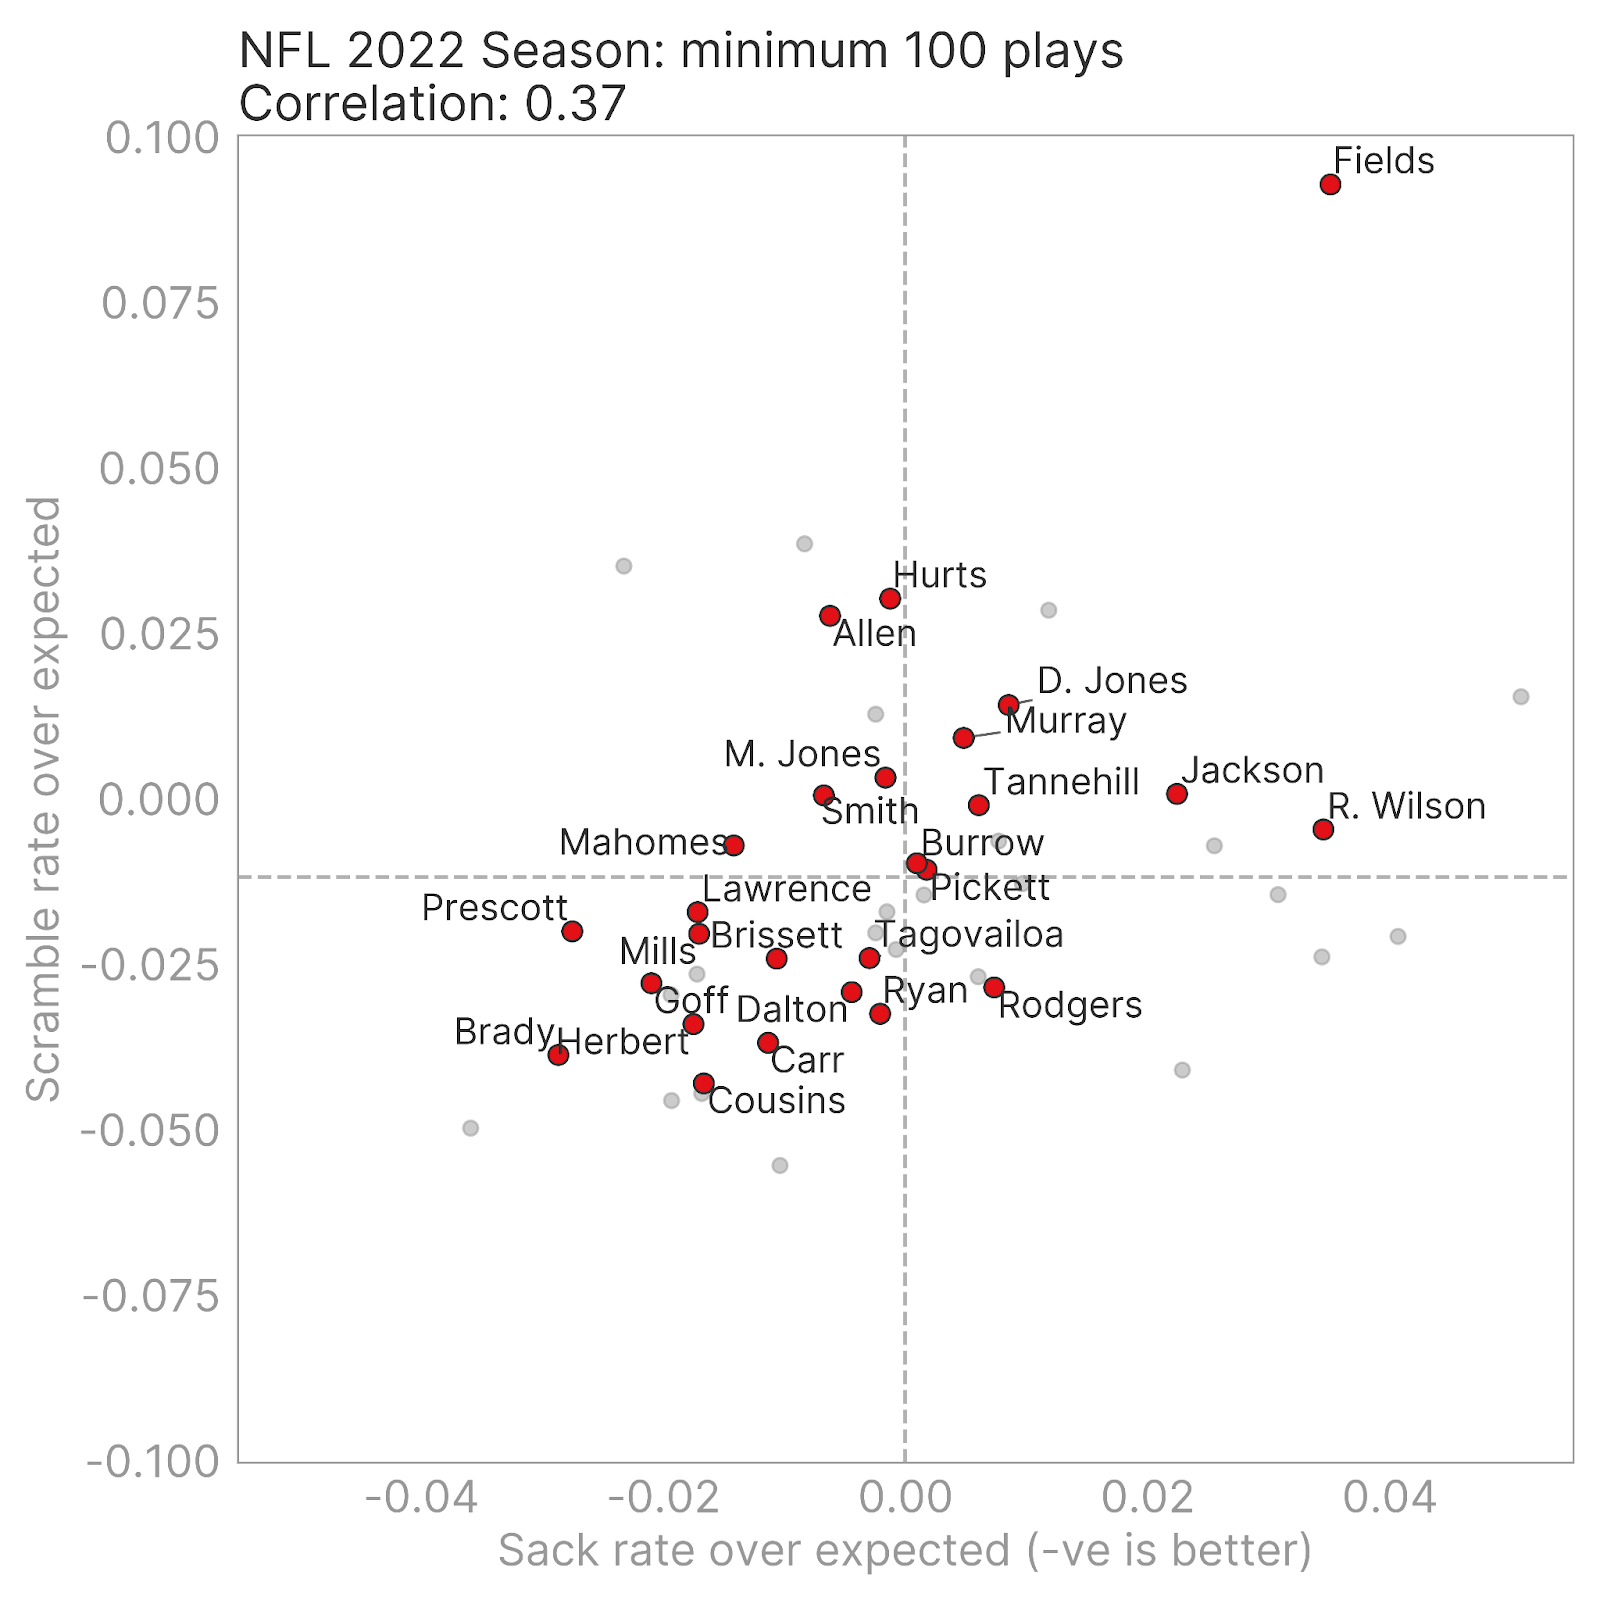
Scramble rate over expected vs sack rate over expected in the NFL 2022 season. QBs with a minimum of 100 plays are shown, with those with over 300 plays highlighted.
While there is a correlation here, it is noticeable that there is more nuance than simply players who scramble more get sacked more. Jalen Hurts and Josh Allen’s scrambling rates don’t come with the same predilection for negative outcomes as their peers.
Returning to our initial motivation, Mahomes doesn't suddenly leap up the completion rankings. Where he does stand out is when examining positive vs negative outcomes - only 3 players in the NFL last season had a positive completion rate over expected and negative sack, interception and incompletion rates over expected while scrambling at an above average rate (Geno Smith and Jalen Hurts being the other 2). This is consistent with Mahomes’ ability to extend plays when necessary and gain positive outcomes whether that's through the air or on the ground.
Conclusion
The above modeling framework is our initial step towards a more rounded framework for profiling and evaluating quarterback performance. The approach still requires further development and factoring the value of outcomes is an obvious next step. We’ll also have further illustrations using our college football data.
Stay tuned for more as we progress our research!
A version of this article was presented as a poster at the 2023 New England Symposium on Statistics in Sports (NESSIS) conference. We thank the organizers for the opportunity to discuss our research with the sports analytics community.
