This article was first featured in our football newsletter. Be the first to see these by subscribing here.
StatsBomb is currently developing its own versions of expected completion percentage, which is designed to estimate how likely a pass is to be caught by a targeted receiver based on a number of contextual factors. Such models have been used previously to calculate Completion Percentage Over Expected (CPOE) metrics in order to evaluate quarterback play.
This necessitates thinking through ways to guide our models with representations of our knowledge of the game - in machine learning parlance, we refer to these as features. Two aspects we know are important to consider are the proximity of defenders to the quarterback and the targeted receiver; all else being equal, passes by a QB in a clean pocket throwing to a wide-open receiver should be completed at a much higher rate than cases where the QB is under pressure from multiple defenders and the catch is contested.
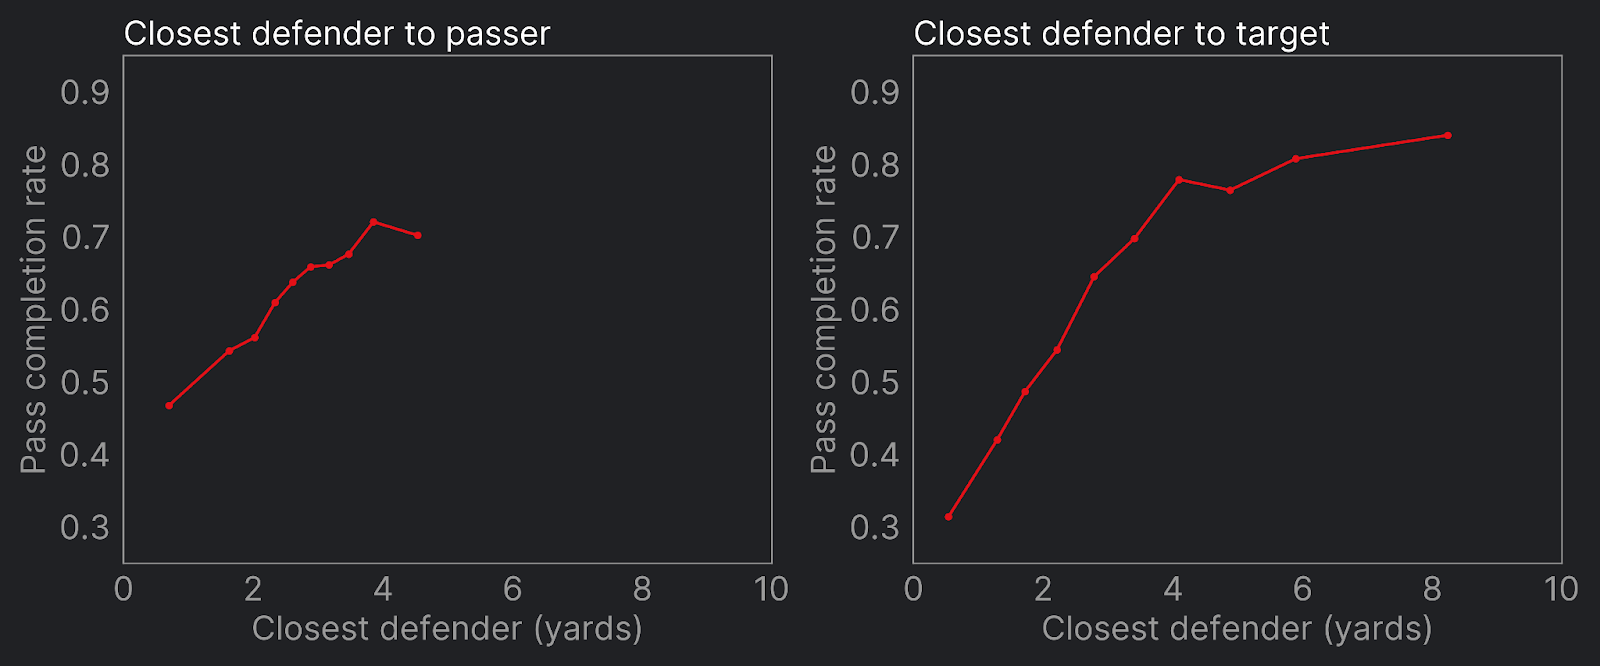
Thanks to the richness of our freeze frame data we have various options to represent this common football wisdom. The simplest and most intuitive is the distance of the closest defender to our QB and receivers. We can see below that this has a strong relationship with completion rate.
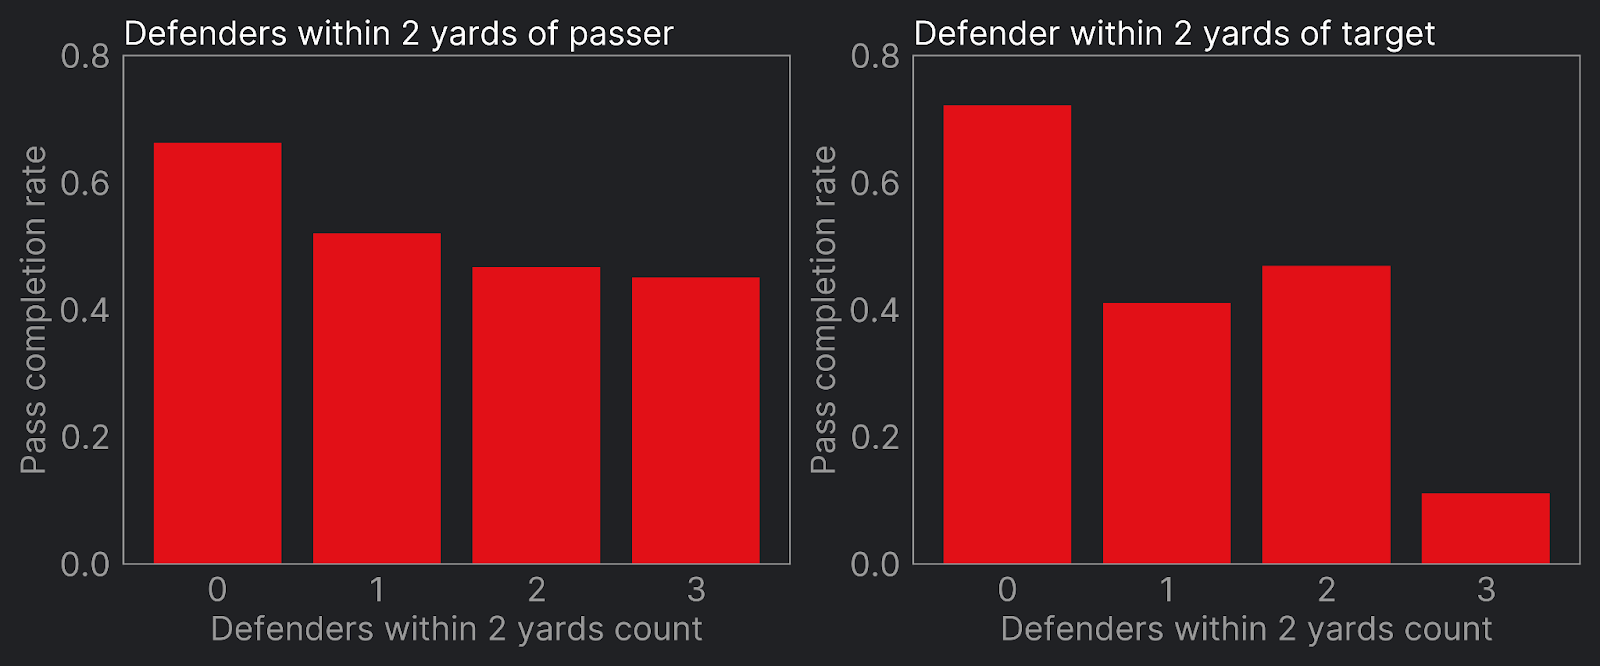
What about instances where multiple players are pressuring the QB or covering our receiver? A simple and intuitive metric could be "number of defenders within 2 yards" of our reference player. Again, we see below that with more players close to the QB, the completion rate decreases. For targeted receivers though, the relationship is less intuitive with completion rates rising when two defenders are in close proximity compared to when one is (this is likely due to the small sample size of such cases, which number only 113 in this sample).
As well as these sample size limitations, our experience constructing similar features for expected goals models in soccer has taught us that such features can be problematic when used in a machine-learning model due to the large step changes that occur as the count increases. For example, the difference between a defender being 1.99 or 2.01 yards away is not going to be particularly impactful on completion rate, nor is it realistic to think our data is that precise. A machine learning model is not going to appreciate that though and we may see significant changes in expected completion rate for individual passes based on fractions of a yard.
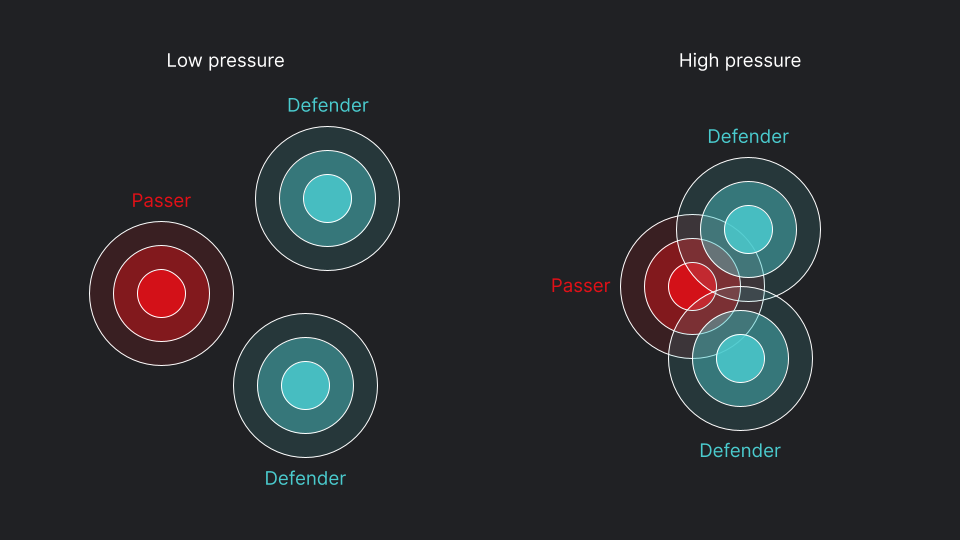
To overcome this, we construct features that are able to smoothly handle such small changes in the data while still preserving the desired information regarding pressure from multiple defenders. We do this by placing a Gaussian distribution around each player location, which sort of acts like a "sphere of influence" that a player can have on those around them.
The degree to which the individual player distributions overlap represents how much "pressure" a player has on another. As illustrated below, two defenders in close proximity to the QB will have significant overlapping distributions, indicating more pressure.
Instead of our discrete steps in the count of defenders within a certain distance threshold, we now have the below smooth relationships that are both more suitable for our machine learning model and a more realistic representation of the precision of our data.
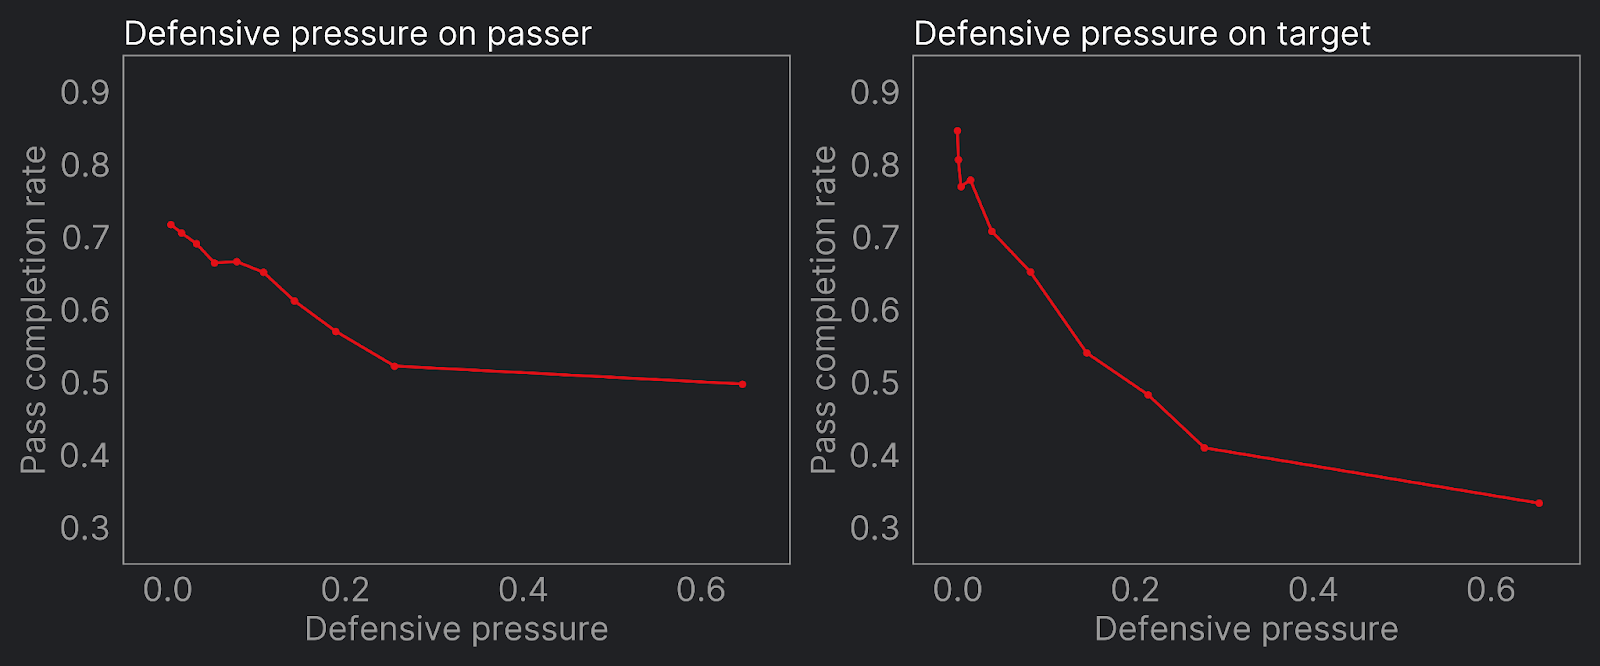
We'll have more on the modelling work in the near future, but our early research suggests these representations are highly significant when it comes to estimating completion percentage.
Dr Will Morgan
Senior Data Scientist
Twitter - @WillTGM
