Yesterday, StatsBomb CEO Ted Knutson introduced our new football data product with a survey of some of the new features and insights we’ve created. Today, Head of Football Analysis Matthew Edwards goes back to the start, and illustrates StatsBomb’s approach to play formations and pre-snap movement.
When digging into a new data set it is easy to get overwhelmed by the sheer array of information. The location of all 22 players at multiple points during each play equates to hundreds of data points to work with just for a single play! So we’re going to break it down piece by piece, and start at the very beginning. As Maria Von Trapp says, that’s a very good place to start.
Every football play starts with pre-snap alignment. StatsBomb Data makes coaches' lives easier in breaking down and analyzing this foundational aspect of the game.
Pre-Snap Alignment
In yesterday’s intro to our data launch (if you haven’t read it yet, do yourself a favor and check it out. And yes, we will get around to deeper dives on everything Ted introduced, don’t worry!), we shared a visual that I want to delve into a little bit more.
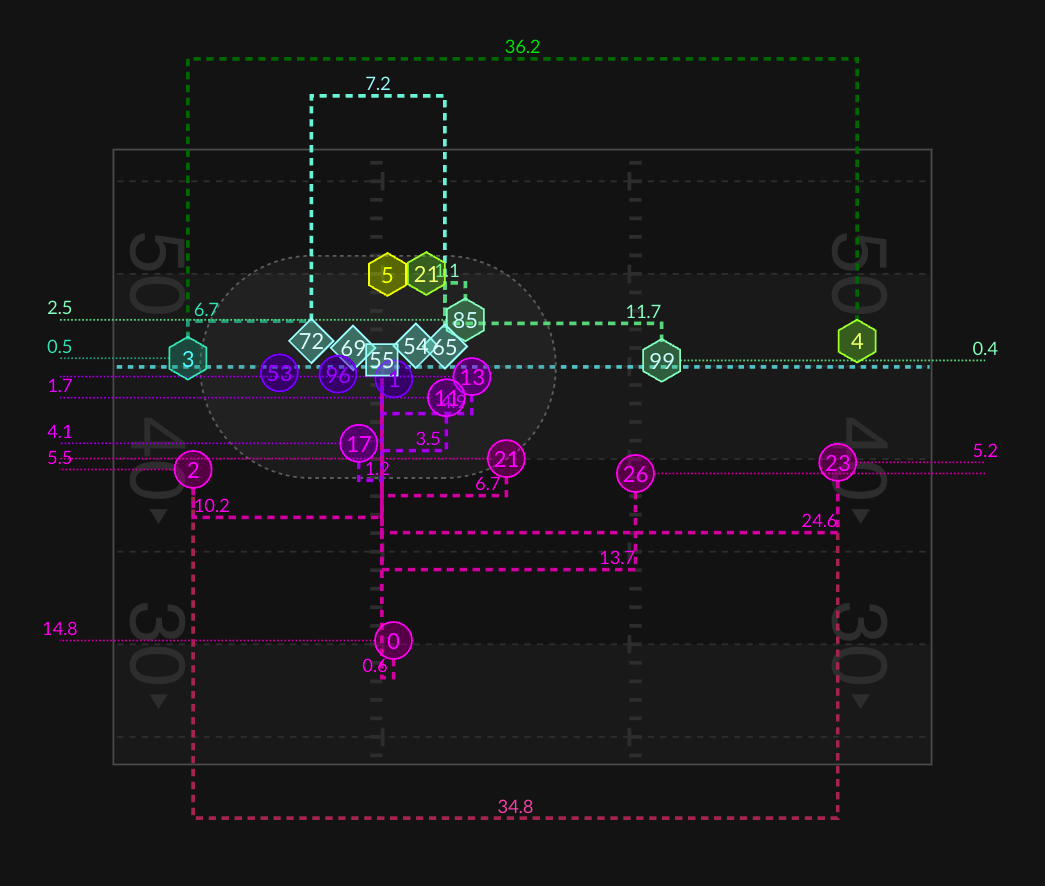
First off, what do we have here?
- Offensive line width - ✅
- Defensive back depth - ✅
- Wide receiver/tight end splits - ✅
- And much, much more...
But the power of analytics is not just in what information you have, but how you utilize it to gain a competitive edge.
So how would a coach/analyst actually use this information? Football is all about matchups (usually 1 on 1’s), and coaches are constantly examining these matchups in the hope of identifying ways to engineer favorable ones for their team. This analysis starts with knowing where each opponent is likely to be on the field.
In the diagram above, #99 is in the slot and #4 is out wide in a 4 by 1 formation. But there are many other questions to answer:
- How does that apex player (#26) line up?
- How are the backers lining up to this formation?
- What is the secondary tilt?
These sorts of inquiries apply to general formation types (2X2, 3X1), personnel groupings, individual player positioning, formation adjustments (tight splits, bunches, stacks), and more. Because we know exactly where on the field everybody is lined up, the potential use cases are limitless.
Pre-Snap Motion
I can’t count the number of times I’ve heard a coach ask something along the lines of: “how does the defense react to motion?” Similar questions include:
- “Does the secondary run with the motion, or do the safeties spoke?”
- “Do the backers bump with quick motion?”
- “What about motion behind the quarterback?”
Our data set includes the answers to those questions and more. Our pre-snap event collection allows us to see exactly how the defense reacts to motion. The animation below illustrates one such case, with the secondary adjusting as #18 goes across the formation, creating a bunch alignment. You can see the safeties spoke, as well as the adjustment from defending a stack alignment to defending a bunch set.
Snap Distribution
We talked earlier about how football is a game of 1 on 1 matchups, and these matchups are often decided by tendencies. Aaron Donald was recently on the I Am Athlete podcast talking about watching film. He studies hours of film to identify tendencies of the opponents he’s going up against. While of course film study will remain an invaluable part of game prep, removing the need for a player or coach to “fancy count” the actions which make up tendencies allows that study time to be spent more productively.
Our snap alignment data and tools do just that. The chart below shows the alignment at snap of one player for every play where he was on the field in the 2021 season. From left to right, the chart shows the player’s alignment at snap:
- On all plays regardless of snap location
- Left hash snaps
- Center left snaps
- Center right snaps
- Right hash snaps
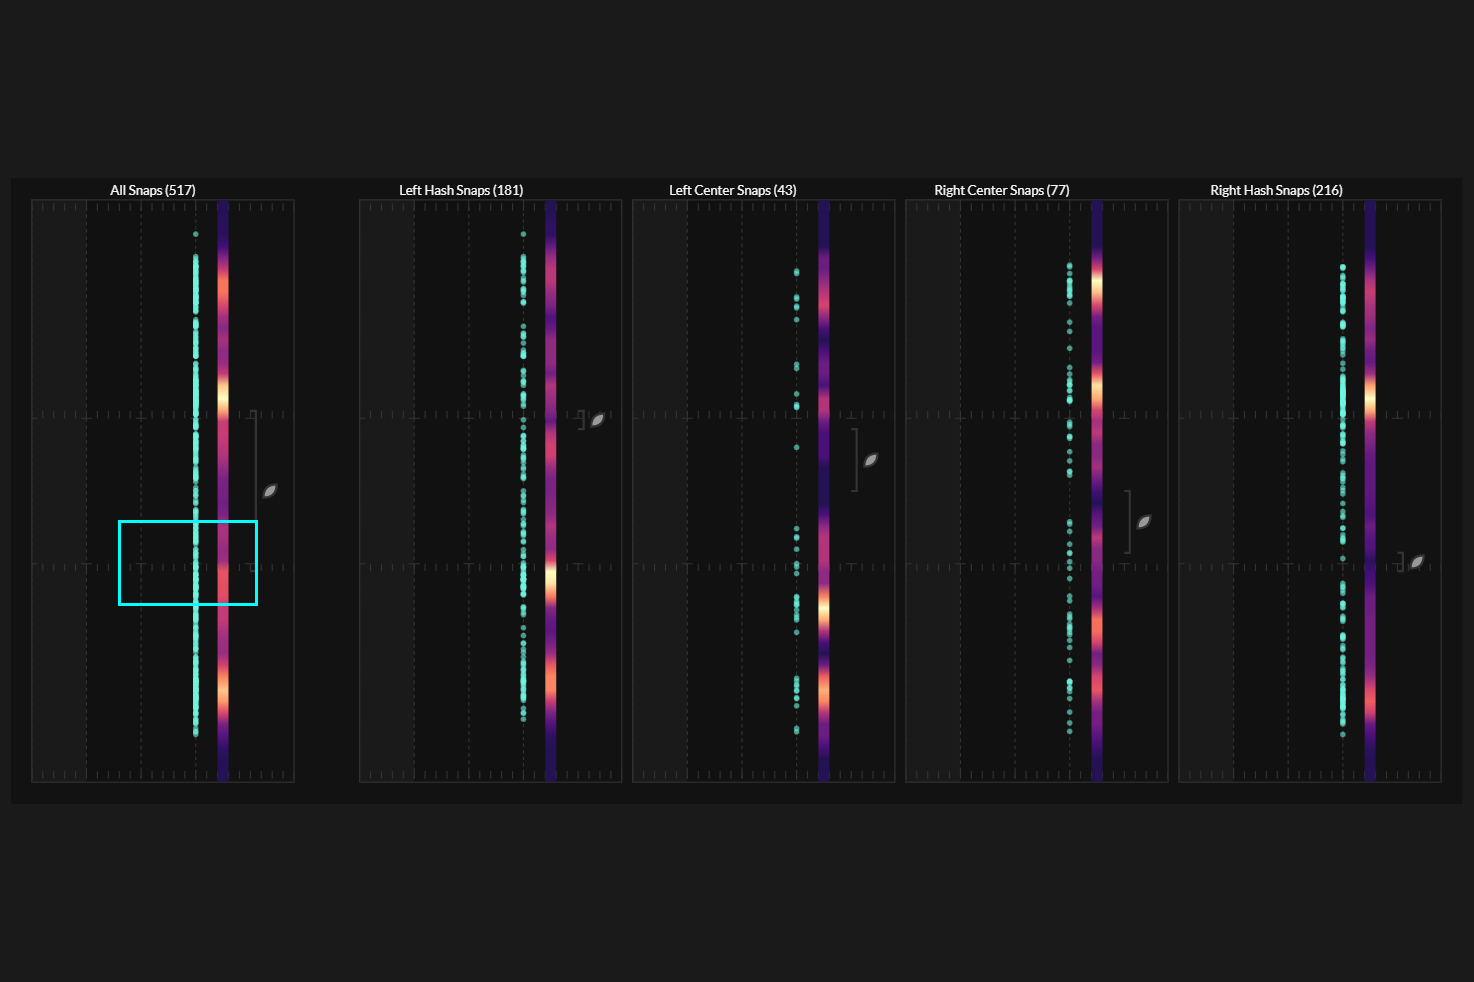
From there, plays can be filtered by further variables such as down and distance, run or pass, explosive gains, or field position (e.g. goal line or red zone) to further break down offensive tendencies linked to the player's alignment.
In examining the data, we discovered that one particular offense had some degree of a tell based on where the tight end lined up. A savvy coaching staff could easily utilize this information to structure their game plan against this offense.
Routes Tendencies
Giving defenders a better read on the routes a receiver is likely to run on a certain play is a huge edge to the defense. The next level of use of our snap alignment data is examining what players do when lined up in a specific area on the field.
If we resurface the previous diagram, you can see that we have used a blue rectangle to highlight a specific zone.
We can filter down to the plays where the opposing receiver lined up in that zone and visualize the routes a receiver most frequently runs from that part of the field. Not just posts or corners, slant or dig, but the actual path of each route. So it is not just a post, it’s a 12-yard post with a slight fake to the corner. It’s not just a dig, it’s an outside release, push vertical 10 yards, hard cut dig.
The diagram below illustrates the routes run from the snaps selected. Orange lines show routes on which the receiver was the target of the pass, blue lines are other routes while purple lines represent the paths taken on running plays.

This particular receiver was targeted 5-10 yards predominantly and doesn’t push vertically very often. A safety or linebacker could know to be more aggressive in coverage against this player based on the lack of deep threat.
One of the best feelings in football is spending hours studying an opponent, learning what they will do, building a gameplan around their tendencies, and then exploiting those tendencies on gameday. Helping teams see it all come together on the field in this way is why we spent so much time and effort creating the deepest data set on the market.
Matthew Edwards
Head of American Football Analysis, StatsBomb
matt.edwards@statsbomb.com
@thecoachedwards on Twitter
