Special Teams Coordinator (STC) is one of the hardest jobs in college football, as special teams are treated as anything but. There are 11 full-time coaches per staff allowable by NCAA rules. Most teams do not choose to dedicate one of those 11 to special teams full-time. Rather STC’s often have special teams added to their responsibilities as a position coach.
Thus, many STC's are in charge of preparing as many as six separate units for game day; their primary position group alongside each phase of special teams play. The Punt, Punt Return, Kickoff, Kickoff Return, and FG/XP units each have different schemes, gameplans, practice drills, and so on! On top of all this, special teams data has traditionally been worse than that of any other aspect of football.
StatBomb data can help right that imbalance. Let’s look out how it can help STC’s coach and evaluate the “core 4” special teams units.
Punt
One of my favorite things about football is its schematic diversity. The same game can be played in so many different ways. Triple option vs air raid, 3-3-5 zone blitz vs 4-3 cover 1. I prefer college football to the NFL in large part because of the wider variability in schemes across NCAA play.
An understudied area of variability is special teams. For example, punt units have tremendous variability between teams. Pro style vs spread and traditional kick vs rugby are just a few of the differences we see from team to team. StatsBomb data can tell us more about punters than any other data currently available.
The Ray Guy award is given annually to the best punter in the country. This past year the finalists were Adam Korsak from Rutgers, Bryce Baringer from Michigan State, and Mason Fletcher from Cincinnati with Korsak taking home the hardware. Each of the three punters had slightly different punting style. The chart below helps indentify those differences. The dots are the location of where the ball was kicked, with the bottom middle of the graph being where the punter caught the snap. The size of the dot represents the operation time. Baringer was the most consistent with his movement and timing. Whereas, Rutgers utilized a rugby style punting attack and Korsak punted from all over the place. The data makes this all clear right away, before watching any film!
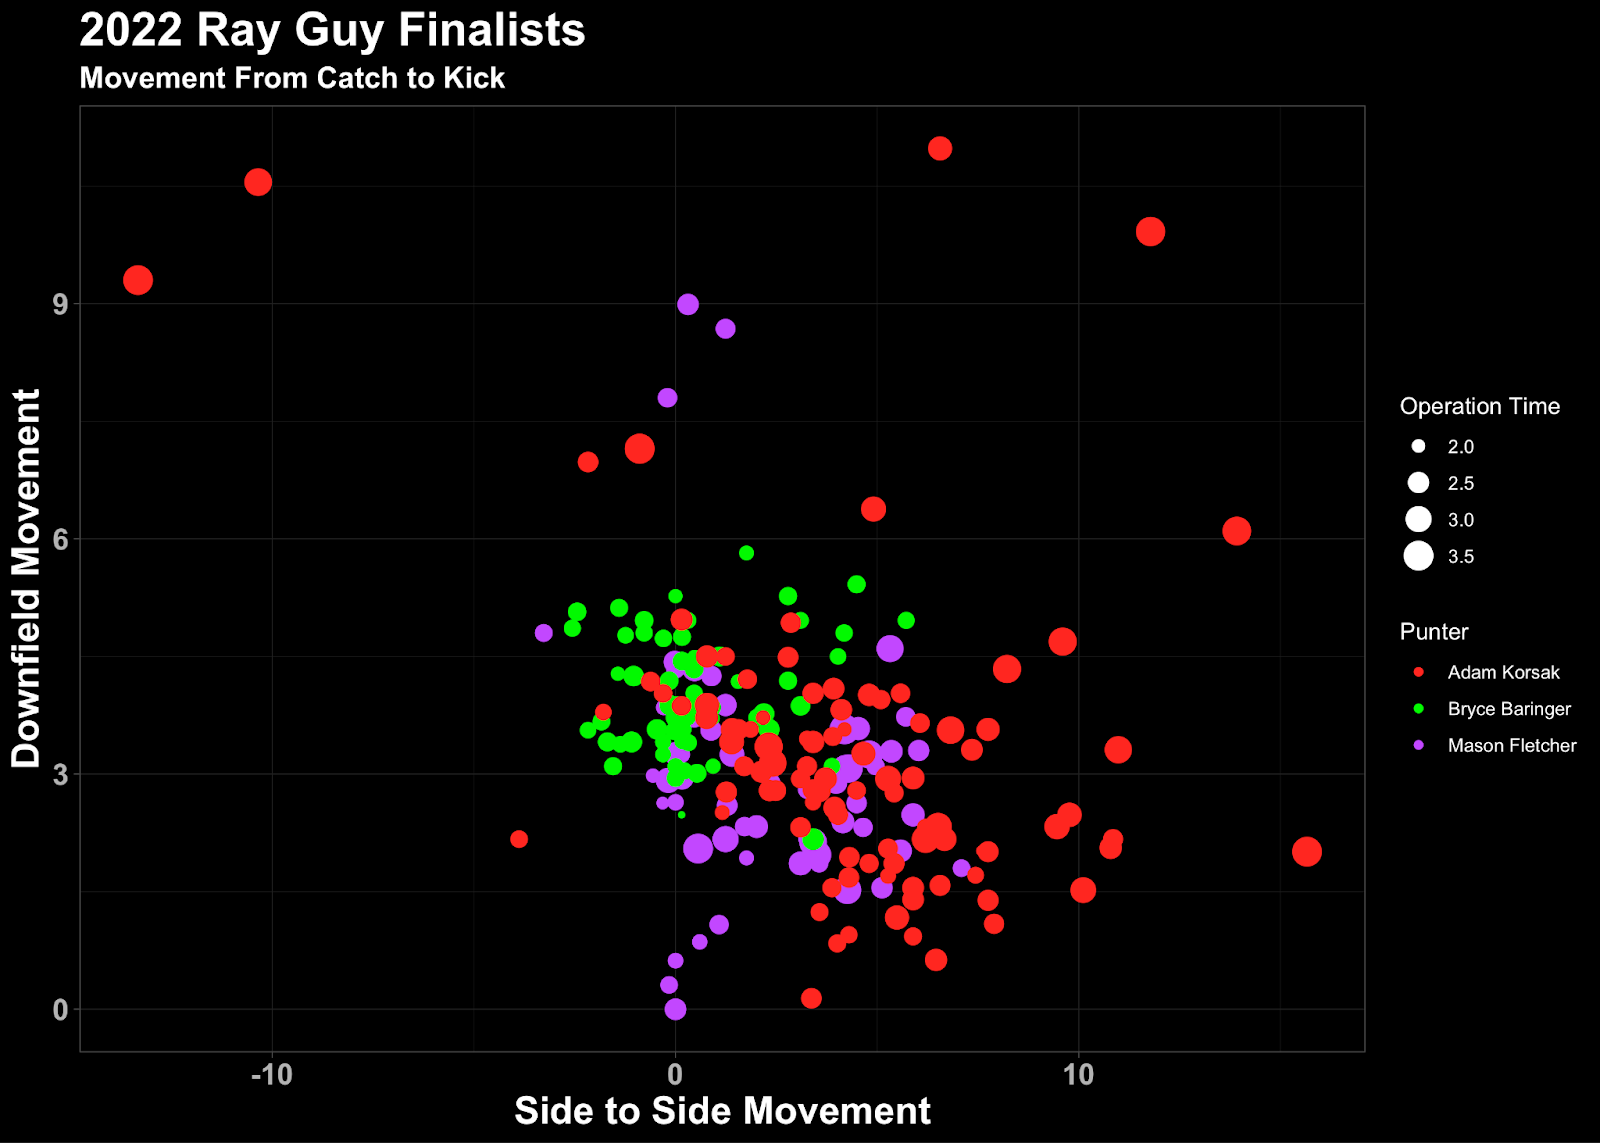
A major benefit of rugby style punting is the moving block point. It makes it difficult for a punt return unit to have a specified place they are trying to attack. The chart above illustrates this, as Baringer’s dots are all clustered in a similar spot while Korsak’s are spread out in a wider area.
Punt Return
The best trait for a punt returner is not speed, quickness, the ability to break tackles, or anything else. Rather, the most important thing for a punt returner is simply to catch the punt. This trait is important in two main areas: avoiding muffed returns and not letting the ball bounce.
One way to look at muffed returns is as a turnover. Muffed punt returns are considered turnovers in the stat book because the return team is in possession of the ball for the briefest sliver of time before the ball is dropped and the punting team recovers it. Everybody knows the importance of winning the turnover battle, and special teams turnovers count just as much as defensive turnovers forced. Another way you can look at a muffed punt is as a giant play for the punting team. A 40 yard gain on 4th down would definitely count as an explosive play. Whichever way you look at it, muffed punts are a huge deal.
The other situation where sure handed punt returners show up is in not allowing any roll yardage by catching all punts on the fly. A punt that lands without a returner catching it rolls over 5.5 yards on average!! 5.5 yards is no joke. If you added 5.5 yards to USC’s punt return team they would move from 100th into the top 25 in punt return average.
Kickoff
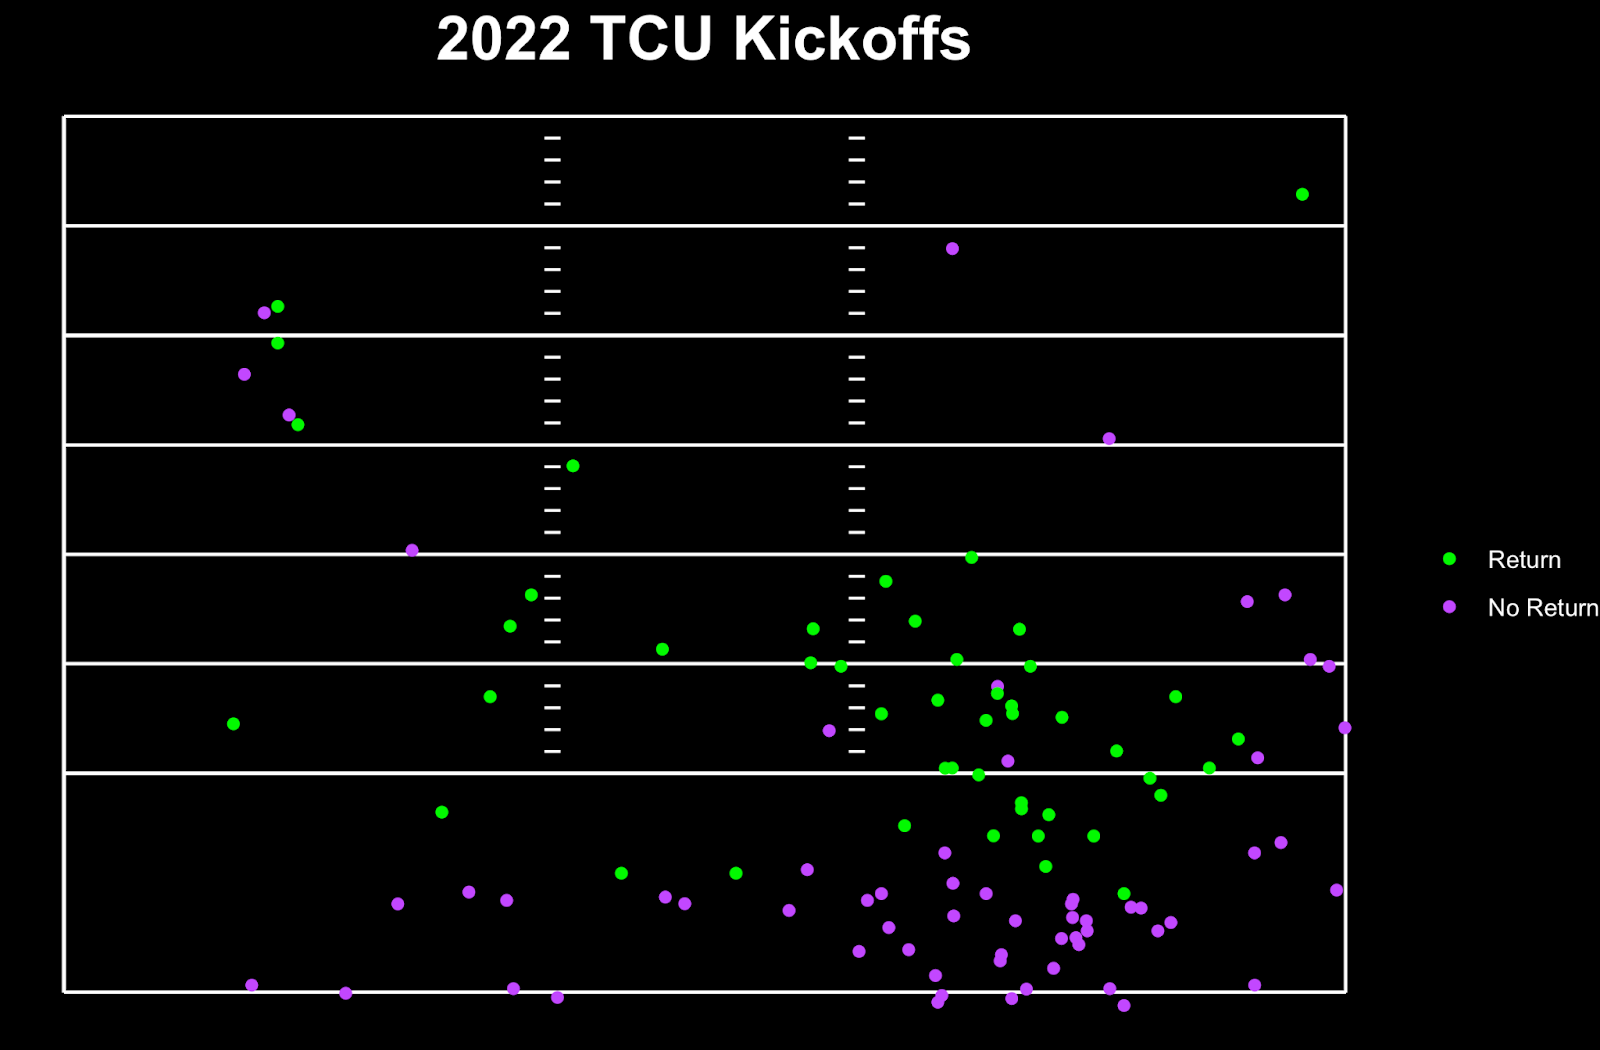
With our eventing data, we collect the landing point of every kickoff. We can use this data to analyze how teams kick and cover. Let’s take a look at two examples from last season, TCU and Tennessee. TCU had one of the worst kickoff cover units (when asked to actually cover) in college football last season, giving up almost 23 yards per return. The plot below shows a consistent landing spot between the hash and the numbers. The kicks that fell short of the end zone were often returned, with the kicks that landed in the end zone returned at a much smaller rate.
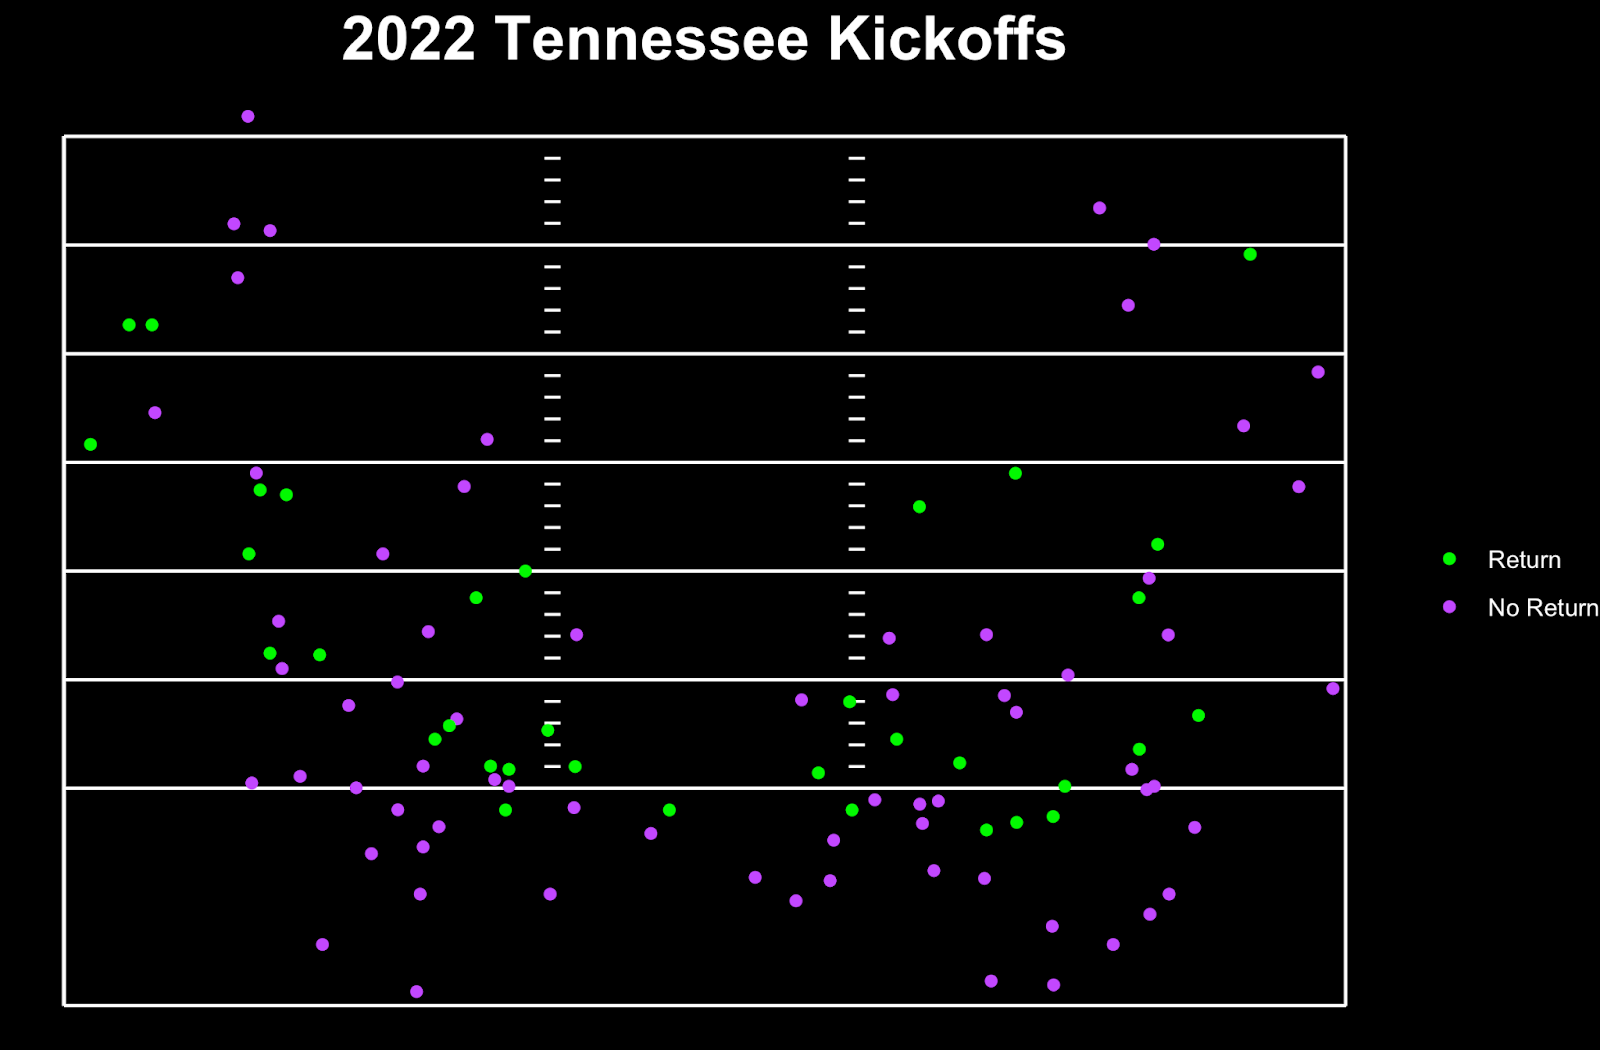
Tennessee however had a much better kickoff cover unit when asked to cover allowing only 17 yards per return. They also had a much different approach to kickoffs than TCU did. Tennessee’s kicks have an interesting mirror image on both sides of the hash. With kickoffs landing consistently anywhere from the endzone, to about the 20 yard line. With such a limited amount of practice time each week, it is hard for opposing kick return team units to prepare for each style of kick: pooch kicks landing at the 15 yard line, deep kicks, kicks to the left, kicks to the right. And that doesn’t take into account what Tennessee was doing switching up player paths and safeties.
Kickoff Return
To return or not to return? That is the question facing the kick returner. In 2018, the NCAA implemented a rule change that allowed the kickoff return team the ability to fair catch the ball anywhere inside the 25 yard line and start the possession at the 25 yard line. This rule change was intended to reduce injuries, but it had a (*potentially) unintended consequence in how coaches can scheme up kickoffs and kickoff returns. The NFL has followed suit and is introducing this same rule for the upcoming 2023 season. NFL Teams should look at the data from NCAA games to get a feel for how this rule impacted kick returns the past few seasons.
Unless you have Devin Hester returning Kickoffs, it is usually not a good idea to return kicks that land deep in the end zone. But as the ball gets closer to the goal line (and even into the field of play with the new rule) it gets to be a trickier judgment call. StatsBomb data suggests taking the ball at the 25 is better than trying to return it out of the end zone. In 2022, the average starting field position for returns from the end zone was over 1.5 yards worse than just taking the ball at the 25. This adds up to about 10 yards per game, and over 100 yards per season. Not to mention the fewer injuries that come with just fair catching the ball, or potential turnovers from the returner. On average, kicks landing inside the 5 yard are still better fair caught and taken at the 25 than trying for a return.
The analysis gets more interesting on balls landing between the 5 and 10 yard line, while kicks taken outside the 10 are usually better returned than fair caught. In the NFL, kickers consistently kick it into the end zone (or through the end zone and even the uprights, I see you Justin Tucker!) so return teams will not have many opportunities to catch the ball in an advantageous situation for a return.
Better Data = Better Information = Better Schemes
Our job at StatsBomb is to provide people with the best data on the planet, and to build the best tooling on top of that data. Our special teams version 1.0 data is the best in the world, and version 2.0 will be even better. Punt team snap alignments, punt gunners paths, kickoff team paths, punt cover team halos around the returner, kickoff cover waves at the time of catch, and much more. Special teams will finally have data that lives up to its name: Special.
Matthew Edwards
Head of American Football Analysis
@thecoachedwards
