Last month, we released two entire seasons of free NFL data in the first part of the Tom Brady Data Biography. If you missed the release, check out the article that Ted Knutson put together introducing the project! We had a great response, and loved to see the interest the free data garnered.
Today, we are releasing something even more exciting! Two seasons of tracking data, for free.
That’s right. Two FULL SEASONS worth of TRACKING DATA!!!
We have now released two seasons of play by play, event, and 30 frames per second tracking data, free of charge, for the public to do anything they want with (certain Terms and Conditions apply).
A huge shout out to the AI and collection teams in StatsBomb. This was a huge undertaking as a company, and our team has been hard at work developing workflows, software, and so much more to make this a reality.
Tracking Data
So let’s talk about tracking data. What is it? Tracking data is locational data of the players on the field (pitch, court, rink, etc) at some set interval. This can be gathered by player wearables, or from some form of video. NFL NGS data comes from player wearables in the shoulder pads and football and has a frequency of 10 times per second. Second Spectrum data in the NBA uses video and is 25 times per second. Our tracking data is collected from video, and gives the locations at 30 times per second.
Why is tracking data so important? Using traditional play by play data, analysts can analyze what happened as a result of the play. Expected points added, win probability added, and other outcome based models are the result. Tracking data lets analysts analyze things that happen during the play, not just the outcome of the play. Things like physical metrics (speed, acceleration, etc), “live” models of pass completion or yards per rush, and much much more. The possibilities are seemingly endless!
Data Access
Similar to the initial release, we are hosting all of the data on our GitHub page (if you don’t already have the page bookmarked, you’re going to want to do that!). Currently on that page you can access play by play, event, low frequency tracking, and full frame by frame tracking data for the Tampa Bay Buccaneers during the 2021 and 2022 seasons. Importantly, there are also R and Python tutorials for parsing through the data to create different plots, graphs, etc, as well as access to the data specifications to help you navigate it.
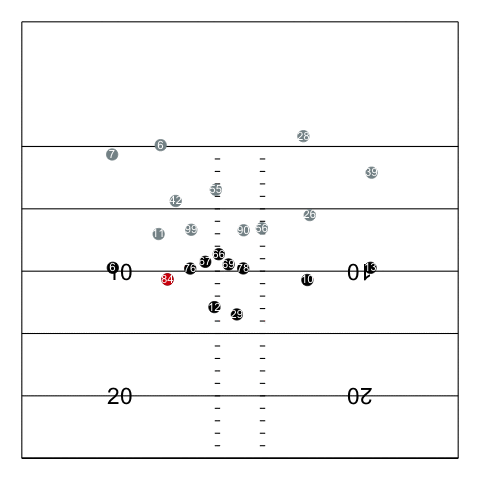
These tutorials will walk you through how to read the JSON files, parse the files to get the data in a useable format, and how to plot a play. The example below is Tom Brady’s last ever TD pass, to TE Cameron Brate.
Conclusion
One of the best things in the sports analytics world is the NFL Big Data Bowl. I love seeing all the amazing projects that are done, and all the hard work that goes into the projects each year. A lot of the work done on those projects makes it into NFL broadcasts, the Prime Vision with Next Gen Stats Thursday Night football broadcasts, and participants have been hired repeatedly by NFL teams. With releasing not only our own x and y coordinates, but the NGS x and y coordinates as well, we hope that people who have done previous work with the NFL NGS data can use this dataset to further their own work. With our release of full seasons of data, we are hopeful to be a small part of the wonderful world of public football analytics.
