If the term pocket quarterback was in the dictionary, the definition would just say “see Tom Brady”. If pocket quarterback was on Urban Dictionary, it would say “see Tom Brady” and then also include a link to his pre-draft Combine 40 yard dash and photos. No shade at the greatest to ever play the position, but he was not scaring anyone with his running abilities, especially toward the tail end of his career. He did the majority of his damage from the pocket.
It’s unclear where the term “pocket” originated, but it is used to describe the area that the offensive linemen create while trying to protect the QB. There are a lot of ways the pocket is used in analysis of the game. For example, time spent in the pocket for a quarterback. Where a QB leaves when he escapes the pocket. Stats from throws outside the pocket to the left and right. And many more. But never has the actual pocket been analyzed. Using StatsBomb line engagements data, we are able to finally dive into pocket analysis.
Data
First, let’s talk about what we are looking at. Using the Tom Brady events dataset, we are able to get data on every block that happens inside the box. This data includes which players are involved in the block, where on the field the block starts and stops, when the block starts and stops, as well as information on double teams, etc. This level of information is not available ANYWHERE ELSE!! Let that sink in. Truly unique data can lead to truly unique analysis, and that is exciting!
Using these engagements we can take the first block that a lineman does for every pass play, and build a map for what the pocket actually looks like.
Individual Play
Let’s start with what an individual play looks like. Here are two pass plays with the pocket mapped out. The location at the snap is the orange dot, while the red dot is the location of the first engagement. The dotted arrow is there to help make it easier to tell which dot is tied to which player.
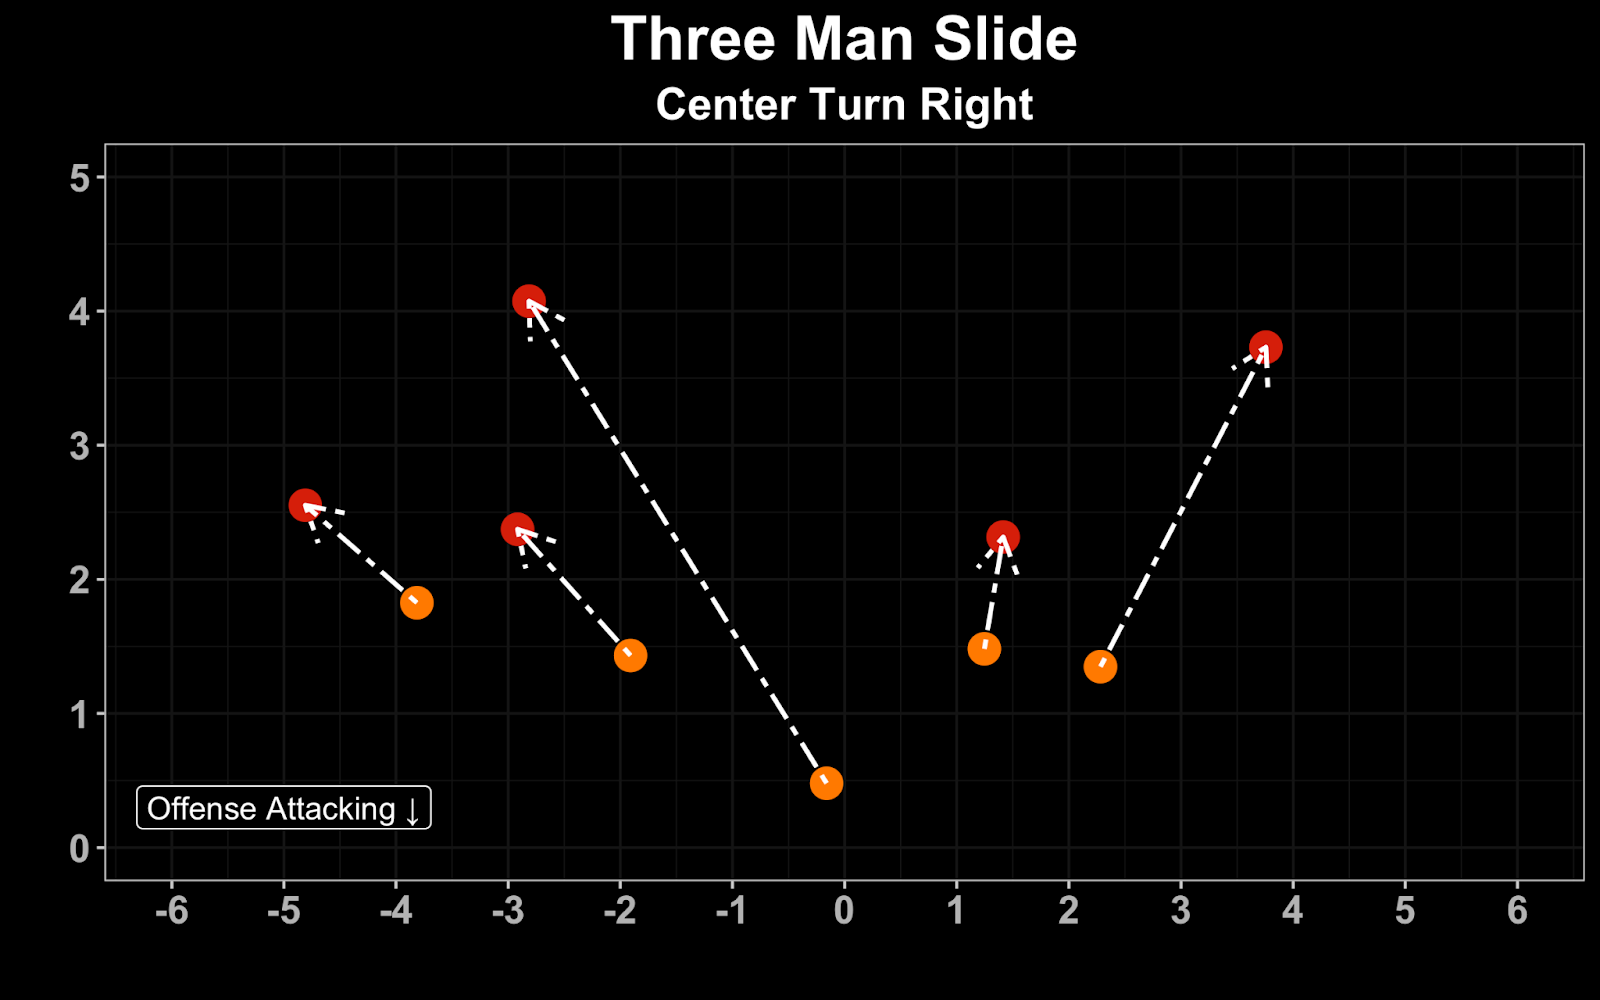
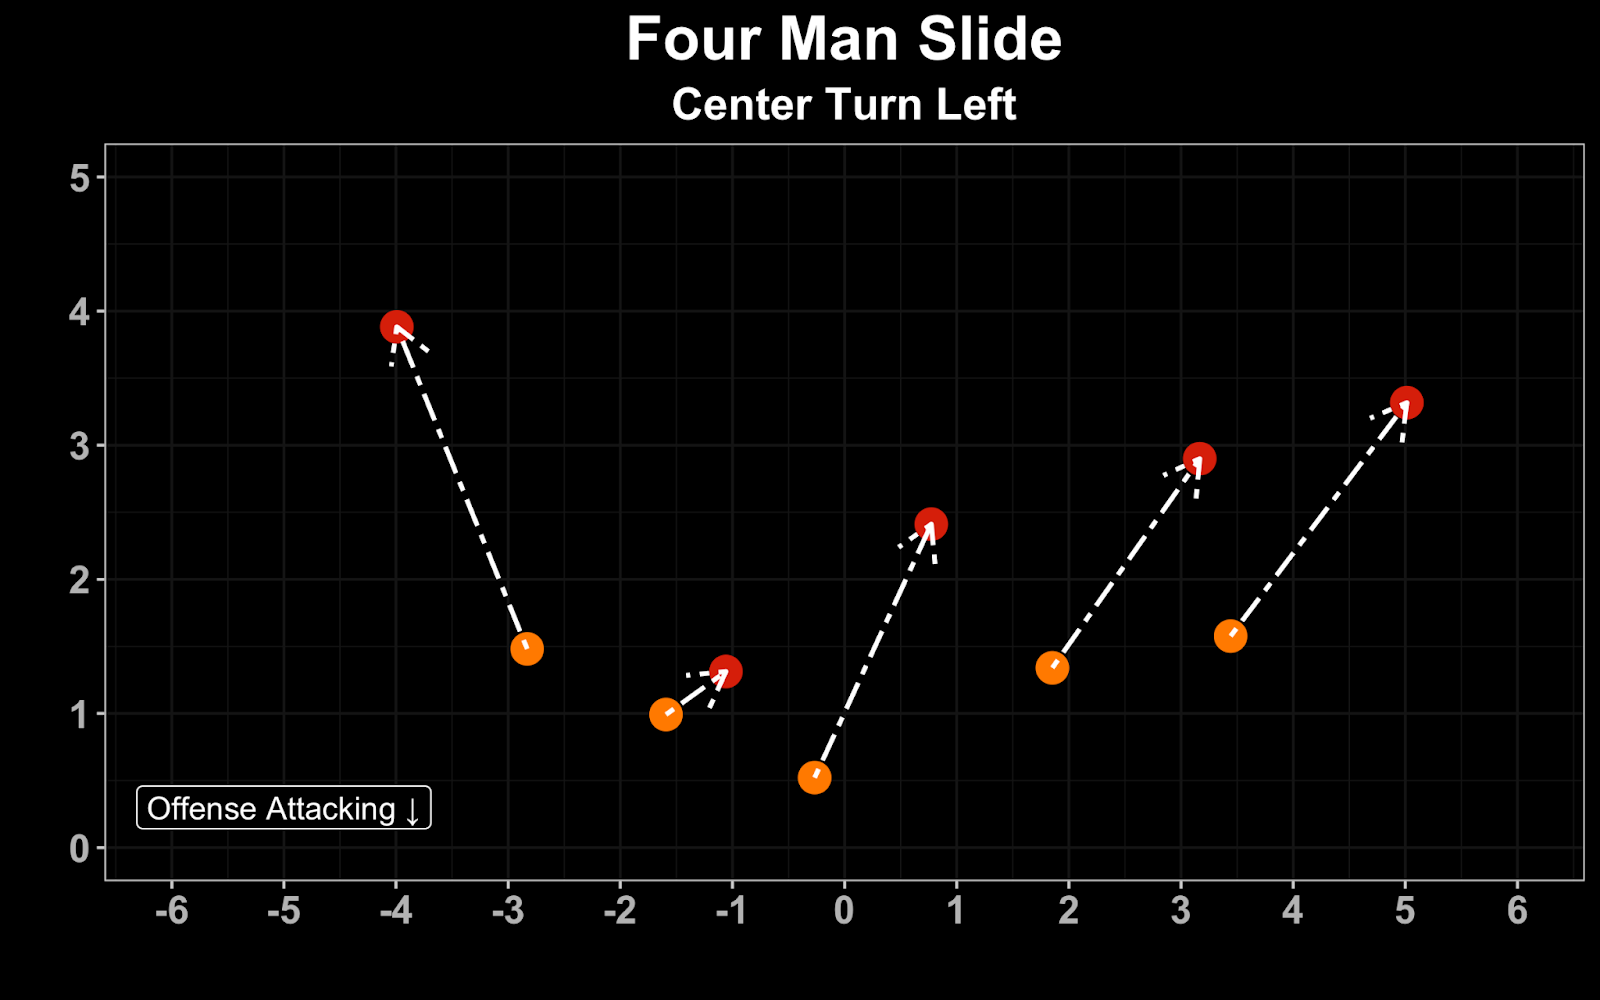
With this data we can start to classify information about the individual blocking schemes. The top play is a three man slide with the center turning to his right. And the bottom play is a four man slide with the center turning to his left. With this data you get the following data points for each pass:
- Movement of offensive lineman in pass protection
- Information on twists and stunts of defensive players (based off initial alignment, where the player ends up getting engaged)
- Center turn movement
- Scheme of protection (3 man slide, 4 man slide)
This information can be used by defenses to create a game plan with blitzes designed to attack center turn, or the number of blockers used in the slide side of the protection. This information was used in one of the finalist papers for the NFL Big Data Bowl competition this past season. Dom Borsani, the man behind this project, was immediately gobbled up by the Browns, further showing how useful this type of analysis is.
Single Game
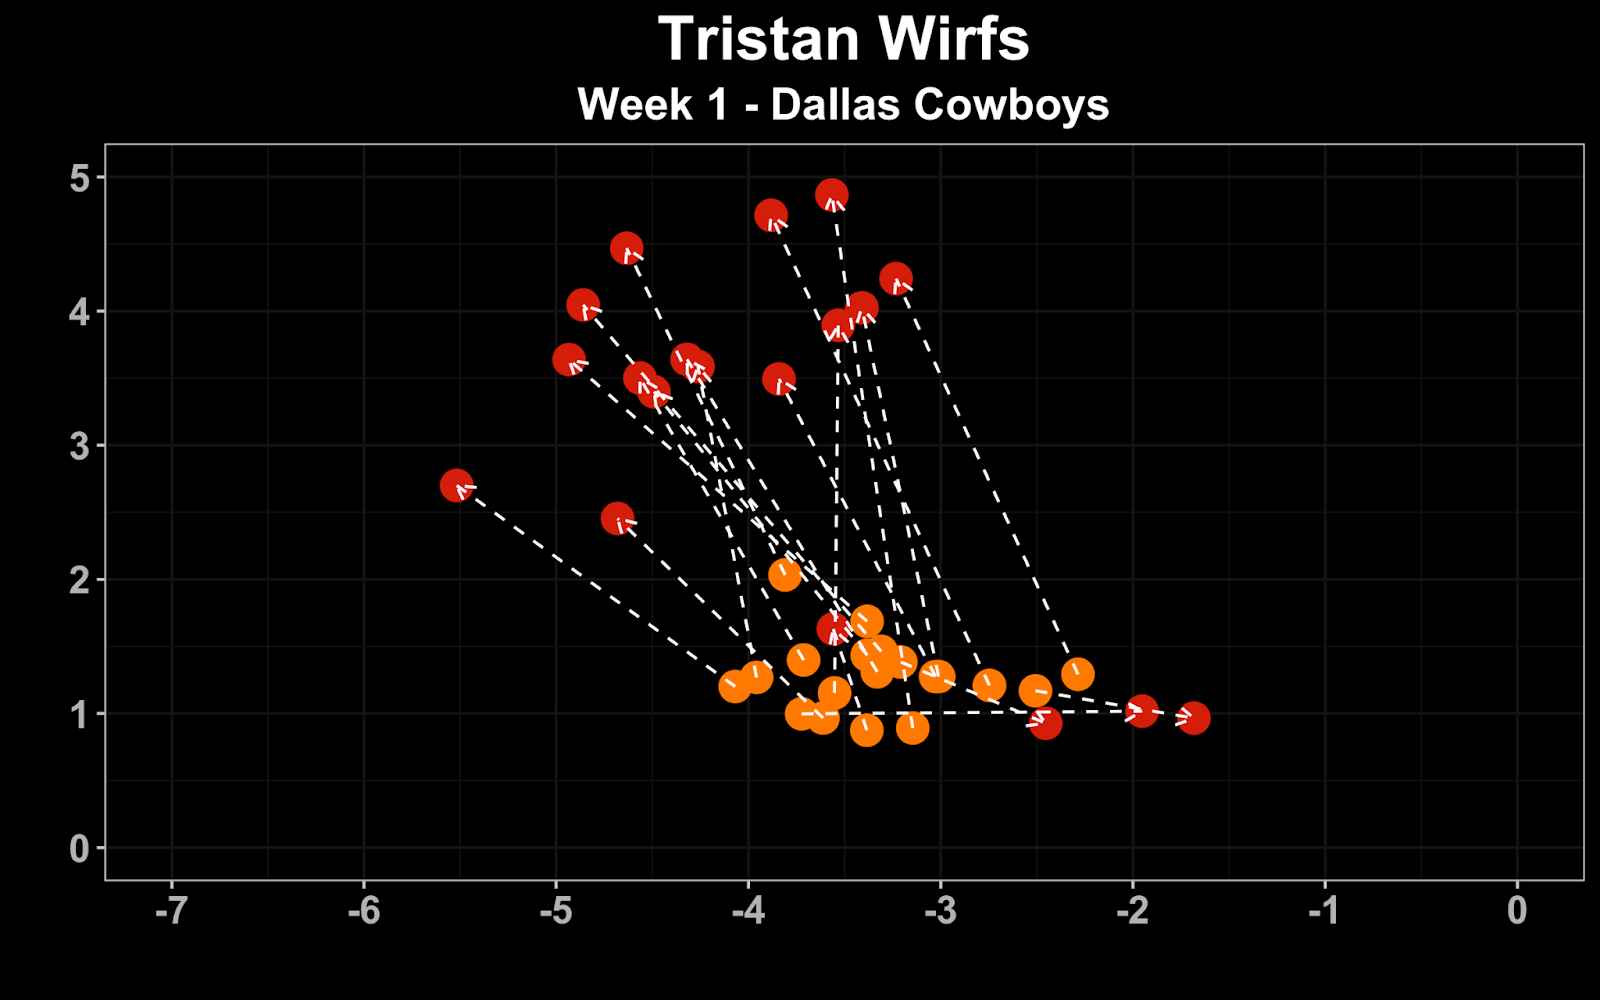
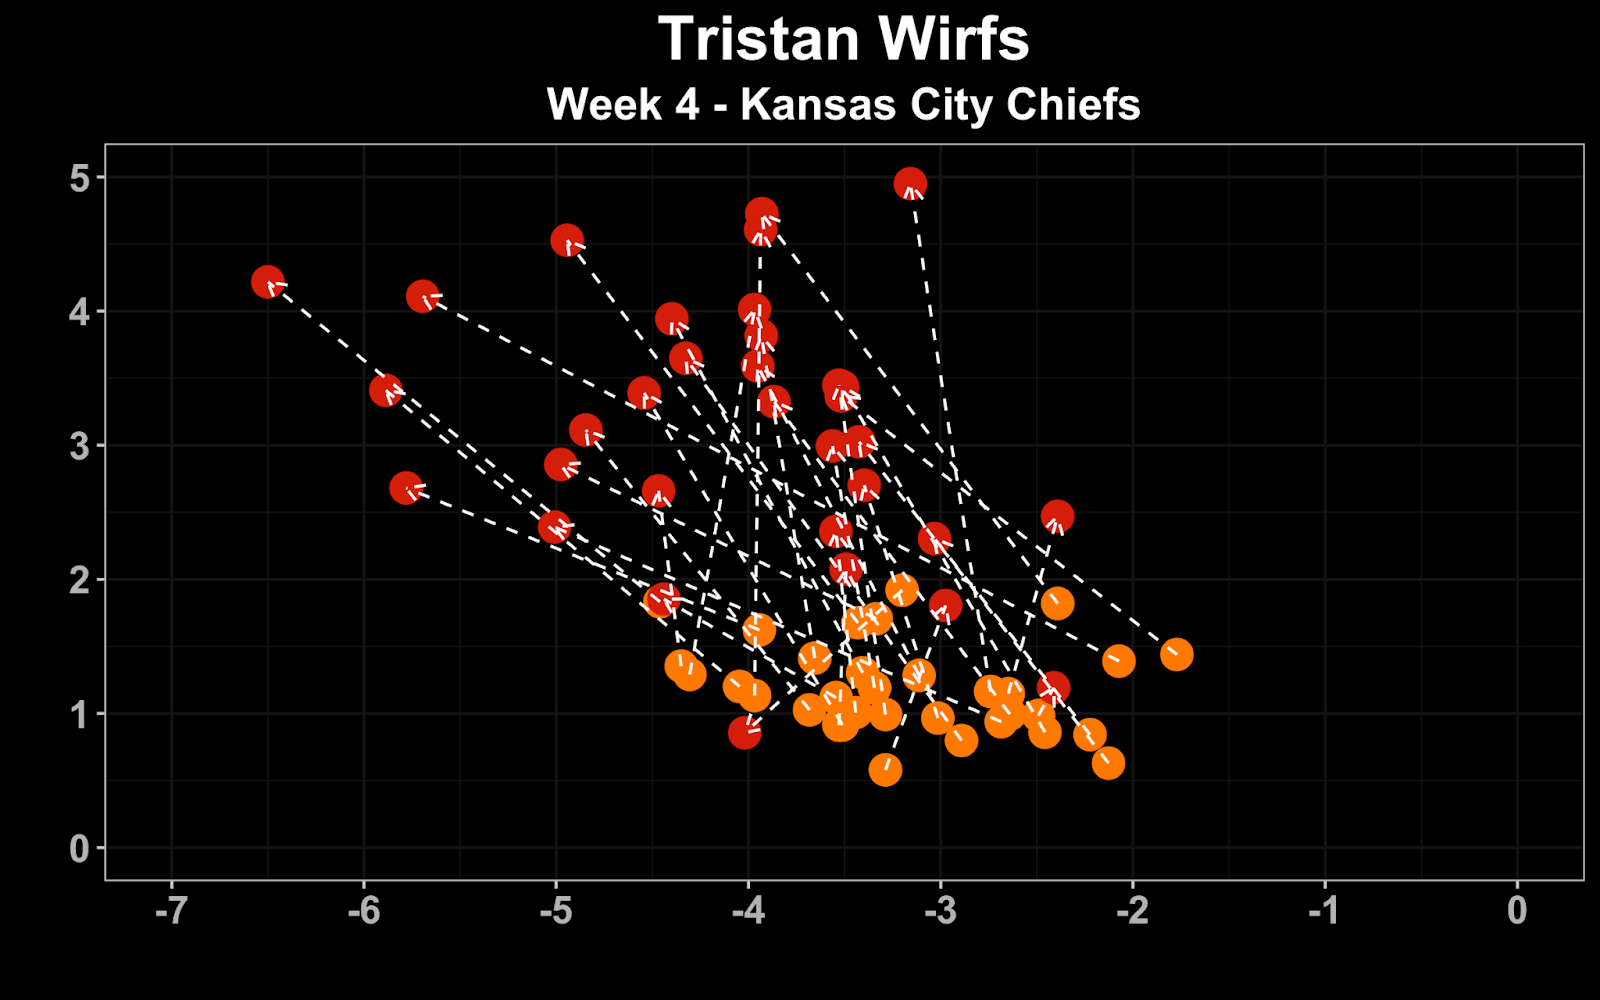
The next bit of analysis uses the engagements to look at game by game breakdowns and tendencies. This can help answer questions like does a player change his kick step, or angles based on the opponent? Using Tristan Wirfs as an example, I looked at his snap location and initial engagement location for two games last season. The first game is week 1 against the Dallas Cowboys (and Micah Parsons). The other game was the week 4 matchup against the Super Bowl Champion (and every Swifties favorite team) Kansas City Chiefs.
In the week 1 matchup, Wirfs only blocked Micah Parsons on two occasions, and those two engagements were two of his three deepest kicksteps for that game. With Parsons’ speed, Wirfs knew he had to get depth or Parsons would run right around him. Wirfs also had more engagements as part of a full slide away from him than in any other week that season (as part of a scheme decision to target Parsons with the protection on the opposite side).
In Wirfs matchup against the Chiefs he had to kick extra wide to make sure he got in position to block wide rusher Frank Clark. He had a much different matchup, which required Wirfs to get into a different position to block the defender.
Season Breakdown
The next level of analysis is at the season level. The 2022 Buccaneers had one of the best pass protecting offensive lines in the NFL. Using our proprietary pressure metric (which takes into account things like distance from the QB, time spent in that area, and if they are being blocked or not) the Buccaneers lead the league in lowest pressure % allowed at 12.1%. On the other hand, the New York Giants had the third highest pressure %’s at 25.9%. Let’s dive into what their pockets look like, and see if their pocket shape can tell us anything about their pressures allowed.
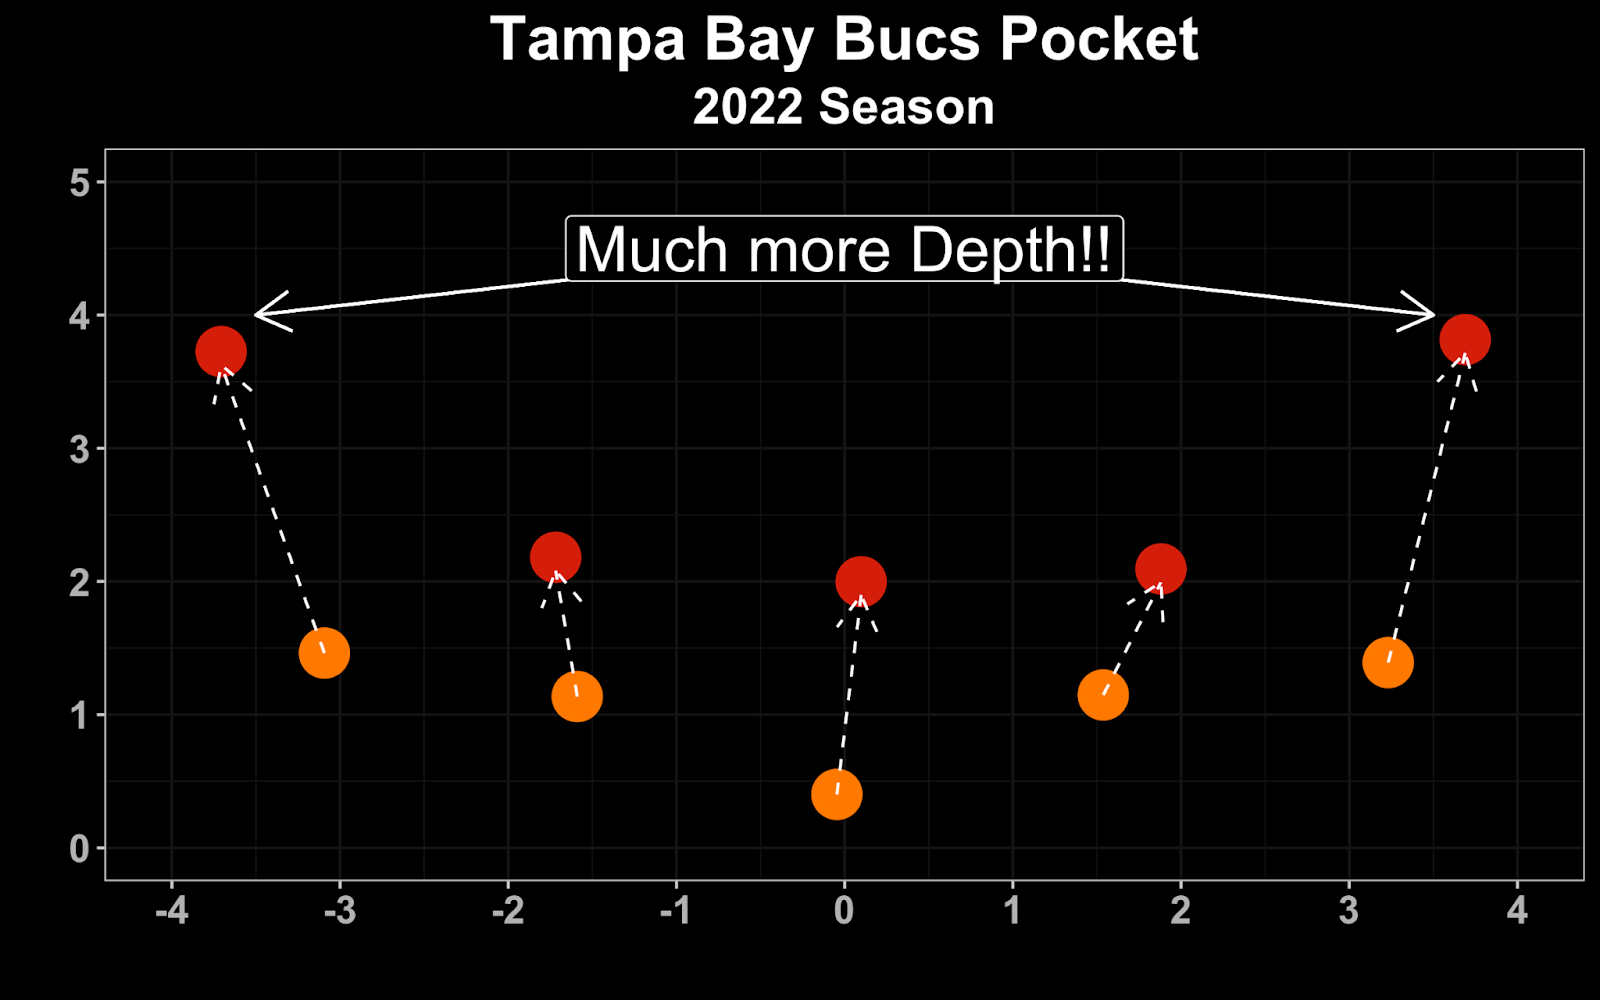
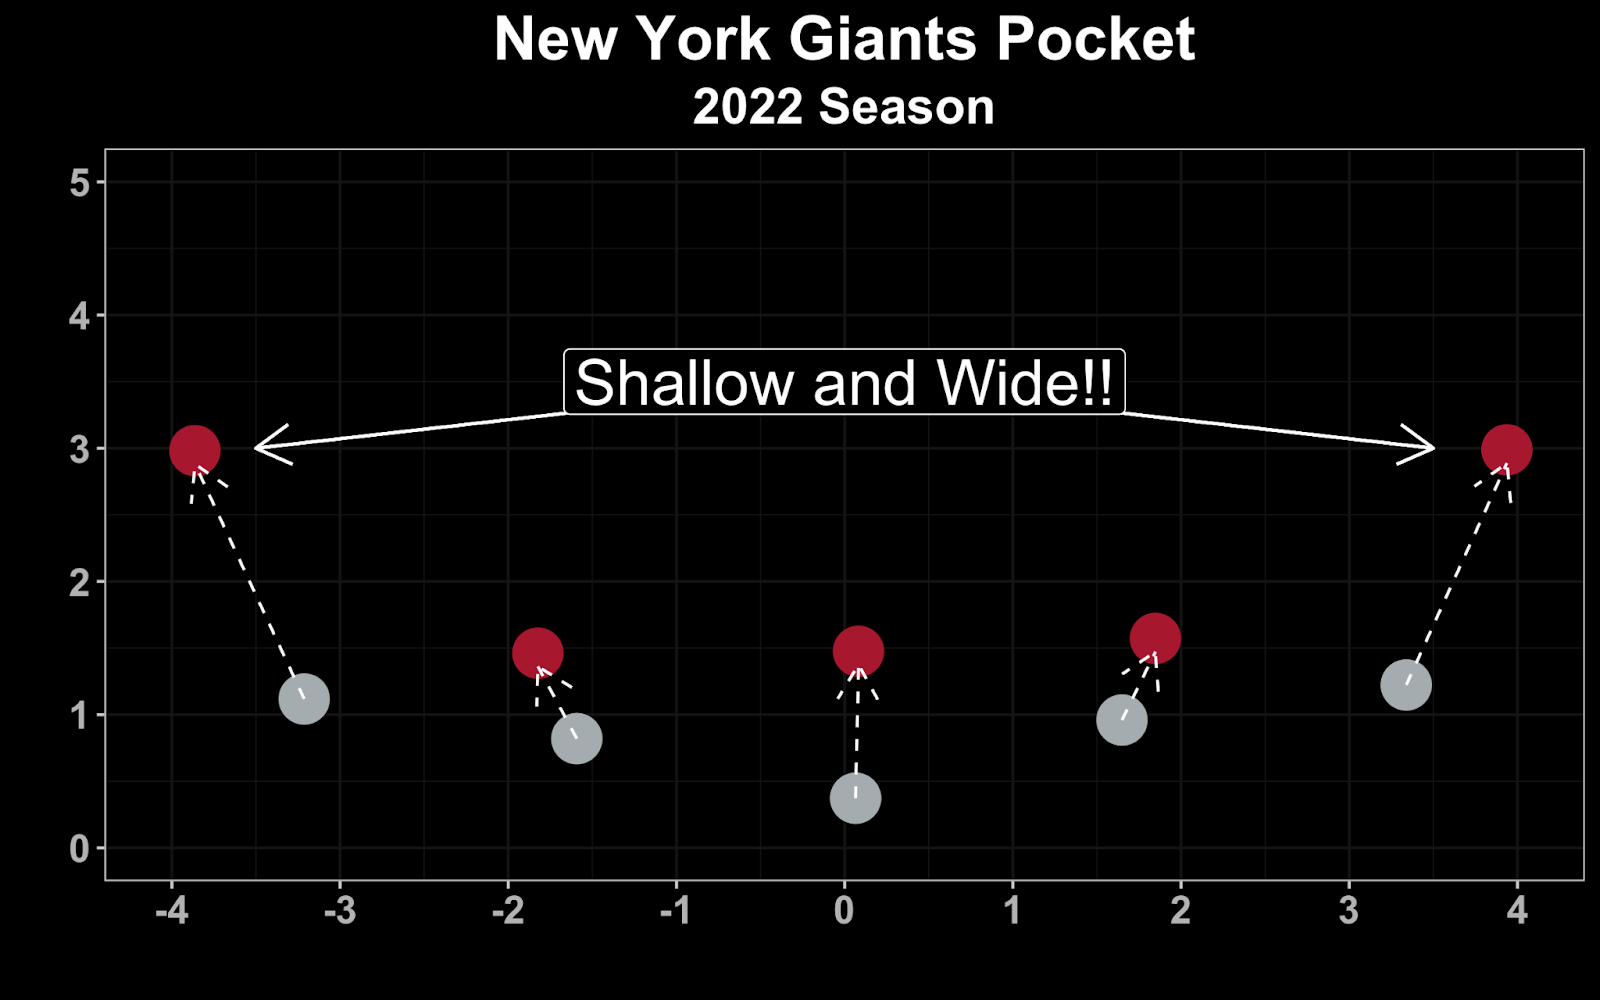
This is what the average pockets looked like for the Bucs and the Giants offenses last season. As noted above, the arrows point from snap location to the initial engagement location. The biggest takeaway on initial review is the depth of the tackles on first engagement. The Giants tackles are engaging with defenders just over 3 yards deep, while the Bucs are almost a full yard deeper, closer to 4 yards from the line of scrimmage. The extra depth the tackles get leads to a deeper pocket, and a farther distance to get to the quarterback. The Giants tackles also get a little bit more width on their drops, making a shallower, wider pocket.
Alignment Depth
A lot has been made this season about tackles lining up too deep. Although this is not new, we can see the difference in initial alignment of the Bucs tackles and the Giants tackles. The Bucs align deeper across the board as well with their guards lining up deeper than the Giants guards. The three teams that led the league in deepest alignment of tackles were the Indianapolis Colts, Steelers, and Philadelphia Eagles. The Giants were one of the top three teams in terms of shallowest tackles at the snap with the Bills and the Falcons being the other two.
Conclusion
As is the case with any new information, it can be hard to wrap your head around. It is often helpful to start at the lowest level, an individual play. At the individual play level, we were able to get information on the pass protection scheme, and pocket creation. The next step would be to include the information from the whole block. This can help answer questions like how well do offensive linemen stay on blocks? How much movement does a defensive lineman get on rushes? How quickly can defenders get off blocks? And much more!
Hopefully, this has been a helpful look into an aspect of the Tom Brady Data Biography that may be unfamiliar to many. There is so much information in what has already been released, and we will only continue to release more data! Later this month we will be releasing full season frame-by-frame tracking data! I’m excited to see the analysis that people come up with using this incredible dataset studying the best to ever play the game.
Matt Edwards
Head of American Football Analysis - StatsBomb
matt.edwards@statsbomb.com
@thecoachedwards on Twitter
