Pass completion models are frequently used to evaluate QB performance, e.g. in our 2023 NFL Draft analysis. So what happens if we use these models to evaluate defensive performance instead? In this article, we’ll take a look at possible interpretations of these models from a defensive perspective.
StatsBomb models
Here at StatsBomb, we use three different models to help characterize pass completion. The three aspects of pass completion that these models help us to define are:
1. Expected completion at the time of the pass: At the time the QB releases the ball, how likely is the pass to be completed?
2. Expected completion at the time of the catch (without pass placement): At the time the ball arrives at the receiver, how likely is the pass to be completed? (not accounting for the position of the ball relative to the receiver)
3. Expected completion at the time of the catch (with pass placement): At the time the ball arrives at the receiver, how likely is the pass to be completed? (accounting for the position of the ball relative to the receiver)
All of these models include features for defensive pressure on the QB and receiver, with the defensive pressure on the receiver being one of the most important features in the model.
These models all specifically evaluate pass attempts. This means that planned pass plays where the QB does not release a pass due to being sacked are not included, although these plays clearly indicate strong performance by the defensive line. Given this and the strong influence of nearest defenders to receivers in the model (with this having a larger influence in the model than pressure on the QB), this analysis will predominantly be evaluating defensive backs and linebackers dropping into coverage.
Pass Completion Probability
As a starting point, we can consider the probability of a pass being successfully completed at the time of the throw, aggregated by the team on defense. If the completion probability is low, then all else being equal e.g. air yards, pressure on the QB, this can be attributed to good defensive performance and the targeted player being well covered.
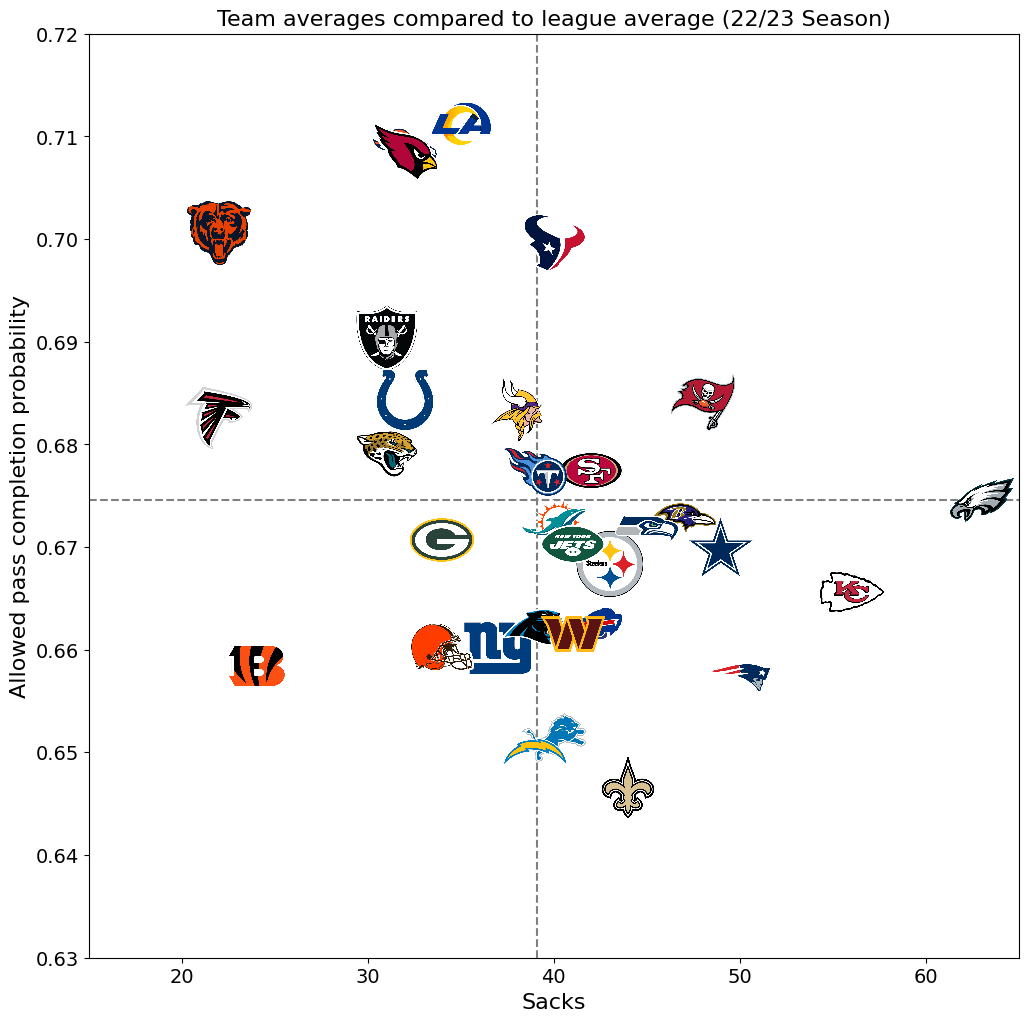
The plot below compares each team’s allowed expected pass completion probability (for all pass attempts) with the number of sacks in the regular season, both relative to the league average. Team’s who on average hold an offense to making throws with decreased completion probabilities are shown in the bottom half of the plot, and those who provide more sacks than an average team on the right of the plot. We can see that the Eagles recorded the most sacks, but their completion probability allowed was roughly average. This is perhaps indicative of a stronger focus on pass rush, preventing the QB from having the time and vision to find open receivers rather than tightly-covered receivers.
By comparison the Saints, Chargers and Lions led the way in limiting the completion probability at the pass attempt, while recording an average numbers of sacks.
We shouldn’t lose sight of the possible bias in the sample of passes we have to work from: if all eligible receivers are well-covered, then a QB may decide to scramble rather than attempt a throw with a high chance of an interception. Alternatively, good coverage down field might lead to more checkdowns, resulting in lots of completions, but not as much yardage as would more aggressive downfield throws. The QB might even decide to throw the ball away. All of which is to say the expected completion percentage allowed only tells us so much about a defense.
Completion Percentage Over Expected
Completion Percentage Over Expected (CPOE) is typically an offensive metric. It quantifies the expected completion percentage of a group of passes, using pass completion models like those discussed above, and compares this to the actual pass completion percentage over the same group of passes. The difference between the expected and actual completions leads to CPOE. A pass thrown and completed in heavy coverage (with a low expected completion probability) is therefore more valuable to this metric than a pass completed to a wide open receiver in space (with a high expected completion probability). We can also aggregate CPOE for each defense instead, which may give us an indication of defensive performance.
The plot below shows CPOE per defense for the 22/23 NFL season. As this is related to completion percentage, negative values (in red) indicate stronger defensive performance on attempted passes than positive values (in gray).

Change in Completion Probability
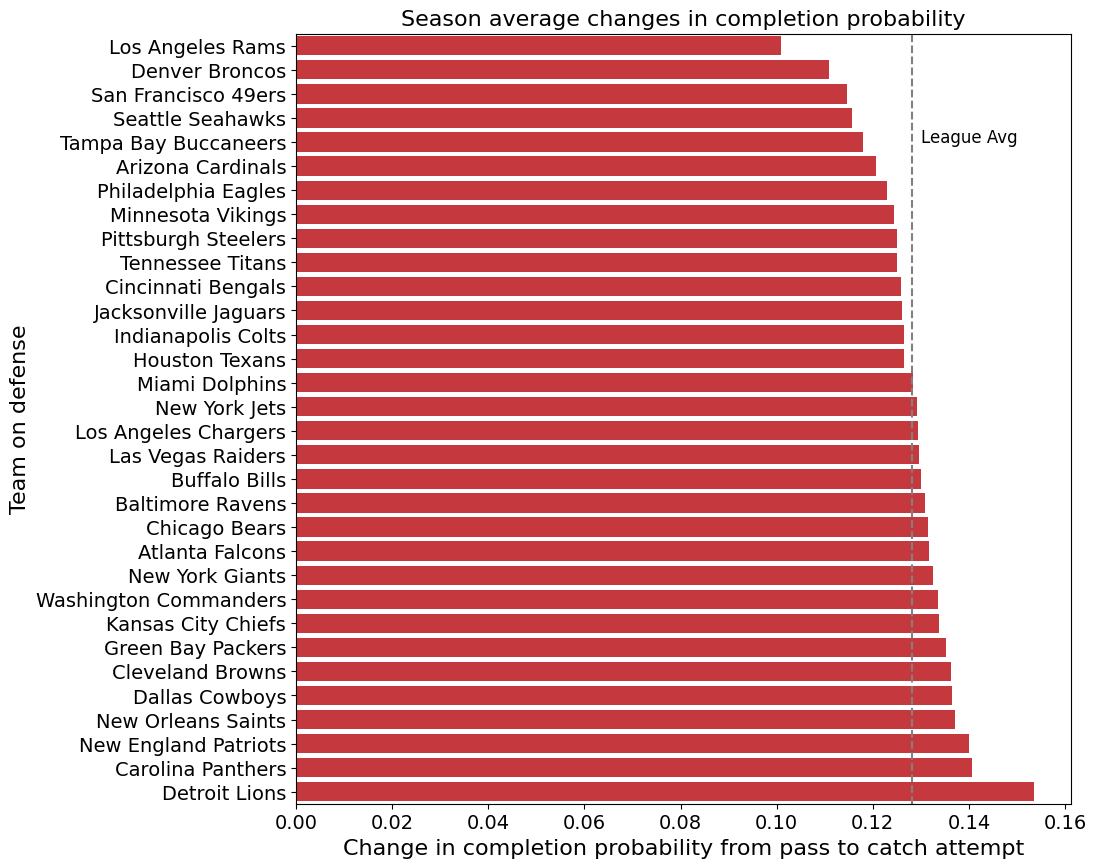
Alongside looking at completion probability at the time of the pass, we can consider the difference between completion probability from the throw to the catch attempt. From a defensive standpoint, a reduction in the probability of the offense completing the pass successfully could indicate situations where downfield defenders have correctly read the play, and closed gaps to the targeted receiver. So that the results of this analysis are not driven by poorly placed passes, we will consider the difference between the pass model and the catch model without pass placement (model 2 in the introduction above).
In all cases, the average change in completion between the pass and catch attempt is positive, indicating that the offense was more likely to successfully complete the pass at the catch event than at the pass. This is not necessarily surprising due to selection bias: completion probability at the catch attempt is only calculated when a catch is attempted, so this will not include pass attempts that were way off target, which on average have a lower expected completion probability than catchable attempts. The Rams did the best job at limiting this increase in completion probability.
The change in completion probability between time of throw and time of catch attempt should be viewed in tandem with the former. Teams and defenders already doing a good job blanketing receivers have less room for improvement than for decline, whereas a looser initial defense will give DBs more room to lower or at least limit completion probability with their ability to close on the ball. Scheme may also play a role in driving these results.
Looking at the distributions of this change in completion probability across all games in the season for the Lions and Rams, we can see that both teams do have some pass attempts that have a reduction in completion probability. The narrower distribution for the Rams perhaps indicates that their defense is more consistent with their ability to read plays and manage the completion probability of the offense.

Season to Season changes
Previous analysis focused only on games from the 22/23 season. To see how stable these metrics are over time, we can also look at similar outputs for the 21/22 season. The plots below compares the values between the 22/23 and 21/22 NFL seasons on the three metrics discussed above:
- Defensive CPOE
- Completion probability at the pass attempt
- Change in completion probability from the pass to the catch attempt
For all metrics, lower values represent better defensive performance. Each metric saw substantial movement in season to season ratings. Teams in the top-right or bottom-left of the figures have similar performances in each season.
The value above each plot is the correlation coefficient for that metric between the two seasons: CPOE exhibits close to zero consistency from season-to-season and there is fairly weak repeatability in completion probability. Of the three metrics considered, the change in completion probability from the pass to the catch attempt has the strongest correlation.

As the above analysis is not adjusted for opponent or defensive scheme, including changes in personnel and coaching, some variability between seasons would be expected. In addition, the stochastic nature of such metrics will influence repeatability between seasons, particularly CPOE which will be subject to less stable outcomes such as drops and interceptions.
Conclusion
Pass completion probability models present a novel way of assessing defensive performance, although they are restricted in scope to assessing performance on passes. To provide a fuller picture of defensive performance, analysis of this type should be combined with other aspects, such as pressure/sack rates, rushing metrics and EPA/expected yardage analysis of passes thrown. Big defensive plays involving interceptions could also be given more weight, as in the framework above, all incomplete passes are treated as equal.
It may also be that parts of this analysis are influenced by differences in defensive schemes. For example, a team that utilizes a large proportion of zone coverage compared to man coverage would likely expect to have an increased probability of completion at the pass attempt, as defenders are likely to be further away from the receivers at the time of the pass. Similarly, teams in zone coverage will likely limit the increase in completion probability from the pass to the catch more than teams in man coverage as defenders are more likely to be closing to the intended receiver than in man coverage where a receiver is more able to create separation with the ball in the air.
Abi Williams
Data Scientist
