 Introduction The 3rd round FA Cup weekend is already under way which means a break from the arduous Premier League season. With 20 out of the 38 rounds finished and 200 current season matches to draw data from, it seems like a good time to attempt to predict what might happen at the end of the season. Will Leicester City carry on with their spectacular early, but recently waning, form and be crowned champions at the end of the year, having been fighting against relegation just the year before? Will Spurs win their first league title in more than half-a-century, or will it be one of the more usual suspects in Arsenal or Manchester City? What should we expect from traditional powerhouses Manchester United and Chelsea? And is there any salvation for Aston Villa? Too many questions and if you are looking for definitive answers, this is NOT the place to be. What you will find here is a collection of probability estimates to help answer the questions above, and words or phrases like “probably”, “most likely”, “maybe”, “perhaps”, “outside chance” etc, which exemplify the often quoted “Statistics means never having to say you're certain.”. And no, I’m not sure whose quote that is. There are a number of football prediction models out there as a lot of people prefer to base their opinions on data rather than their gut feelings. Some of the predictions aren’t publicly available; others are regularly posted on blogs or social media. But in either case, a comparison between different model predictions is not always feasible. Wouldn’t it be nice to have some of these predictions, side by side, not in a competitive sense, but rather in a complementary fashion? Quite often, in statistics, combining predictions from different models improves the overall performance of a forecasting model so why not use the wisdom of the models (to paraphrase https://en.wikipedia.org/wiki/Wisdom_of_the_crowd) in a “poll of models” set-up? Participants Twitterland was the go-to place to ask for contributions and I was pleasantly surprised to find out that people were quite willing to share their figures. In total, there were 15 participants, all of them submitting end-of-season points’ estimates for each team in the Premier League, while all but one of them shared their estimated probability distribution of each team ending up in each position in the final table. The contributors (to whom I owe a big “Thank you” and a beer whenever we meet!) are in alphabetical order of their Twitter usernames: @11tegen11, @cchappas, @colinttrainor, @DaveLaidig, @EuroClubIndex (via @SimonGleave), @fussbALEXperte, @GoalImpact, @goalprojection, @JamesWGrayson, @MC_of_A, @opisthokonta, @seconddropp, @stats4footy, @SteMc74 and @WillTGM Note that I didn’t request additional information on the models especially as some have quite extensive explanations already publicly available online while some are private. In addition, increasing the response burden unnecessarily could have resulted in lower participation figures so if you need more details on the models, contact their creators directly. Without further ado, let’s have a look at the results. And what better place to start with but with the top of the league.
Stats Note:
- For those not familiar with boxplots, they are a visualisation tool to graphically depict information on a dataset through its quartiles. The two sides of the box are the 1st and 3rd quartile while the line inside the box shows the median i.e. the 2nd The whiskers on each side can represent different values but in this case, they extend to the minimum and the maximum value within 1.5 x IQR (interquartile range) of the closest quartile. If there are values outside this range, there are represented as points.
- Each model prediction is represented by a differently coloured point in the following plots. To avoid overlapping and to hopefully make the plots a bit clearer, points were randomly moved horizontally for each team.
Here endeth the stats lesson!
Results So who’s going to win it? 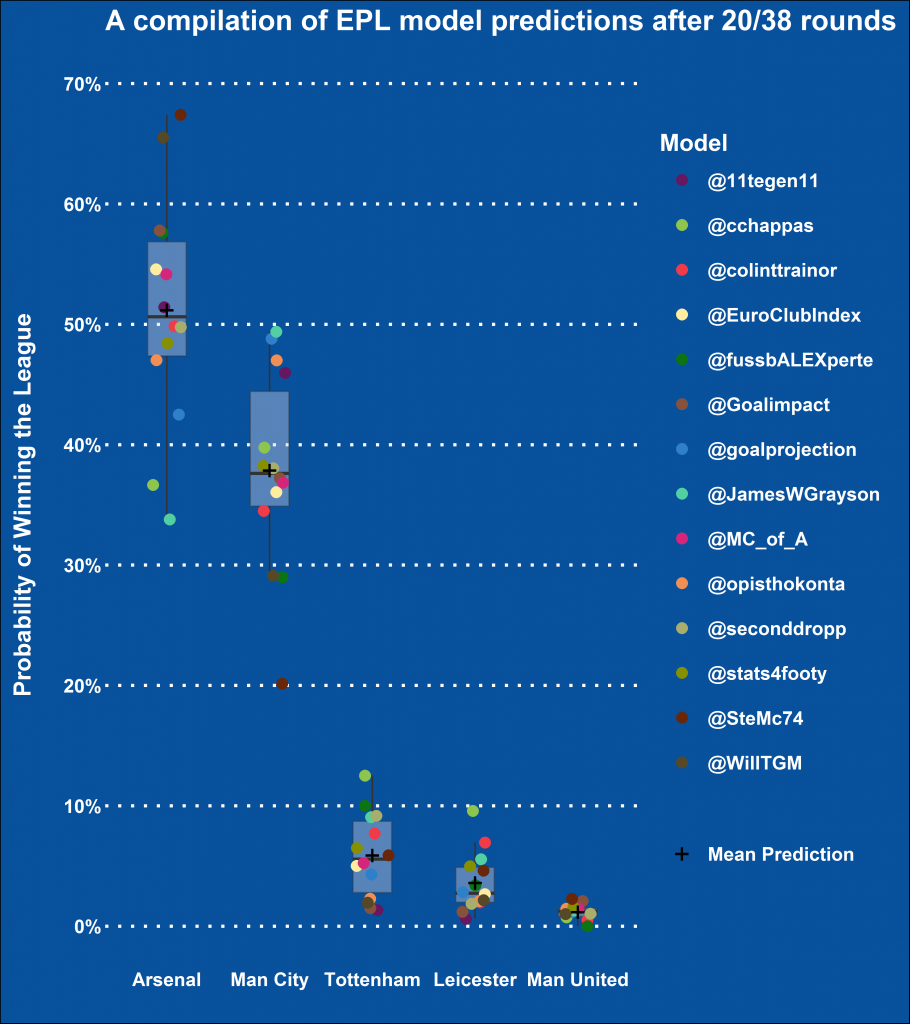 Well, this is quite interesting. The Gunners and the Citizens are the clear favourites, but there’s a lot of variability in the predictions. Arsenal’s league chances range from 34% to 67% with an interquartile range of 47% to 57%. Both the mean and the median prediction are close together and approximately 51%, suggesting a generally symmetric distribution. At the same time, Manchester City’s chances are rated generally lower but with some overlap. Both the average probability prediction for the Citizen’s winning the league and the median prediction stand at 38% approximately. There is slightly less variability amongst the predictions (partly because of the lower overall mean) and the IQR is between 35% and 44%. Interestingly enough, some models prefer Arsenal; some prefer City and some can’t separate the two. Unfortunately for Spurs and Leicester City fans, it would seem that the chances of their teams winning the league are relatively small. Not negligible by any means, but small nevertheless. Manchester United have also been included in the plot as their mean prediction is above 1% (the threshold used for inclusion in the chart) but they are unlikely to challenge based on what the models currently predict. It would be a huge surprise if anyone else topped the table at the end of the season. What about Top 4 Finish?
 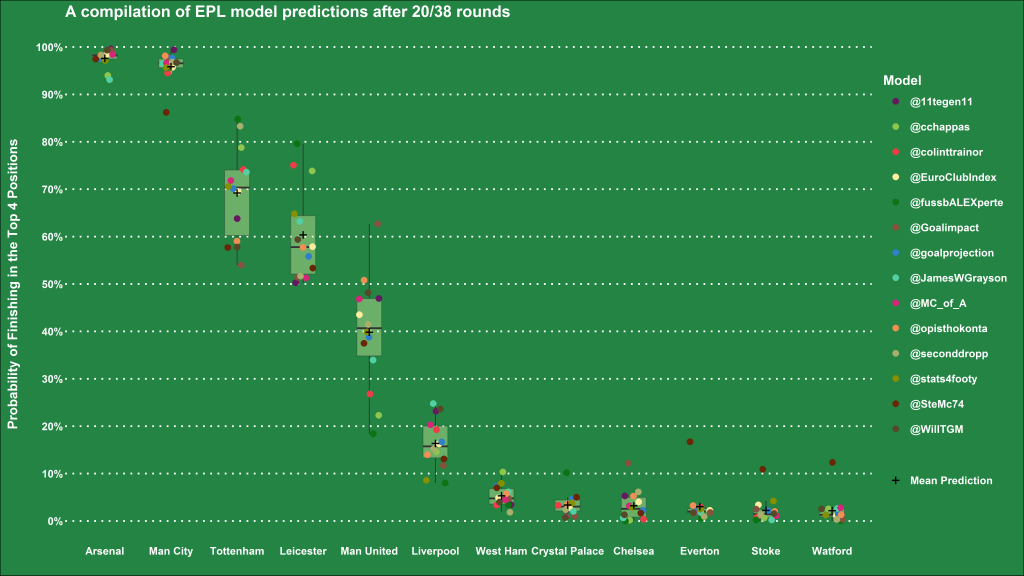 Arsenal and Manchester City are almost guaranteed a finish in the Top 4 positions, so there are only two positions left. Spurs look very well placed with an average chance of 69% which nevertheless ranges from around 55% in some models to a very large 85%. They are closely followed by Leicester City whose distribution of Top 4 probability estimates is positively skewed i.e. most models estimate those chances to be between 50%-60% with a few in the 65%-80% (!) range. Louis van Gaal’s Manchester United is a big question mark, exhibiting very high variability in the models’ estimated probabilities of a Top 4 finish with models predicting their chances as low as below 20% and as high as above 60%. Finally, there seems to be an outside chance of Klopp’s Liverpool to break the Champions League places’ party with the rest of the teams rated very low by most models bar the odd outlier. And the wooden spoon goes to ….?
 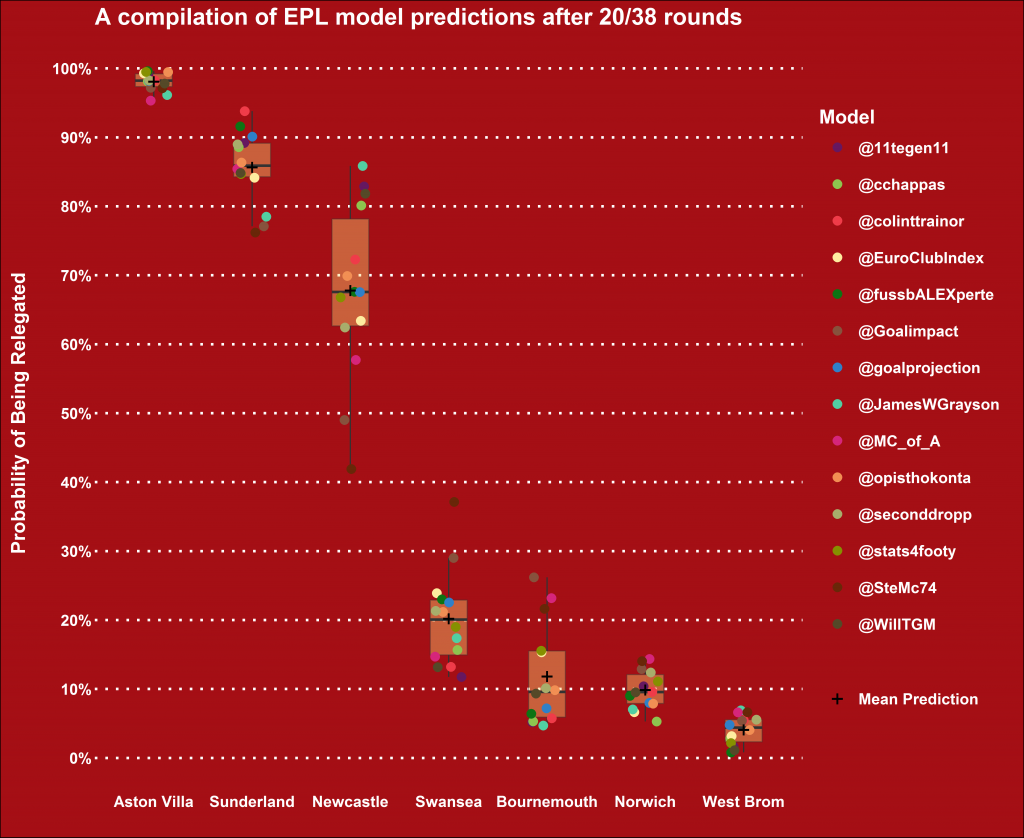 … Aston Villa, who else? Followed by Sunderland and probably Newcastle. But definitely (“definitely”? Ooh, careful there!) Aston Villa. The models all agree that it’s not looking good for Remi Garde’s team. With a survival chance of 5% under the most optimistic scenario, the Villains will need to start planning for life in the Championship. Sunderland follow closely while there is a lot of uncertainty regarding Newcastle. Some models rate their chances of survival below 20% while more optimistic Geordie fans will choose to believe the other end of the spectrum where their chance of survival is rated at 58%! If either of Newcastle or Sunderland do escape relegation (okay, okay, or if Villa perform Houdini-esque escape), the most likely team to follow them are Swansea or possibly one of the newcomers Bournemouth or Norwich. What about <insert team’s name here>? Well, I thought you might ask so I’ve prepared the following couple of charts to satisfy your needs. The first one shows the mean probability for each team ending in each position across all models as a heatmap while the second one also illustrates the median probability with a backdrop of how individual models rated each team’s chances.
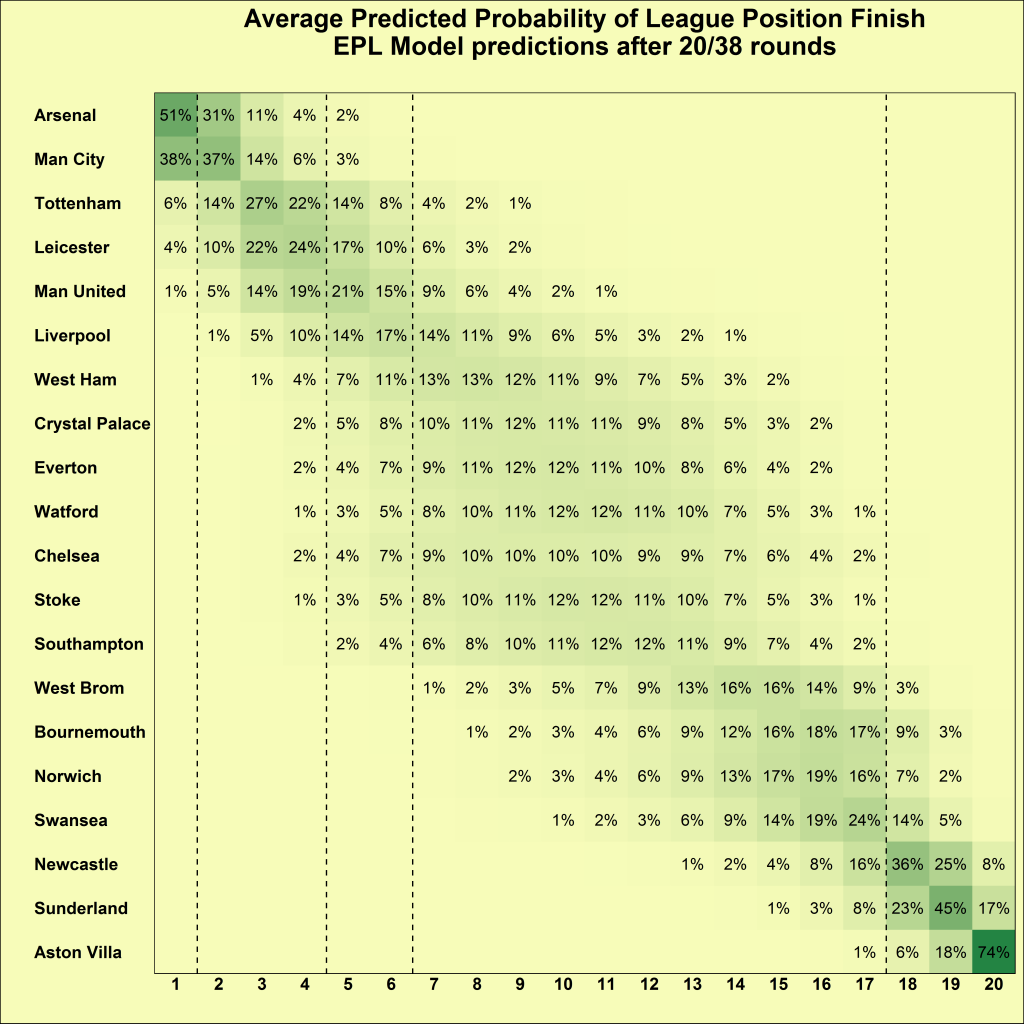
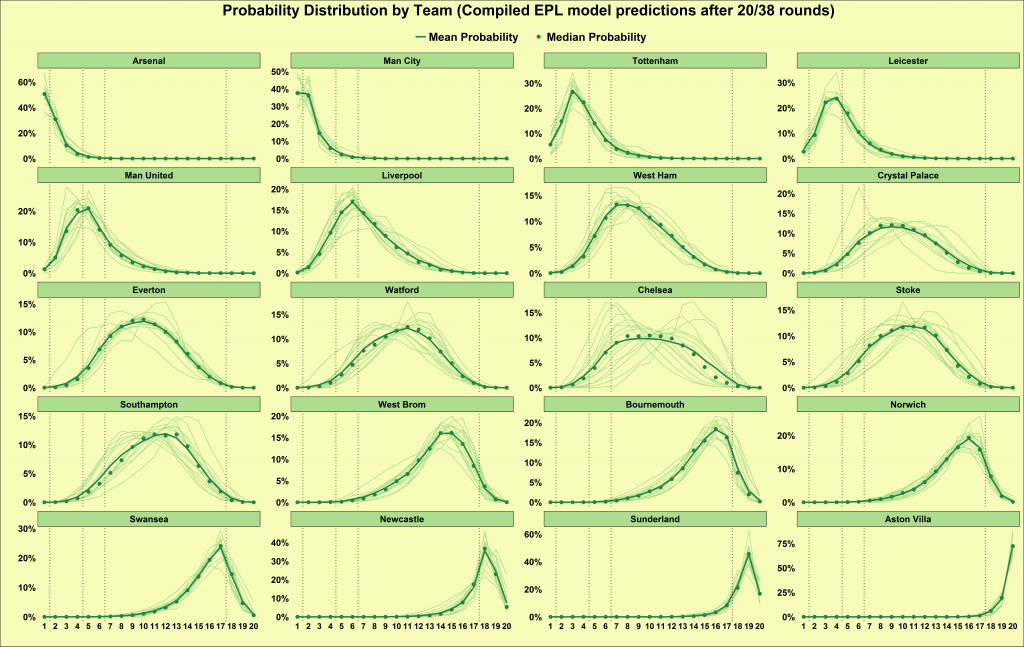 What’s interesting is that the models tend to more or less agree in most cases, but there are specific examples where they rate teams quite differently. Football developments at Chelsea this year were surprising to say the least, which seems to have left the models perplexed as to whether the rest of the season’s matches will see last year’s version of Chelsea taking over from this year’s early season performance. Some have Chelsea’s likeliest position between 5th and 7th whereas others expect them to finish between 13th and 15th. Perhaps, somewhere between the two ranges will be the outcome at the end of the season as the mean and median probability across all models would suggest. A lot of the points mentioned in this piece are also illustrated by the following chart showing the predicted number of points for each team, as well as Sporting Index quotes after round 20, for the end-of-season points’ total.
 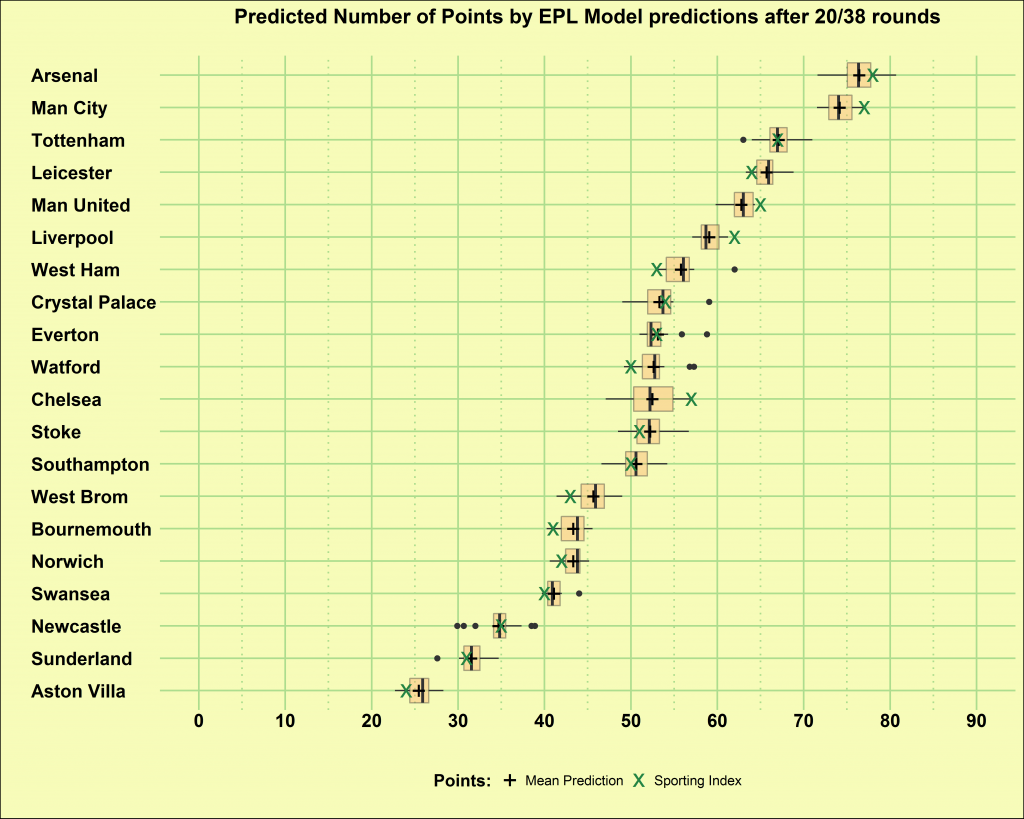 As mentioned before, Arsenal and Manchester City are rated as favourites in the title race, while Aston Villa are expected to be relegated somewhere around the 25 points mark. From the small sample data that we have, Newcastle’s predicted points total seems to follow a leptokurtic (there’s a word you never thought you’d read in a football-related piece!) distribution, i.e. with a high peak in the middle and fatter tails on either side. Furthermore, the chart shows the higher uncertainty around Cheslea’s final points total compared to other teams. Interestingly enough, Sporting Index expect Guus Hiddink’s team to perform towards the higher end of that (wider) range. Finally, while the title-winning team is expected to finish with a lower total (between 75 and 80 points) compared to previous seasons, the often quoted “40 points for survival” threshold seems to hold true according to the models’ expectations. A final note … It goes without saying that this report is simply a picture of what these models currently predict. After a few rounds or the next set of matches even, predictions may change especially for those models which heavily depend on recent form so the results may not necessarily be valid for a long time. Furthermore, if any model takes into account additional information such as injuries to key players, suspensions, or elimination from cups even this weekend’s FA Cup matches may have an effect on a team’s league chances. Having said that, although it may be interesting to monitor how these predictions change until the end of the season there are no plans to repeat this exercise on a regular basis. But enough with what we expect; let's see what real life has in store for us!