 Last week on StatsBomb I wrote about profiling teams and finding similar teams through styles of play. In that piece I mentioned the next step might be grouping teams as a basis for comparing how certain styles of plays match up against each other. This is the first step toward that, as I've compiled a rough family tree of European defenses playing styles. First, a reminder of what metrics I'm using to determine style of play: 1. Possession 2. High press score (completion % allowed 60 yards+ from goal) 3. Shot Tempo (shots per completion) 4. Field Tilt (ratio of final third/own third completions allowed, higher means opposition spends more time upfield) 5. Box Activity (passes into box allowed per game) 6. Intra-box completion % (passes that start and end in box) 7. Forward play (% of passes that are forward) 8. Centrality (% of final third completions that are in the middle of pitch) In the previous piece, I found similarity scores for entire teams. Now, I am focusing only on the defensive side of the ball. I couldn't go team-by-team manually grouping teams and I couldn't eyeball teams so to group the teams I used a k-means cluster analysis. All the metrics had been normalized, so no one variable dominated. The problem with k-means is you have to choose how many groups there are yourself. To choose how many groups to use, I ran a k-means analysis for each possible number of groups from 5 to 35 and found that 20 was right about the spot that the amount of variance stopped decreasing consistently. This is called the elbow test and while the results weren't totally definitive, they fit in well with the general rule of thumb for determining # of groups which is the square root of the # of observations/2. All this to say, the 98 teams are divided into 20 groups. Let's look at some of the interesting groupings. First, group 4:
  Something stands out here. You've got these teams with large profiles that you've seen late in European competitions recently and then United and Empoli, am I right? Seriously, I've never watched a full Empoli game so was surprised to see them pop up in this group. The defining characteristics of this group are very high levels of possession, a low defensive field tilt (opponents spend relatively more time in their own third than in attacking third), low box activity, high shot tempo allowed and are easy to complete the final pass against inside the box. It's not always easy to get the ball upfield past these defenses, but once you do you have a good chance of a quality look at goal. Might call them the soft underbellies.
 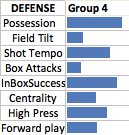 Group 8 is another interesting group to look at, I like to call them the nullifiers:
  Napoli, Lille, St Etienne, Nantes, and Atletico Madrid have a little above average possession and an average press score as a group and then allow almost no central play (11th percentile), are very good inside the box (23rd), rarely have the box tested (11th), and allow an extremely low shot tempo (9th). This all adds up to under 10 shots allowed per game and barely over a goal per game allowed. I'd figure the managers of these teams are thinking first, second, third and fourth about nullifying the opposition when they set their teams out.
 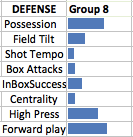 The final group of teams to look at is one near and dear to my heart, the Bielsa Disciples in Group 16:
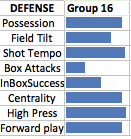
  I personally absolutely love watching the style that Marseille, Celta de Vigo, and Rayo Vallecano play. I say that somewhat hypothetically as I haven't watched more than a half of Celta de Vigo and didn't know much about them before I began this process. When I saw them popping up alongside Marseille I looked them up to make sure I wasn't missing something. I found their coach Eduardo Berizzo is a Bielsa disciple who worked as an assistant to him for several years for Chile. The fact the algorithm knew it before I did is a good sign. These teams all have high possession numbers and have extremely high presses. They also allow a higher centrality than any other group, a higher shot tempo than any other group, and higher forward play than any other group. If you love to see crazy man-to-man marking up the pitch with a high risk of a long ball down the center of the pitch leading to a shot, these are the teams to watch. Rayo came into the Camp Nou and ruffled Barcelona for about a half late this season before being eventually blown away 6-1. Marseille led PSG through goal off a high takeaway before being cut open 3 times in quick succession. This group provides exciting, physical games with lots and lots of open space.
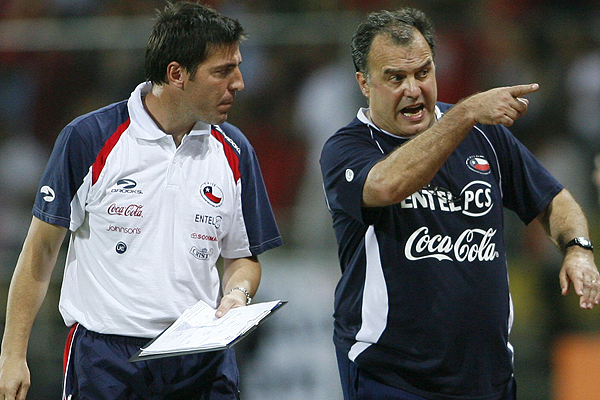
 There is a lot more interesting stuff in all the individual groups, but more on another day. Each group and their central metrics will be at the bottom of the article. Building the tree I had a bunch of groups or families of teams but I wanted to know which were related. I knew the Bielsa Disciples group wasn't going to be close to a group with Aston Villa, but how close were they to the soft underbelly of United? I wanted to know. So with the 20 groups average metrics replacing the individual teams metrics, I ran another type of cluster analysis called agglomerative hierarchical clustering. It basically uses similarity scores among groups to build a family tree showing who is related and by how much until all the groups are connected. I will post the tree with the group names (which mean very little to you), and then go through an example involving a team. Here is what the tree looks like:
 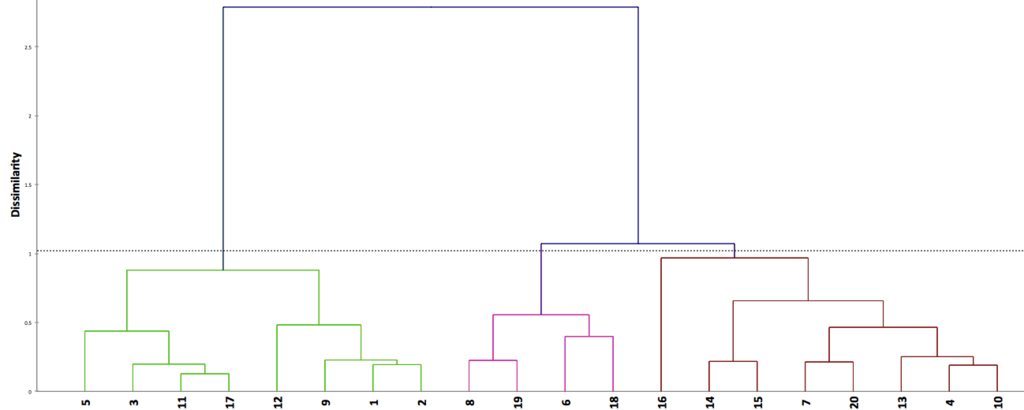 We will be using a team from group 7 to follow up the tree. Group 7 teams are distinctive for a very low shot tempo allowed, low box activity, and high possession. This is a common defensive profile among good Italian and English teams (why that is is a fascinating question but well beyond the scope of this article). The profile and members are below:
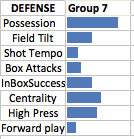
 So if you are Liverpool (our example), the teams who defended most similarly to you this year were Saints, Juventus, Chelsea, Arsenal, Lazio and Man City. These are your siblings on the defensive family tree. We can see on the tree that this group of teams are very closely related to group 20 mainly due to the fact that group 20 teams have a very low box activity and very low shot tempo against as well. Group 20 is an all-Spanish affair:
  On the family tree, these are the cousins/primos who you see at the holidays if you are Liverpool. The main differences between group 7 and 20 are the Spanish sides have lower possession, higher pressing, have a much lower centrality percentage, and are a bit easier to pass against inside the box. You can see that playing a similar style doesn't guarantee similar results as Levante and Athletic's style's led to a 25 goals allowed difference, the huge possession difference a big factor there. The next step up the tree we see groups 13, 4, and 10. These are the relatives you might see at a family reunion every few years. We already saw group 4 above (the soft underbellies of United, Empoli, PSG, and Fiorentina). Group 10 has Lyon, Roma, and Bordeaux:
  and group 13 has the strange trio of Spurs, Everton, and Real Madrid:
  The rest of the teams on the right side of the defensive family tree are only tangentially related to Liverpool and their siblings: Group 16 (Bielsa Disciples), Group 18 (Toulouse and Malaga), Group 6 (Inter and Barcelona), Group 19 (the dominant German pressure of Dortmund, Bayern, and Leverkusen), and Group 8 (the Nullifiers). Maybe at a funeral or a wedding you see one or two of these guys, but you are vaguely aware there is a little of your blood in their bodies. Once you get to the other side of the family tree, it's open season. No longer are you close enough relatives to know any of the same people or worry about incest, you are basically total strangers. Some of these total strangers include a massive group 5 full of German teams, Gladbach and Torino's total box shutdowns in group 12 and the general low quality of Chievo, QPR, Burnley, and Villa in group 2. Strengths, weaknesses and looking forward This is the next step on a project that is eventually wanting to determine if certain types of teams play better against other types. Maybe we find out that the Bielsa Disciples do better than expected against teams who like to have low possession and use long balls to move the ball upfield. Maybe the Nullifiers don't do well against those teams. I don't know if anything will come of that but that's what I'm going to continue to look at. The next step is to build an offensive family tree and then start looking at match-ups between the two. Eventually, we can drill down to game-to-game or month-to-month level and see how teams are adjusting their styles throughout the season or against different teams. Another step, and one that could a massive project will be who is dictating what on the pitch. If a team like Torino who is almost off the charts at getting the ball central plays Metz who allows almost no central play, what would we expect? How does this change for shots, long balls, in-box passing skill, etc. It sounds like a very hard but worthwhile project and I think these steps can help build the groundwork for that. The strengths are I like identifying relationships I had no idea about before. The Celta Vigo example is perfect. It was a team I knew little about and the numbers told me they played like Bielsa disciples before I had researched them or watched a game. The possible weaknesses are maybe too much info is being lost along the way here. Passing numbers are being converted to percentiles which are being used as one of 8 metrics to group teams together, then clustered further. So much is lost at each step, it's hard to make any concrete conclusions from just seeing this tree. It's an incredibly fun and I think a valuable informational tool, but might have limited value if you are a coach or a GM setting up a team. Also, the metrics could (and almost surely should) use some fine-tuning. Field tilt in particular needs to be honed to include every pass, and each one could use a full article or two to really flesh out. For know, this remains a first draft but one that could open promising new areas for exploration. To conclude the article, every group and their metrics are posted below. Hopefully you enjoyed! Comments are closed here, so if you have questions, comments, or want to discuss the article you can go to my blog by clicking here and comment on the article which should be posted soon after this article runs here or chat with me on twitter @SaturdayonCouch The Groups Group 1 Atalanta, Milan, Sampdoria, Verona, Leicester City, Stoke City, Sunderland, Swansea City, West Brom, West Ham Group 2 Cagliari, Chievo, Palermo, Aston Villa, Burnley, QPR Group 3 Cesena, Udinese, Lens Group 4 Empoli, Fiorentina, Manchester United, PSG Group 5 Genoa, Mainz, Frankfurt, Augsburg, Schalke, Hamburg, Hannover, Freiburg, Bremen, Hoffenheim, Stuttgart, Wolfsburg Group 6 Inter, Barcelona Group 7 Juventus, Lazio, Arsenal, Chelsea, Liverpool, Southampton, Man City Group 8 Napoli, Lille, Nantes, St Etienne, Atletico Madrid Group 9 Parma, Palace, Hull, Newcastle, Koln, Hertha, Paderborn Group 10 Roma, Bordeaux, Lyon Group 11 Sassuolo, Cordoba, Deportivo, Eibar, Espanyol, Getafe Group 12 Torino, Gladbach Group 13 Everton, Spurs, Real Madrid Group 14 Bastia, Caen, Evian, Guingamp, Montpellier, Rennes Group 15 Lorient, Metz, Monaco, Reims Group 16 Marseille, Celta de Vigo, Ray Vallecano Group 17 Nice, Almeria, Elche, Granada, Real Sociedad, Sevilla, Villarreal Group 18 Toulouse, Malaga Group 19 Leverkusen, Dortmund, Bayern Group 20 Athletic, Levante, Valencia The central metrics for each group: (percentiles)
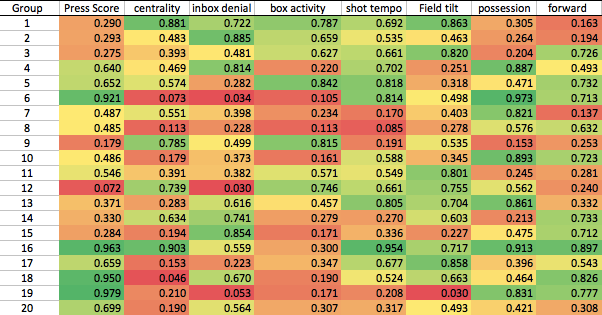
2015
A Family Tree of European Defenses
By admin
|
June 1, 2015
