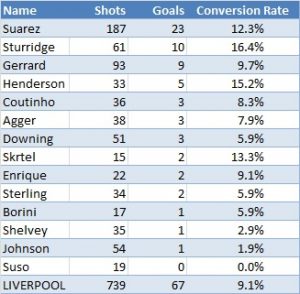
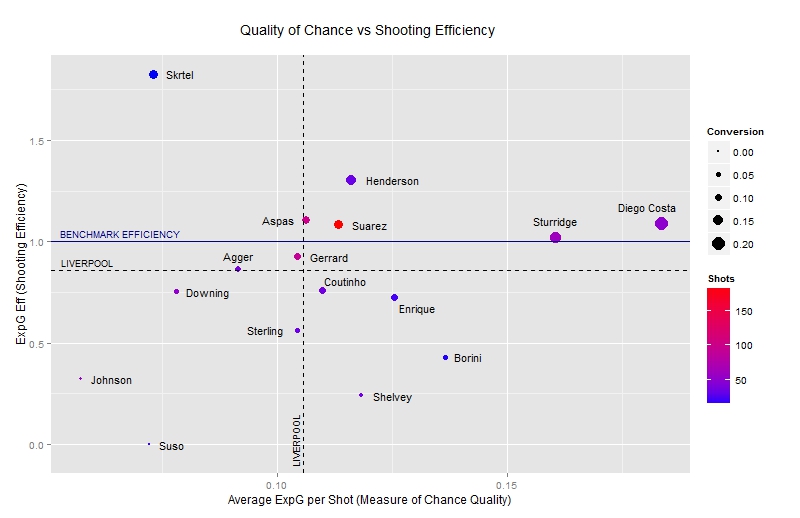
Following up from Dan’s (@DanKennett) piece yesterday and expanding on my previous article, I decided to look a bit more closely to the Liverpool performance in 2012/13 through the lens the Goal Expectation (ExpG) metric and its associated efficiency. As mentioned in my previous piece, it estimates the probability of a shot being scored by taking into account a number of shot characteristics. The easier the chance, the more likely it is for the striker to score the goal, and therefore the higher the ExpG value. On the other hand, shots from difficult positions (as well as other factors), which are less likely to end at the back of the net, are associated with smaller ExpG values. Excluding own goals, Liverpool during the 2012/13 season scored a total of 67 goals. To achieve that, they needed 739 shots, which translates to an overall conversion rate of 9.1%. Of those 67 goals, 23 were scored by Luis Suarez (a conversion rate of 12.3%), 10 from Sturridge (conversion rate of 16.4%) and 9 from Gerrard (conversion rate of 9.7%) with the rest of the players scoring 5 goals or fewer. The following table shows the raw conversion rates of all Liverpool players who had at least 10 shots.  Note that Gerrard’s 4 out of those 9 goals were in fact penalties, and one of Sturridge’s goals came from the penalty spot. Had we removed all penalty shots (Gerrard had one saved against West Brom) from the data, the captain’s conversion rate would fall to 5.7% and Sturridge’s to 15%. It becomes immediately obvious that including penalty data in total shots/goals statistics creates a problem, as conversion rates do not provide a platform to compare players on. Taking this a step further, the same would apply when trying to compare a predominantly long-range shooter to a 6-yard-box goal poacher; conversion rates alone would not make much sense. It’s here that the metric ExpG we devised with Colin Trainor (@colinttrainor), and have introduced during the past week or so in a series of articles, can provide the additional information and the platform to compare players or teams on. Our calculation of goal expectancy, given the chance a player is presented with, is based on a number of factors. The higher this number, the better the quality of the chance. If a player has many such chances (or in general a higher average ExpG per shot) you would expect their conversion rate to be relatively higher too. We also devised a metric to measure a player’s ExpG efficiency (ExpG Eff). As described in previous pieces, if a player is expected to score 10 goals given the type of his chances, yet he manages to get on the scoresheet 12 times, his ExpG Eff is 12/10 = 1.2 therefore he is 20% more efficient than how an average player would fare from that particular combination of chances. In a sense, this removes (to the model’s best ability) the explainable factors affecting conversion rates (such as a shot’s location) and leaves whatever factors are unaccounted for. The better the model, the fewer the significant unaccounted factors. To visualize all this information, I’ve tried to include these metrics for those Liverpool players who had more than 10 shots during 2012/13 in the following plot:
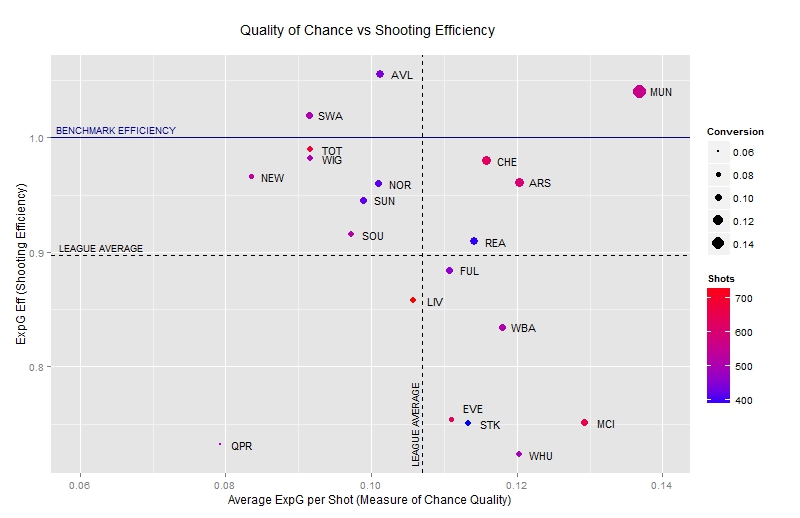
[As you will notice, both Liverpool’s summer transfer Iago Aspas, and transfer target Diego Costa have been included in the analysis for comparison purposes.] The horizontal axis shows a measure of the average chance quality for each player, according to our calculations. The vertical axis illustrates the efficiency based on ExpG. The size of each point indicates the traditional raw conversion rate while the colour of each point highlights the number of shots each player took. In addition, Liverpool’s average chance quality and overall efficiency are shown as well as what the benchmark efficiency is (1.00). What can we gather from this? As mentioned in a previous piece as well as a tweet discussion a few days ago, Liverpool’s overall efficiency has been below average, and by our figures lies at around 0.86. This simply means that Liverpool did not score as many goals as their chances should have expected them to do. Liverpool scored 67 goals, but had they been average in terms of efficiency they would have scored approximately 78 goals. As an aside, here is the same chart on a team-level, for the 20 Premier League teams in 2012/13:
Back to Liverpool, the shooting inefficiency was widespread across the team. Only 4 Liverpool players managed to have an above average efficiency: two strikers (Suarez with 1.08 and Sturridge with 1.02), a midfielder (Henderson with 1.30), and a defender (Sktrel with 1.83). The rest of the players posted marginally or grossly inefficient figures, irrespective of their position on the pitch. It’s also interesting to note that both Sturridge and Borini come out on top of the chance quality measure, as one would expect given the fact that they are strikers, but the same does not apply to Suarez. The average quality of his numerous (red dot!) chances is lower down, evidently affected by his choice of difficult-to-score shots from acute angles or long-range efforts. However - and this is something that the efficiency picks up on - due to the difficulty of his chances he is “only” expected to score 21.2 goals from those 187 shots, whereas Sturridge was expected to chip in with 9.8 goals from his 61 efforts. So in effect, Sturridge may have registered a higher conversion rate, but given the type of chances he had, he was expected to do so. It’s for this reason that looking at the 16.4% raw conversion rate for Sturridge against the Uruguayan’s 12.3% is not directly comparable. The ExpG efficiency measure is also more robust against the inclusion or lack of penalty shots in the data. Gerrard’s ExpG Eff is at 0.93 but “only” falls to 0.83 once penalty shots have been removed instead of a 9.7% to 5.7% move in the raw conversion rates. Other players with a significant number of shots include Johnson and Downing, both of whom have contributed less than expected. While in the case of Johnson, that may be excusable given that he is in fact a defender, Downing has consistently failed to live up to expectations in terms of scoring (and in terms of assists, but that’s another matter!), so it may indeed be the final curtain for him. On the other hand, Henderson’s impressive 1.30 ExpG Eff, as well as his shooting from favourable positions, may necessitate keeping a closer eye on him in the future. As for Skrtel, he has performed way above scoring expectations, but that is only based on 15 shots, so I would not jump into conclusions just now. As mentioned above, data from the 2012/2013 Celta Vigo season for Iago Aspas have also been included in the char,t as well as Diego Costa’s metrics. Aspas performed very similarly to Suarez, scoring 12 goals while expected to score 10.9 out of 102 shots. That gives him an ExpG Eff of 1.11 and if he can replicate his performance for Liverpool, he may prove an excellent addition (or should I say replacement?) to Suarez, especially given the relatively low fee. Talk of Diego Costa has somewhat quietened, but perhaps his raw conversion rate of 20% was misleading given that his shots came from chances of extremely high quality. More relevant would be his efficiency, which is not much different to either Suarez or Aspas and lies at 1.09. It’s reasonable that such analysis, both in terms of methodology and with respect to its usefulness, is open for debate. The main question, associated with sample size, is whether a single season’s results can be repeated or whether they are down to chance. Unfortunately, we don’t have access to previous seasons’ data and cannot answer this question. With the new Premier League season starting soon, perhaps additional data will either reinforce or contradict our findings. One thing is for certain though: metrics such as these help to better understand and compare the more traditional statistics, and perhaps occasionally unearth information hidden under the large volume of noise.


