At Hudl Statsbomb, we have a long-standing commitment to elevating the women’s game. Our previous initiatives have focused on making analytics tools and resources more widely available so that analysts and armchair fans alike have access to the same data and tools that are accessible to their counterparts in the men's game. Now we want to ensure that the models and analytics applied in the game are reflective of the sport.
To give a timeline of the uptake of data on the women's side of the game, consider that it was four years ago we first released the 2018/19 Women's Super League event dataset, and three years since we offered WSL teams free access to our analysis platform. Since then, we've made five additional data releases for women's competitions, expanded our free initiative to Europe's top five leagues plus the Swedish Damallsvenskan and NWSL, and been commissioned by a global governing body to collect a longitudinal dataset covering women’s EUROs tournaments from the last 20 years to track changes in the game across that period.
The success of our initiatives is evident in the ever-increasing number of women's teams taking on our data and tools, and the subsequent expansion into analysing other leagues that the teams have regularly gone on to make afterwards. However, it’s important to us as champions of women's football to ensure that the practical analytics side of the game isn’t neglected. There are several subtle differences between the men’s and women’s games, so ensuring that the models we train perform well for both is important in order to maximize the value of the analytical tools to both sexes.
So, this year the Hudl Statsbomb Data Science team has been researching the impact of different ways of incorporating our women’s data, which now covers several seasons across multiple leagues around the world, into our models. This work has mainly been conducted in our xG models and upcoming xPass model. We presented some of our research and findings in this area for the first time at our recent 2022 Statsbomb Conference, and are excited to share some of the outcomes of that research here.
xG Models in Women’s Football
Historically, the availability of women’s data has been scarce, so most xG models were trained on men’s data. These models were nonetheless used to derive xG estimates for the women’s game, since having an approximate estimate of the likelihood of a shot resulting in a goal was still more useful than not having one at all.
The models were seen to still perform reasonably well when applied to women's football, but, as part of our recent upgrade to our xG models, we decided to reassess how the women’s side of the game was being handled, since we knew that "reasonably well" or "good enough" is not the bar we wanted to set for ourselves.
We wanted to ensure the models in the women’s side of the game are as good as they possbily can be.
In order to do that, we needed to consider several different approaches and assess the out-of-sample predictive performance (how well the model performs on shots it hasn't seen before, as opposed to the shots it sees in the training data) of each to find the optimal method:
Dinesh Vatvani explains the different approaches
Very broadly, there are three possible approaches to take when creating an xG model to apply across men’s and women’s football.
- Gender-unaware: A single model is trained on a dataset containing both men’s and women’s data. It assumes that gender makes no difference to xG and can safely be ignored
- Gender-aware: A single model is trained on a dataset with shots from both men’s and women’s games, but this time with gender included as a feature in the model, i.e. the model is aware of whether a shot was taken in a men’s fixture or a women’s fixture
- Gender-specific: Two separate models – a men’s xG model trained on men’s data, and a women’s xG model trained on women’s data
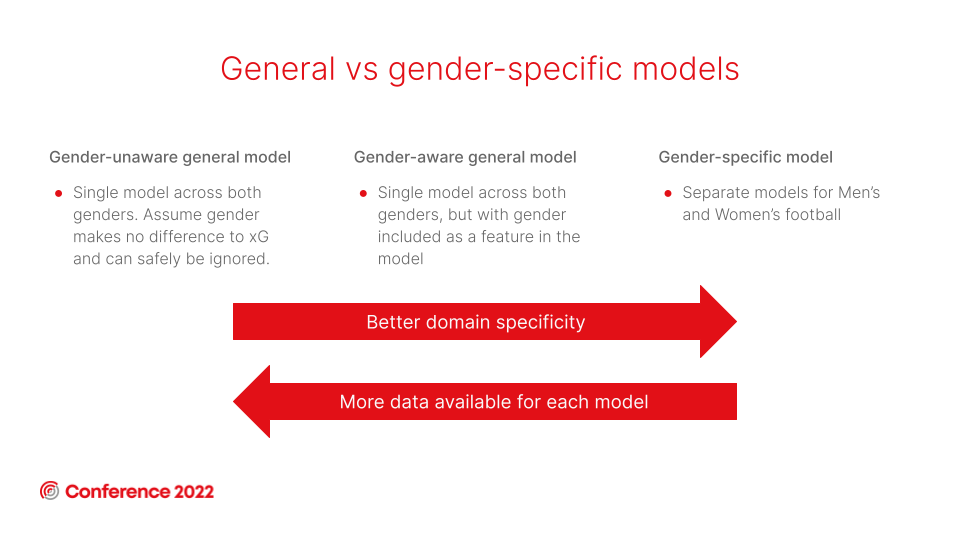
Each approach has its trade-offs. The gender-specific approach is trained on a smaller sample size of available shots, whereas the gender-unaware approach is trained on a larger dataset but is less domain-specific, meaning the model will be less specific to each of the men's and women's game.
To decide which model to use, we measured the performance of each approach empirically.
Dinesh Vatvani discusses the performance of each approach
We found that having separate models for the men’s and women’s games results in a less-performant xG model for both genders.
A men's xG model trained solely on men's data performs worse than one that's trained on a mixed men's/women's dataset.
A women's xG model trained solely on women's data performs worse than one that's trained on a mixed women's/men's dataset.
The caveat here is that it's possible this may change in the future as data volumes and subsequent sample sizes increase for both genders. But at this moment in time, the best-performing xG model with the most predictive power is the gender-aware model, trained on a dataset containing both men’s and women’s data but including a feature to make it aware of whether the shot is taken in a men’s game or a women’s game.
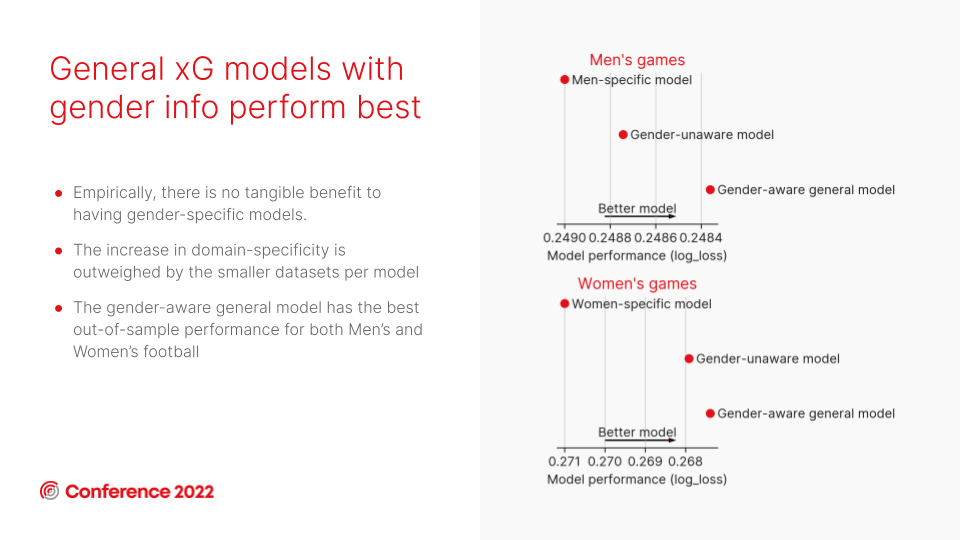
There are two reasons for this. The first is that the sample size available to train the data (approximately 1.6 million shots) is much greater. The second is that including the gender-aware feature allows the model to deviate from the mean xG when there is cause for a specific gender's xG estimate to deviate in response to a particular feature or variable. For example, if women are found to score headers from 10 yards more frequently than men, the model will make a correction/adjustment to the xG value specifically on shots in the women's game that fit those criteria.
And we can also see that this model is well-calibrated across a range of men’s and women’s leagues.
Dinesh Vatvani discussing the calibration of the gender-aware xG model
The results of this evaluation reinforce the view that these models are appropriate for use in the women’s game, although the calibration highlights that the NWSL is an outlier.
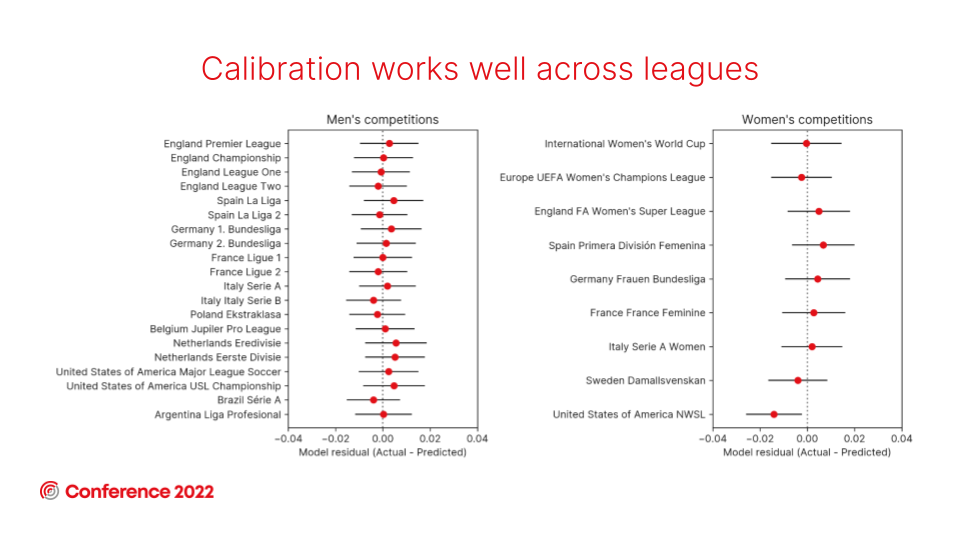
There are a few possible causes for the NWSL scoring slightly below expectation. The most likely is that roughly 25% of their league fixtures are played on astroturf as opposed to grass, which seems to influence goal rates within the league. Another factor is that some of the pitches in the league have some unusual dimensions, which could also affect the model’s performance in that competition.
The full presentation from our Head of Data Science, Dr. Dinesh Vatvani, at the 2022 Statsbomb Conference, titled “A deep dive into the new expected goals (xG) models” can be viewed here.
Profiling Passing In Women’s Football
Some previous examples of research conducted into the women's game have tended to focus solely on the differences between men's and women's football, treating women's football as somewhat homogeneous and ignoring any potential differences in league profiles that we acknowledge exist in the men's game.
To begin to correct that, we profiled passing in women's football leagues using our xPass model - a model that measures the likelihood of a pass being completed based on factors that affect the difficulty of the pass (e.g. the pass length, where on the pitch it occurred, whether it performed under pressure or not, etc.).
With that in mind, here is a quick exercise.
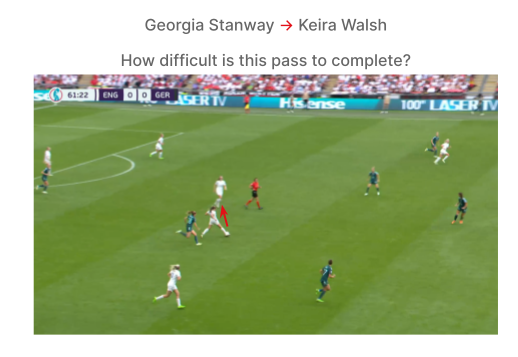
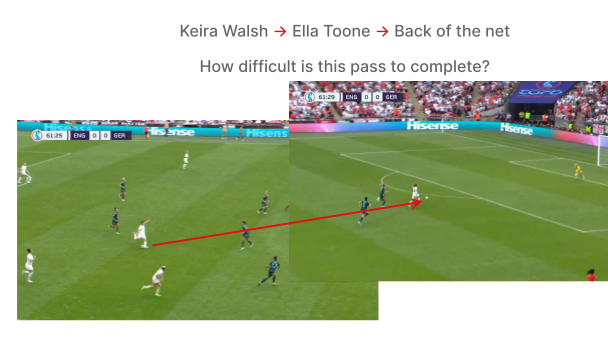
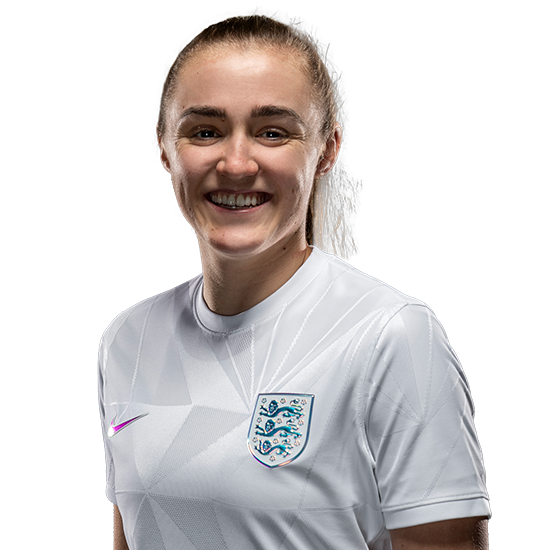
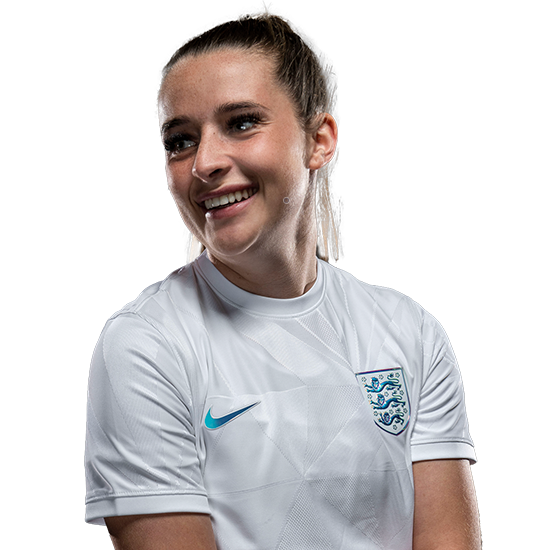
Let’s look back at the EURO 2022 final between England and Germany, and the build-up to Ella Toone’s opening goal.
The first pass from Georgia Stanway to Keira Walsh is short and backward and takes place well inside the England half. The second pass from Walsh is an exquisite throughball that puts Toone in behind the German defence.
How frequently do you think each pass would be completed out of 100 attempts? Answers revealed later in the article.
Back to the modelling. The clip below explains the modelling considerations and experiments run to inform the decision on how best to handle the women’s side of the game:
Will Morgan explains how the Data Science team experimented with their approach to the xPass model
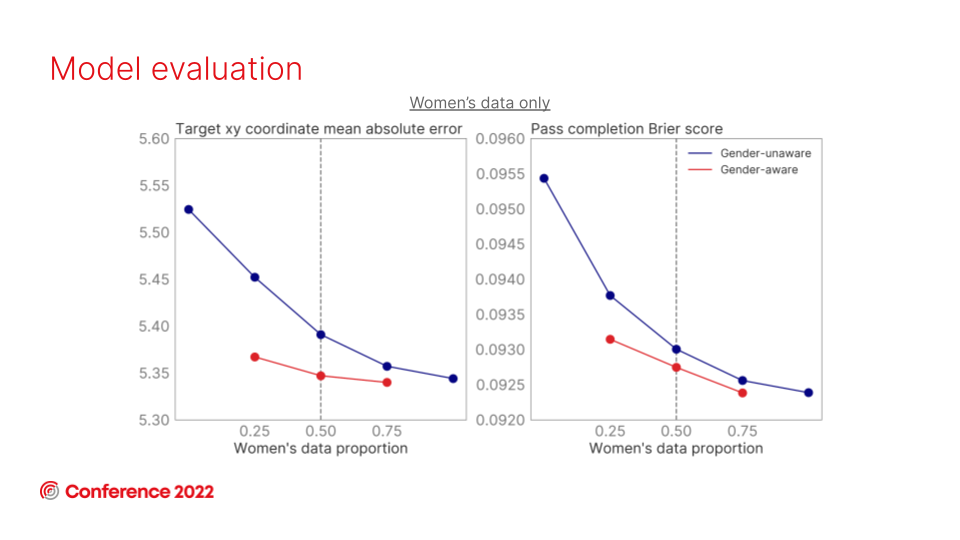
As with the xG models, the optimal and most predictive approach across both genders is to include a gender-aware feature in a combined training dataset that contains both men’s and women’s data.
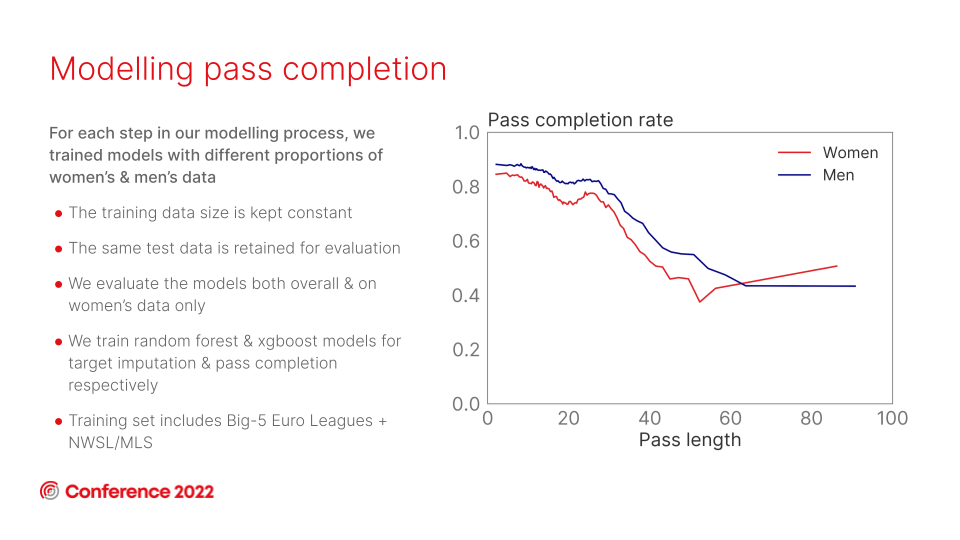
An interesting point to note - that differs from the xG models - is that the greater pass volumes available compared to shots means that training gender-specific models is a close second-best approach. In the xG models there is a considerable drop in performance when training gender-specific models from significantly reduced data volumes. The abundance of passing data means that the reduction in training data volumes from training gender-specific models has less of an impact on model performance, so is a much more viable approach in pass models than it is with xG modelling.
The clip below explains the results of the model evaluation, including another interesting outlier.
Will Morgan
The model is fairly well-calibrated across most competitions, and we see no significant difference in xPass performance between the men’s and the women’s games from this model. However, the appearance of both Italian leagues near the top of the table and both German leagues near the bottom suggests there could be some country-correlated baseline/calibration shifts going on.
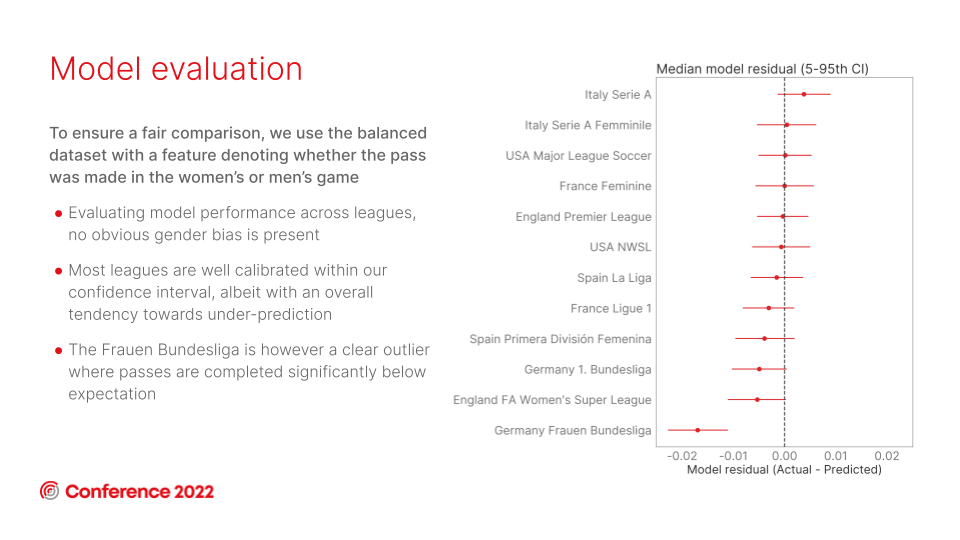
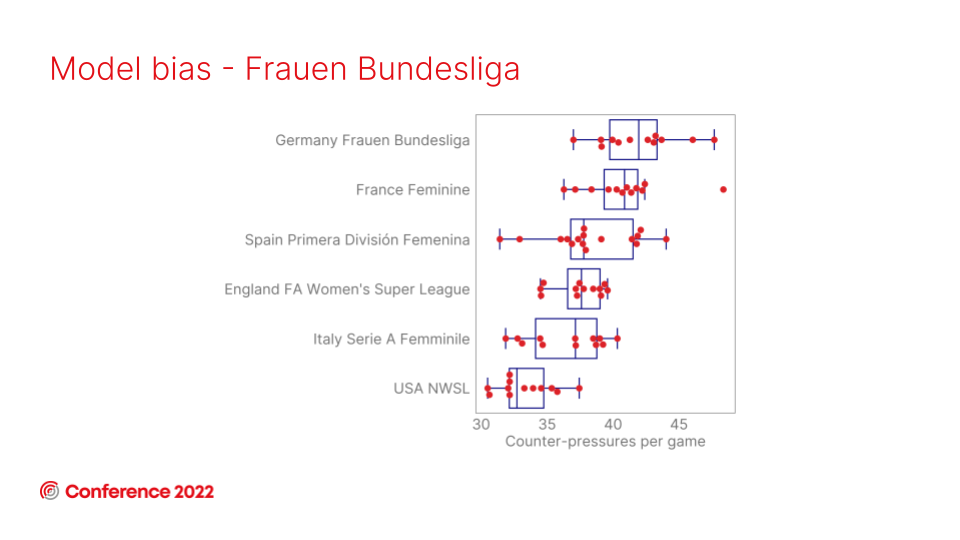
The big outlier here is the Frauen Bundesliga, which consistently completes passes below expectation. But, thanks to our pressure data, we can confidently explain that by acknowledging the larger number of pressures made during Frauen Bundesliga games, a factor that we know affects the difficulty of completing a pass.
Another major consideration for applying this model in the women’s game is the team strength bias in the model. In a sentence: the better the team, the more likely they are to complete passes above expectation; the worse the team, the more likely they are to complete passes below expectation.
Will Morgan
This is particularly important for the women’s game because of the reduced levels of competitive balance and parity within the leagues compared to the men’s. That is to say, there is more often a large difference in quality between the best and worst teams in women’s leagues than we see in their male equivalents..
Back to those passes at Wembley.
Here are the results from our xPass models:
Georgia Stanway’s pass came out at 97% xPass Completion (i.e., we’d expect the pass to be completed 97% of the time).
And Keira Walsh’s throughball had an xPass rating of 24%.
How accurate were your guesses?
Dr. Will Morgan’s full talk on “Profiling Passing In Women’s Football Leagues”, as presented at the Statsbomb Conference 2022, can be viewed here.
Thanks to the efforts of our Data Science team, we’ve been able to demonstrate the optimal modelling approaches in expected goals (xG) models and expected pass (xP) models across both men’s and women’s football to ensure that the analytics in the women’s side of the game is as developed as the men’s.
The key takeaway is that it’s important to acknowledge the differences between the two sexes when modelling, but that training separate models for each isn’t the optimal solution.
We’ll be back with more research and insight soon. In the meantime, you can get in touch if you want to discuss how our data and products can help you, access our free datasets, or, if you work for a women’s team in Europe's top five leagues, Sweden, or the USA, feel free to claim your free access to our analysis platform.

