14 runs. In the narrative of a Test match, five days of attrition and back and forth momentum, it is a total low enough to ensure that fans on both sides watched its conclusion with nerves shredded. Whilst not quite matching the parallels of Edgbaston 2005, it was a finish close enough to have left both sides harbouring genuine hopes of victory right until the very last ball was bowled.
Australia will be despondent, having hauled themselves back into a game more than once that looked as though it had slipped their grasp, whilst England will breathe a mighty sigh of relief at having avoided dropping the opening game of the a series that for all intents and purposes should have been theirs around an hour or so into the second day's play. Having now drawn breath and with the dust having settled, we can take a look at a key area of the game – partnerships – to assess where and how that absorbing Test may have been won. Heading into the series, England were very much written up as favourites. A stronger side in all areas was aligned with a more settled preparation as opposed to Australia's rather disjointed lead up, having done away with coach Mickey Arthur just a fortnight or so before the first Test. The Australian hopes were centred primarily around their promising pace attack. With England's occasional habit of collectively batting below par, particularly in the first Test of a series, Australia sensed an opportunity. The difficulty for the visitors is that, in comparison to their bowling, their batting line up does not possess either the depth of quality nor the solidity that England's does. In fact, heading into the Test, their order was still not fully known, perhaps even to themselves. Could their top six really put the runs on the board to make a sustained effort at getting the better of England's attack? Here is the fall of wicket breakdown for both sides over both innings:
Aggregate Runs And Fall Of Wicket Table
| England 1st inns | Australia 1st inns | England 2nd inns | Australia 2nd inns | |
| 1st Wicket | 27 | 19 | 11 | 84 |
| 2nd Wicket | 78 | 19 | 11 | 111 |
| 3rd Wicket | 102 | 22 | 121 | 124 |
| 4th Wicket | 124 | 53 | 131 | 161 |
| 5th Wicket | 178 | 108 | 174 | 161 |
| 6th Wicket | 180 | 113 | 218 | 164 |
| 7th Wicket | 213 | 114 | 356 | 207 |
| 8th Wicket | 213 | 114 | 371 | 211 |
| 9th Wicket | 213 | 117 | 375 | 231 |
| 10th Wicket | 215 | 280 | 375 | 296 |
We can see a breakdown of how the runs for each sides two innings were accumulated:
Runs And Fall Of Wicket Graph
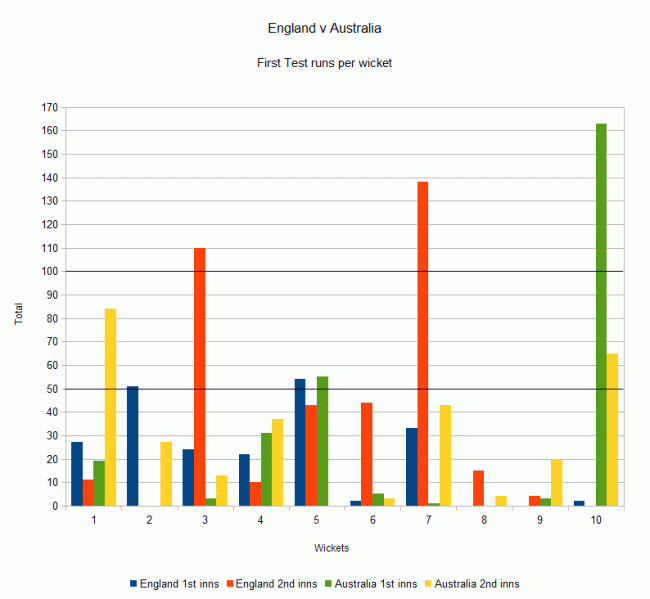
It is evident that with the exception of Australia's last wicket partnership in both innings, the lower orders struggled to put together a sustained partnership at any point, with the line of progress almost flat. This will concern England, whose lower order (after Matt Prior) have struggled of late. It shows that although steady progress was made for the early wickets, without the Ian Bell/Stuart Broad partnership on day three and four, England would have been setting Australia a far more reachable total. If Australia had concerns heading into the series regarding their top six, the first Test will have done nothing to allay them. In the game as a whole, only the opening partnership in the second innings between Shane Watson and Chris Rogers was of any note. While England were grateful for Bell and Broad, without the heroics of Ashton Agar along with Philip Hughes, Australian hopes would have been sunk long before Brad Haddin edged to Prior off James Anderson. We can now also see the breakdown of runs per wicket, which further highlight where both teams struggled
Runs Per Wicket Partnership Graph
Six partnerships in the game exceeded 50; the aforementioned tenth wicket Australian ones, Bell/Broad, Watson/Rogers and the measured third wicket partnership between Alastair Cook and Kevin Pietersen. In a game that saw the sides separated by just 14 runs, partnerships such as these were key. In the end, despite Agar and Hughes, England's two key wickets proved enough. If we split each innings into two parts - the first six wickets (when the tail end enters) and the final five wickets - we can look at the weighting of runs that the top six wickets contributed:
Percentage Of Runs By Top 6 Wickets Table
| England 1st inns | Australia 1st inns | England 2nd inns | Australia 2nd inns |
| 82.79% | 38.57% | 46.40% | 54.39% |
Moving forward into the remainder of the series, the two first innings percentage totals will concern both sides. For England, the over reliance on the top six is not sustainable over a series to consistently post match winning totals. For Australia, unless their top six can improve and post totals to compete with England, they will be playing catch up too often to have a realistic chance of recovering the series. It was a Test match that provided wonderful narratives throughout, but in the cold light of day as we head to Lords, batting will remain a major concern for both sides.


