One of the things that makes StatsBomb data unique is that we have defensive positioning data for every shot. The challenge is rigorously translating the freeze frames that capture that positioning into usable information about how defensive pressure impacts the players taking the shots.
Defining the Problem
To start, we need to define what specifically pressure means. Obviously we’re looking at defenders within a certain radius of a shooter. Our first challenge is defining the distance around the shooter that we should examine. Adjusting the Pressure Radius (PR) for arbitrary distance categories would unjustly increase or decrease the radius for shots just inside or just outside a given category. Therefore, we create a piecewise linear function for all shots. This is defined as:
– PR = DFG*0.15 + 0.85 for DFG <= 24 (where DFG = distance from goal)
– PR = 4.5 for DFG > 24.
– In other words, it is the straight line from the point (PR, DFG) of (1, 1) to (4.5, 24).
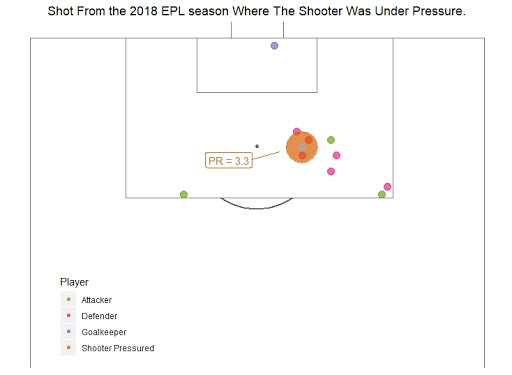
The PR is relatively arbitrary, but intuitively defined. It is designed to differentiate pressure at different positions on the pitch and with further research can be easily modified to best model defensive pressure. In simplest terms, the closest to the goal you are, the closer defenders must be to pressure you and influence your shot and the further away from the goal you are defenders may be slightly further away in order to impact a shot.
Here is an example of what that radius looks like:
Pressures from each side
In addition to dealing with distance, we also need to separate out the pressure defenders apply by direction. The idea here is to more specifically understand both how pressure effects change goal scoring probabilities and also how they interact with a shooter’s own tendencies. If we take the circle around the shooter with radius = PR as defined above, then we can define pressure from four different sides as:
– Pressure Left = AngleToShooter > 315 and AngleToShooter < 45.
– Pressure Behind = AngleToShooter >= 45 and AngleToShooter <= 135.
– Pressure Right = AngleToShooter > 135 and AngleToShooter < 225.
– Pressure Front = AngleToShooter >= 225 and AngleToShooter <= 315.
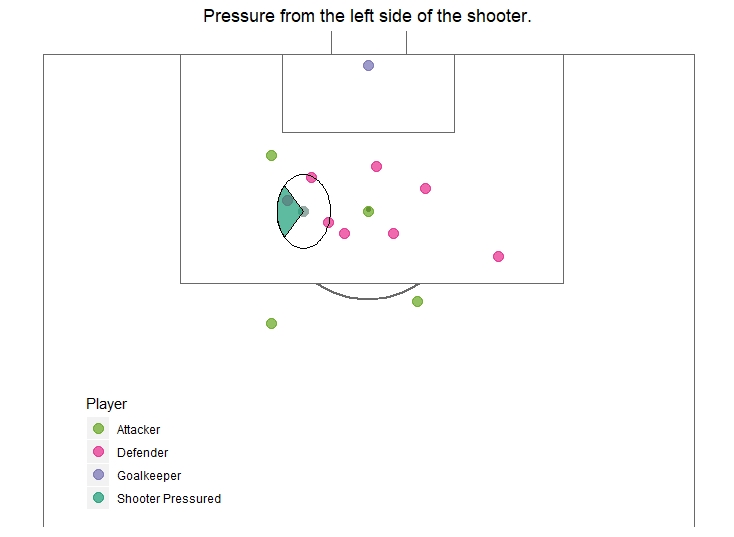
We will later see how the pressure from each of these sides influences a player’s decision of shooting foot and the observed goal rates. For example, here is a shot that had pressure from the left of the shooter.
Overall Shot and Goal Rates Under Pressure
After testing the pressure metrics both visually and numerically we apply the pressure values to all shots in our data set, and then view some summary statistics. Please note that all results below only reflect shots in the run of play.
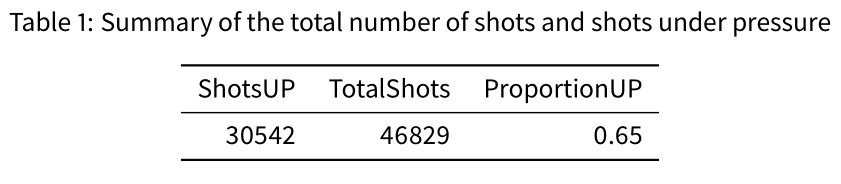
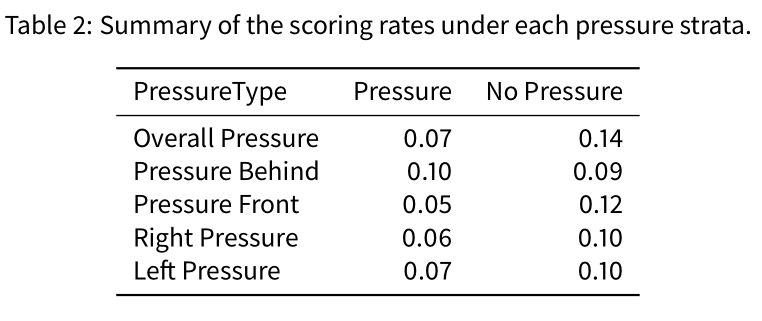
In the tables above we can see that roughly 65% of all shots, under this definition are “under pressure”. We can also see that a significantly higher proportion of goals are scored in the absence of pressure than under pressure. The only angle that does not have a higher proportion of goals scored is the pressure behind the ball which would make sense, since the pressure behind the shooter is not disrupting the view to goal.
The Cool Stuff We Found
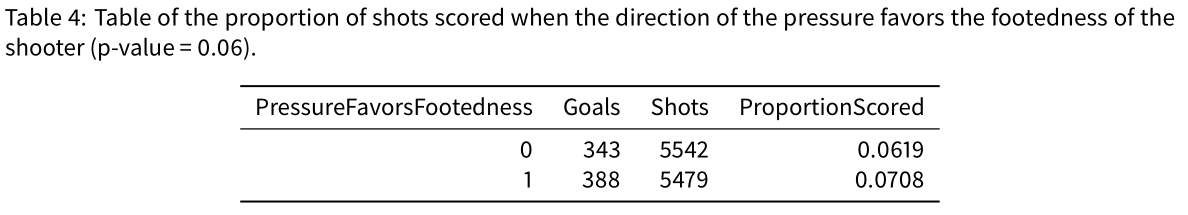
Once we define “under pressure” values for all of our shots, we can analyze a multitude of different aspects of the game and the player. First, we will look at whether the direction of pressure has any impact on the player’s choice of foot to shoot with. Furthermore, we look at whether the combination of the player’s dominant foot, shooting foot and direction of pressure has a significant relationship with the proportion of shots that become goals. We view the results in the tables below.
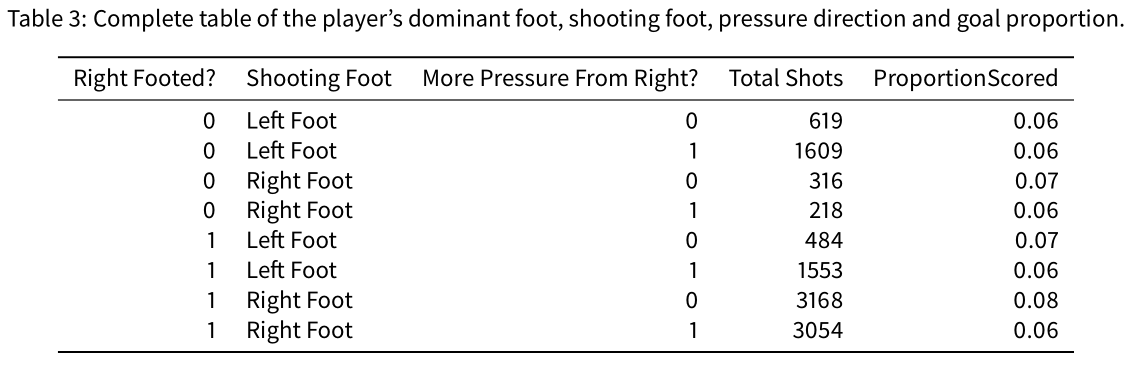
When the pressure from the left is greater than the pressure from the right, the proportion of shots taken with the player’s right foot is about 75%. When the pressure from the right is greater than the pressure from the left, the proportion of shots taken with the player’s right foot is still greater than 50% at approximately 50.2%. An obvious explanation for this is the vast majority of right footed players continuing to want to shoot with their right foot regardless of the pressure. Interestingly enough, we see in Table 3 that the highest proportion of goals are scored when a right footed player gets off a shot with his right foot and there is less pressure on the right side.
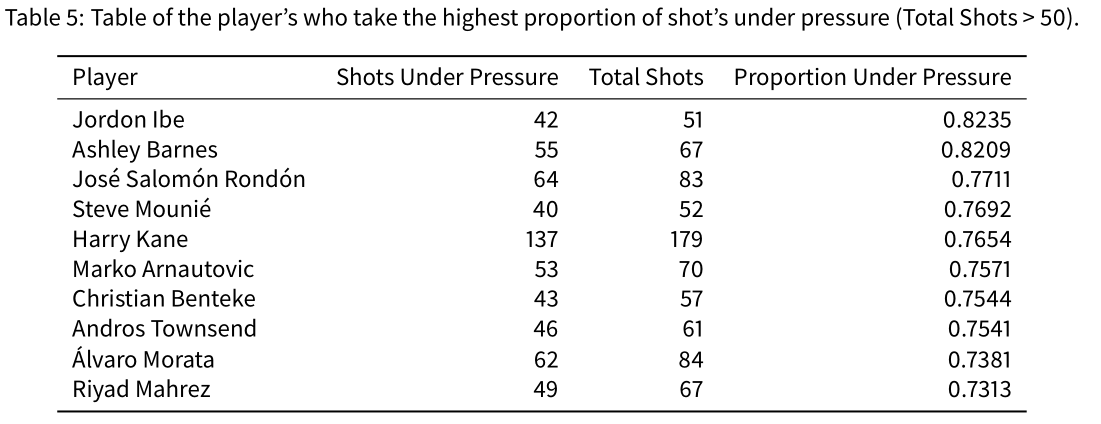
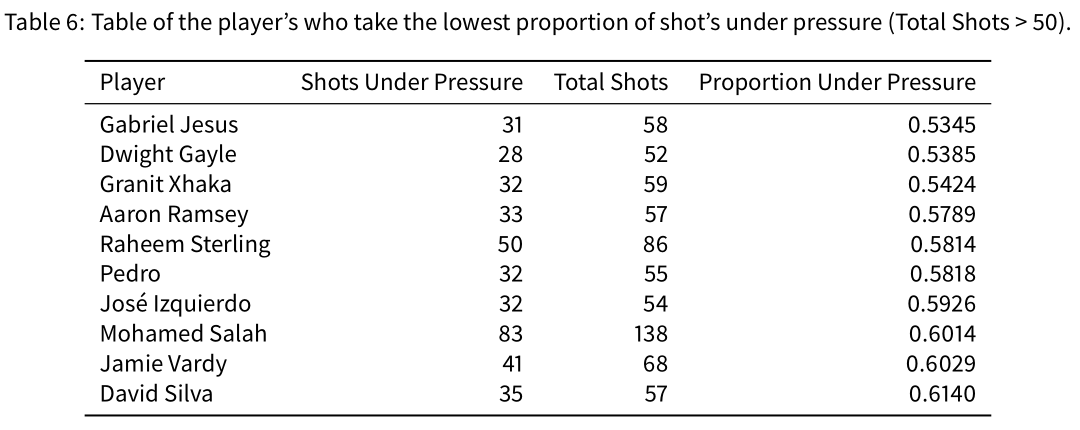
The next thing we wanted to look at with shots under pressure were the raw numbers on a player level. Which players players are trigger happy and will pull up regardless of who’s around? Which players are more selective with their shots? Or, which players happen to find themselves in better places to get shots off without defenders breathing all over them. Using 2017-18 Premier League numbers, the 10 players who take the greatest proportion of shots under pressure are summarized in table 5 and the 10 players who take the lowest proportion of shots under pressure are in table 6.
This pressure data contains tons of interesting information about what exactly is happening and players put the ball on net. There are certainly further factors that can be worked in too. This is only the beginning of the kind of information that we can glean from how players are pressured as they take shots.