Thanks to Ted Knutson's work, we know the players with the best attacking output between 2008/09 and 2012/13. (For all the usual reasons I hesitate to say the "best attacking players".) But his litany of superstars (a few surprise names notwithstanding) says nothing about how we should evaluate the performance of more ordinary players. We know Olivier Giroud isn't as good as Messi, but can we quantify that gap? And how does he compare to the rest of the field? In short, we need to see how the basic performance metrics are distributed across all players in the game. This is what I'm setting out to do, in what will hopefully be a series of articles. Today, I focus on attacking production, ie. goals and assists.
I use two simple metrics that you probably have seen before: non-penalty goals scored per 90 minutes spent on the pitch (NPG90), and non-penalty goals plus assists per 90 minutes (NPG+A90). Ted has already written about the need of discounting penalty goals from analyses and the importance of normalisation by time in the article linked above, so I don't have to. Naturally, normalisation for other factors, most notably team and opponent strength, would be nice, but I don't do it since there is no canonical method of doing so. Caveat emptor.
The dataset I used consists of players from the five big European leagues, and spans almost five full seasons (full 2008/09 to 2012/13 and 2013/14 until last weekend). For this article I restricted it to the players who can reasonably be termed "attackers", because I didn't want the low attacking output of defenders and deeper midfielders to overwhelm the distributions. The actual algorithm used to determine whether a player should be counted is rather complex, and I will not describe it here, except to say that it did not rely on the goal and assist numbers and so didn't introduce bias. I wouldn't expect it to be 100% accurate, but the collection of players considered here should contain most forwards, wingers and purely attacking midfielders from my dataset. Playing 900 minutes or more over the course of a season was also required for inclusion in this study.
The histograms of NPG90 and NPG+A90 are shown below:
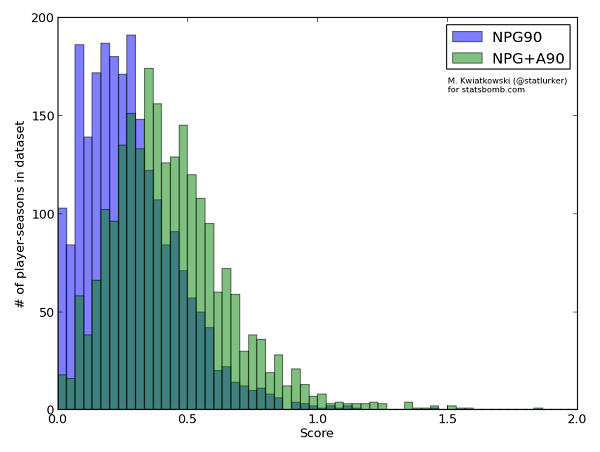
(NPG90 mean: 0.28, std dev: 0.18; NPG+A90 mean: 0.44, std dev: 0.23)
Now, I am not a statistician, but to my eye both distributions resemble the normal distribution, but with the left side thinned out and the left tail chopped off by the boundary. This makes sense intuitively: with the multitude of factors contributing to player's performance we'd expect it to be normally distributed; and the missing players in the left half are simply those who are not good enough for a team in Europe's big 5 leagues, and ply their trade elsewhere.
Another, and perhaps better way of visualising this data is the cumulative distribution plot: 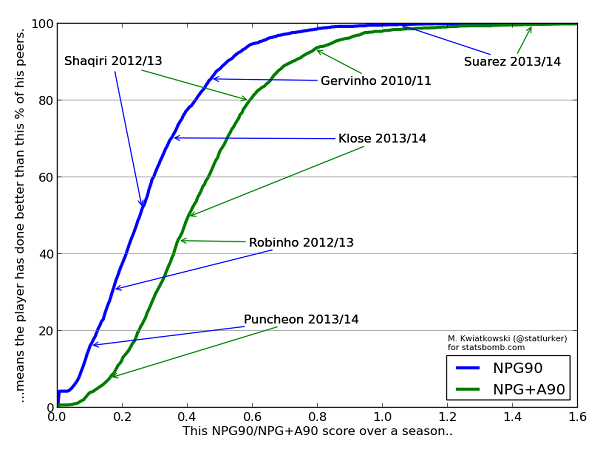
Here we can see for example that to be in the top 20% of attackers in Europe, a player should score at least at the rate of 0.42 goals per 90 minutes, and have a "goal involvement rate" of 0.59 per90 (NB. For a top-class #9, these numbers are not enough -- they are biased downwards by all the midfielders in the dataset). We can also see why Arsenal believed in Gervinho, and that Miroslav Klose is not doing badly for a 35 year old.
With thanks to Ted Knutson for discussions on this subject. Data collected by ![]() .
.