Not all leagues are the same. We know this from looking at different shot profiles between leagues, different levels of parity between leagues, and of course just from watching different leagues ourselves. This creates a problem when we want to compare different players who play in different leagues. Is a goal in La Liga worth the same as a goal in the Premier League? It’s hard to know and we usually base our opinions on these issues by anecdotally comparing the performances of players who have played in multiple leagues. There are better ways however to do these comparisons using data.
Let’s start with the problem of comparing an attacking player in the Premier League to one in La Liga. There are certain metrics we look to when assessing attacking players, namely: goals, assists, key passes and shots. So once you have these metrics for a particular season of the two players you need some sort of system to sort out the differences in the two leagues.
The first solution is to divide by the average player in that league. This way we can see how much better or worse the player is than the average player in their league. This is something I looked at with more depth a few months ago with a statistic called weighted chances created, and found that it was a good way of predicting future performance. The problem is that calculating averages has severe limitations, mainly that it doesn’t say anything about the distribution of a sample.
Consider two data sets of only two sample points. The first is (0,10) the second is (5,5). The two data sets both have the same average, 5, but they have very different distributions.
To return to our Premier League and La Liga players consider that the top goal scorers in La Liga (Ronaldo and Messi) habitually score more goals than the top goal scorers in the Premier League despite the two leagues having a roughly equal number of total goals scored. Since the two leagues have about the same number of total goals scored and the same number of players the average number of goals scored by any given player will be almost the same. However, we know that good players score more goals in La Liga than the Premier League thus they will be further above the league average without necessarily being better players. How do we control for this?
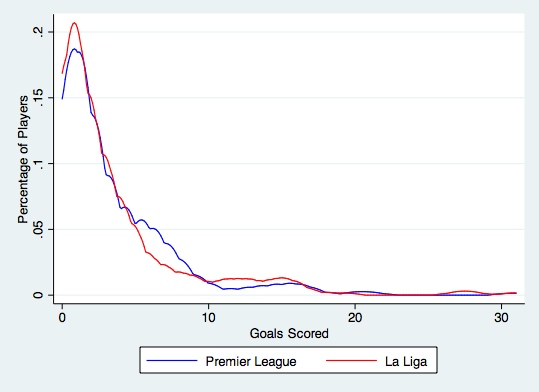
The answer is to consider the distributions of the goal scorers in the two leagues. We can do this visually using density plots, which graphs number of goals along the x-axis and the percentage of players that scored this many goals along the y-axis.
The following density plot looks at goals scored by player in the 2013-14 La Liga and Premier League seasons (note: only players who played in at least nineteen matches are considered).
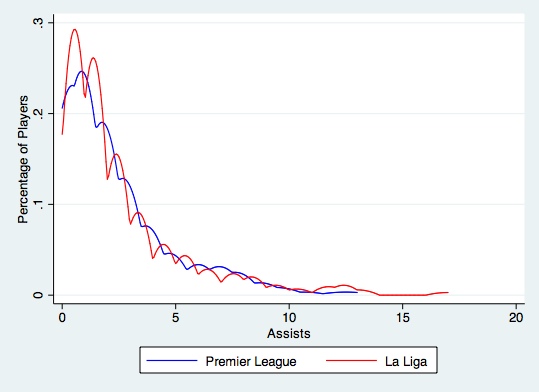
In a similar fashion this density plot looks at assists from the 2013-14 La Liga and Premier League seasons.
As you can see the two distributions follow similar patterns, but there are slight differences which can be quite significant when making a judgement call about which player performed better given their environment. As an aside the shapes of these distributions resemble what are often called “Poisson Distributions” in applied statistics.
To numerically factor in these differences in distribution we can use a measure called a standard error. A standard error or standard deviation measures the amount of variation from the average. The higher the standard error the more spread out the data points are from the average and vice-versa. Given our previous hypothesis that there is more variation in goal scorers in La Liga than the Premier League we’d expect the standard error for La Liga goal scorers to be higher.
This turns out to be true. In 2013-14 the standard error of the distribution of goal scorers in La Liga is 4.79 and in the Premier League it is 4.24. For assists the corresponding standard errors are 2.80 in La Liga and 2.43 in the Premier League.
Now we can use a technique to standardize these distributions. Instead of looking at absolute number of goals a player scores above the average we can look at the number of standard errors a player’s goal total is above the average.
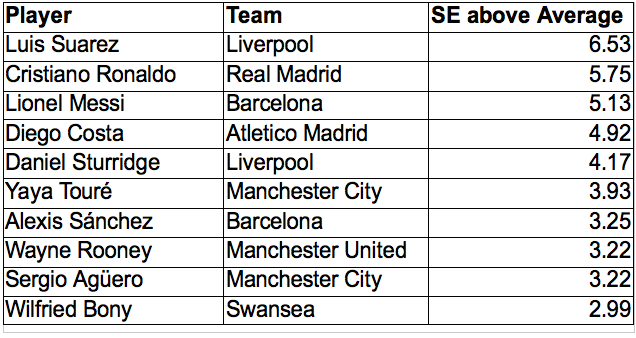
For example in La Liga the average number of goals scored by a player in 2013-14 was 3.45, Ronaldo scored 31 goals. So with a standard error of 4.79 we say that Ronaldo scored 5.75 standard errors above the league average.
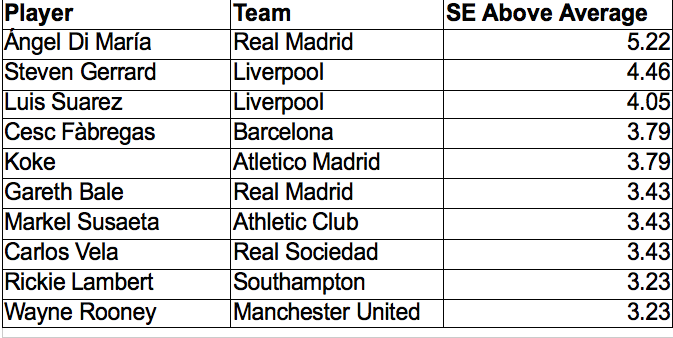
Now we can compare our Premier League and La Liga players by putting them on a single leaderboard in order of standard errors above the league average.
Goals
Assists
Using this Standard Errors above average formula we can compare players from two different leagues while controlling for internal factors within the league.
There are two caveats with using standard errors above average in the way I’ve done so here.
The first is that I’ve used raw goal and assist numbers as opposed to per90 scoring rates. I’ve done this so the numbers are a bit more familiar and illustrate the concept, however we have plenty of evidence to suggest per90 rates are much more predictive of future performance than the raw numbers. So in actually comparing players for scouting purposes it would probably be better to use the same calculations but for scoring rates not number of goals scored.
The second thing to be aware of is an inherent assumption I made about relative quality. Using standard errors only controls for the distribution of goals within the league and does nothing to control for the relative levels of play. In this analysis I’ve made the assumption that the skill level in La Liga is roughly the same as the Premier League. This isn’t a ridiculous assumption to make for these two leagues, but once we cast our net further across the globe this assumption will no longer hold.
This is probably where the next step of cross-league analytics needs to go. There needs to be more research into how players perform in different leagues and how transitions from league-to-league go. We have the UEFA coefficients to compare leagues right now, but these are very limited and extremely flawed for a variety of reasons I’m not going to get into here.
As it seems with every question in football analytics the answer breeds more questions that really can only be solved with more and better data.


