
It's reasonable to think that headers have been somewhat overlooked by the analytics community as attention progressed from shooting towards passing, pressing and dribbling. Despite this, they remain an important component of the game with strong variations between competitions across the world. In this article we're looking at a variety of recent league seasons, covering the wide range of competitions that StatsBomb collects.
Analysis
Presented below is the average number of headers per game for each competition split by season. I grouped the competitions to aid comparison and kept the scale constant for each visualisation. Competitions are ordered by their average across the seasons shown.
England & Scotland
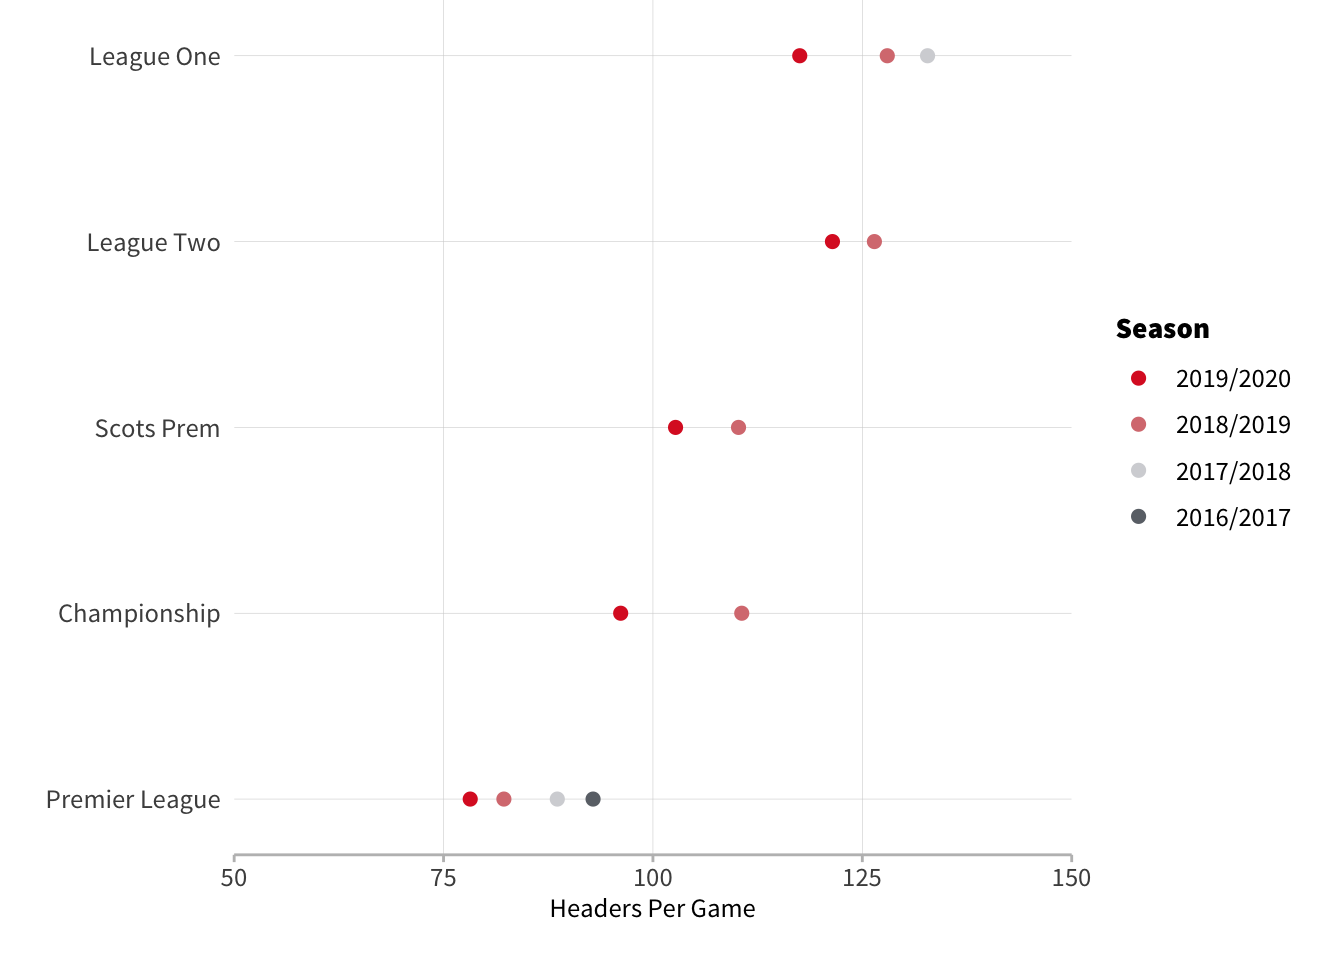
No surprises with the British competitions and we can see a consistent increase in the number of headers per game as we go down the tiers.
There’s actually not much difference once you get down to League 1 and League 2, and in 2018/19 both leagues saw roughly 40 extra headers each game than the Premier League. Indeed, League 2 is responsible for the highest number of headers recorded in a match per our dataset - Macclesfield v Northampton this season had 235 headers equating to roughly one every 23 seconds. If you’re struggling to believe that a professional football match had this many headers then watching the first 30 seconds of the match should clear up any doubts:

The lowest number of headers is the 10 from PSG v Nice last season. Typically the variation between games isn’t as extreme as those edge cases. The standard deviation on a game by game basis ranges from 15 in Colombia’s first tier to 30 in the Scottish Premiership.
The Big 5
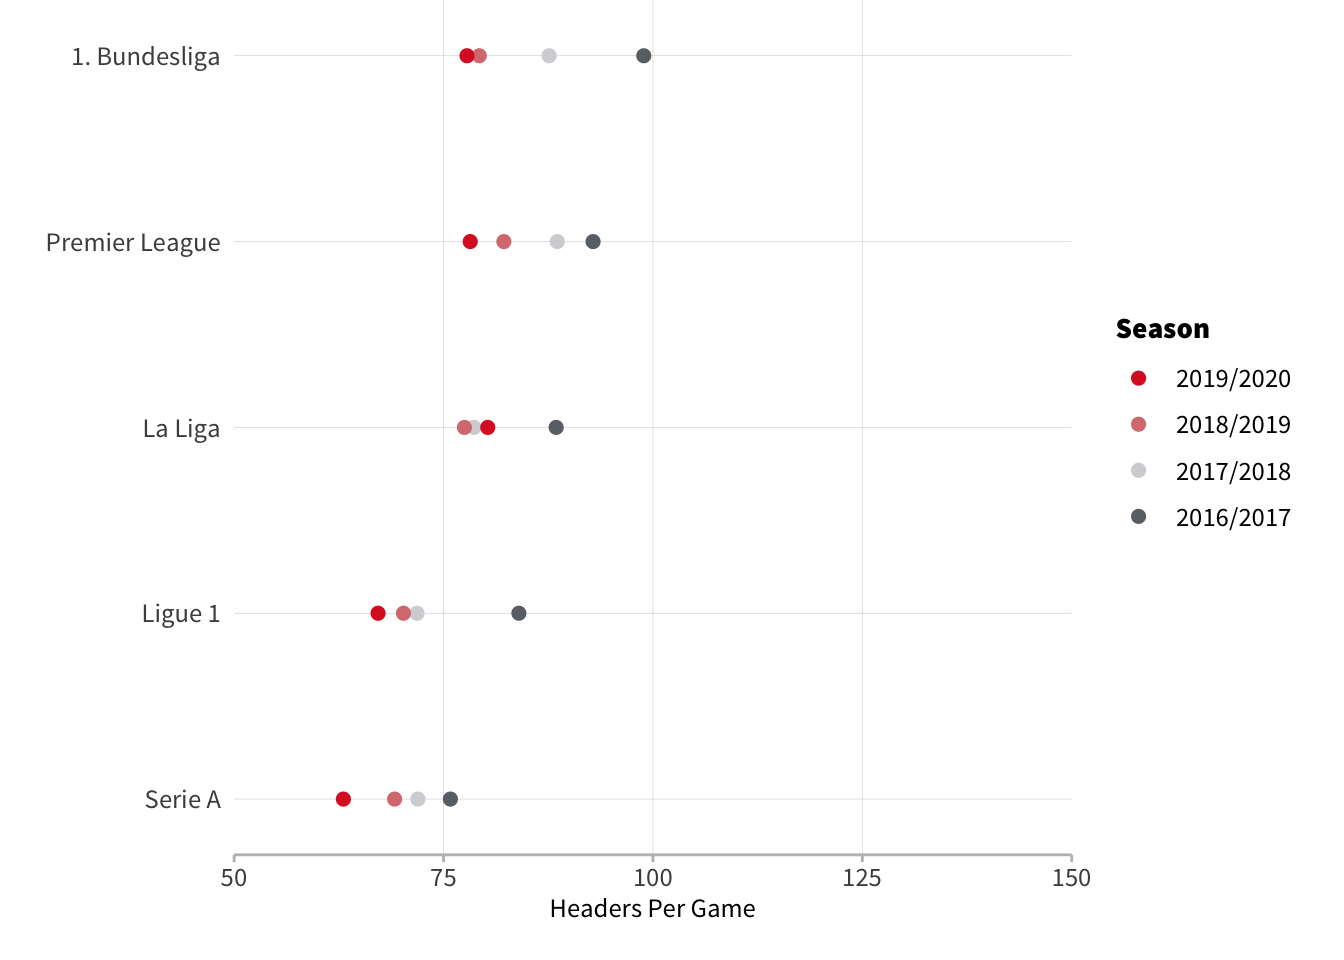
Across the Big 5 we can see the Premier League, Bundesliga and La Liga showing very similar heading tendencies whilst Ligue 1 and Serie A appear to occupy their own group with slightly less heading than the other three.
The Rest of Europe

Most European leagues are hovering around 75 headers per game which aligns more with the Big 5 than what we see in the UK’s lower tiers but there are pockets of stylistic difference, namely in the Austrian Bundesliga and Czech Liga.
Second Tiers
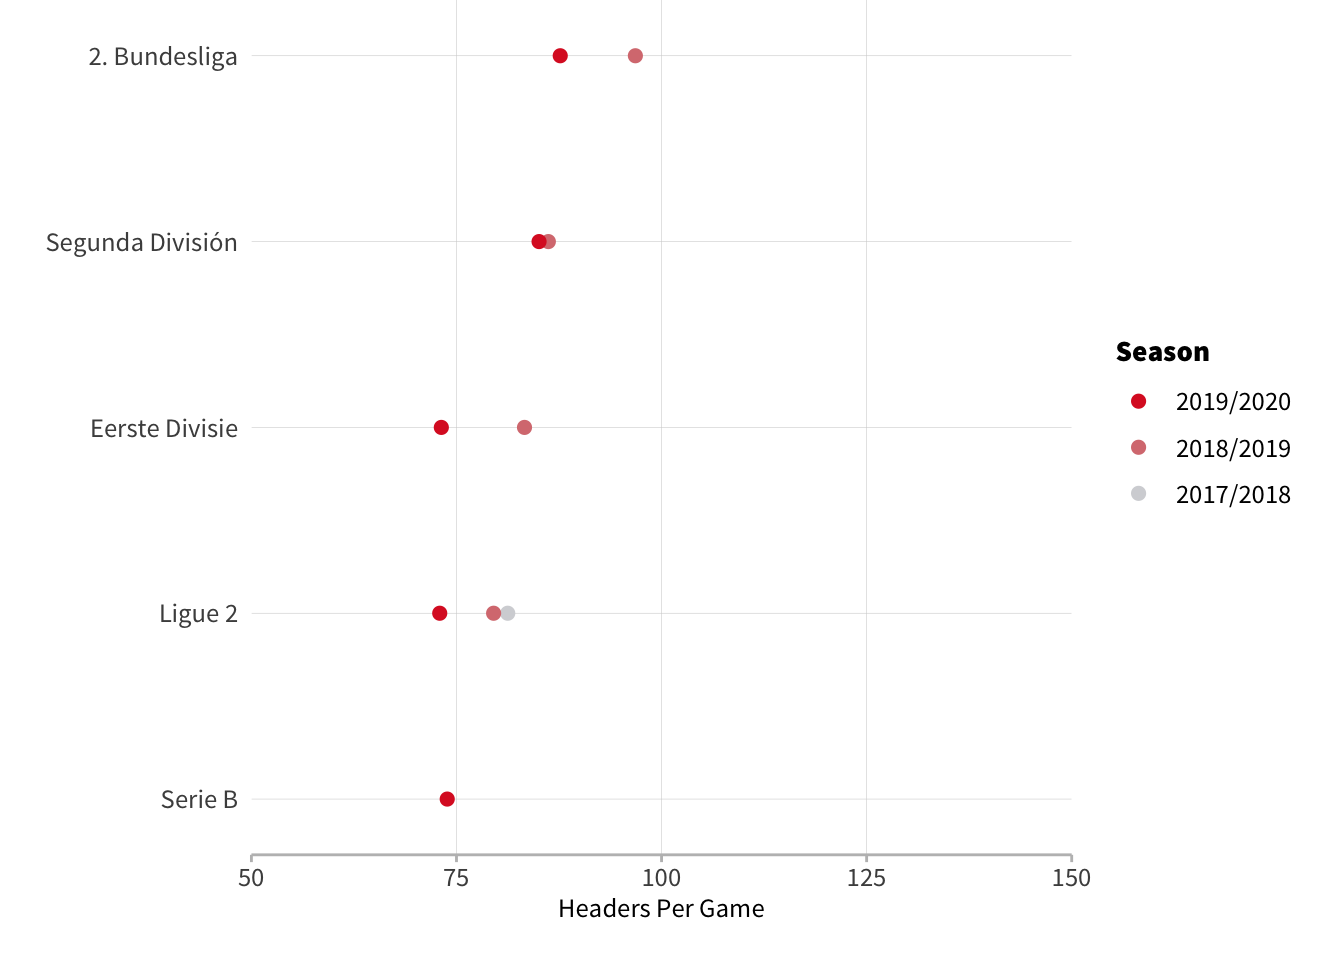
Looking at second tiers we see both Germany and Spain average more headers in their second tier than their top league which mirrors what we see in England. Elsewhere, France, Italy and the Netherlands however have similar averages in their second tier as they do in their top league implying style of play is more consistent across levels in those countries.
Americas and Australia
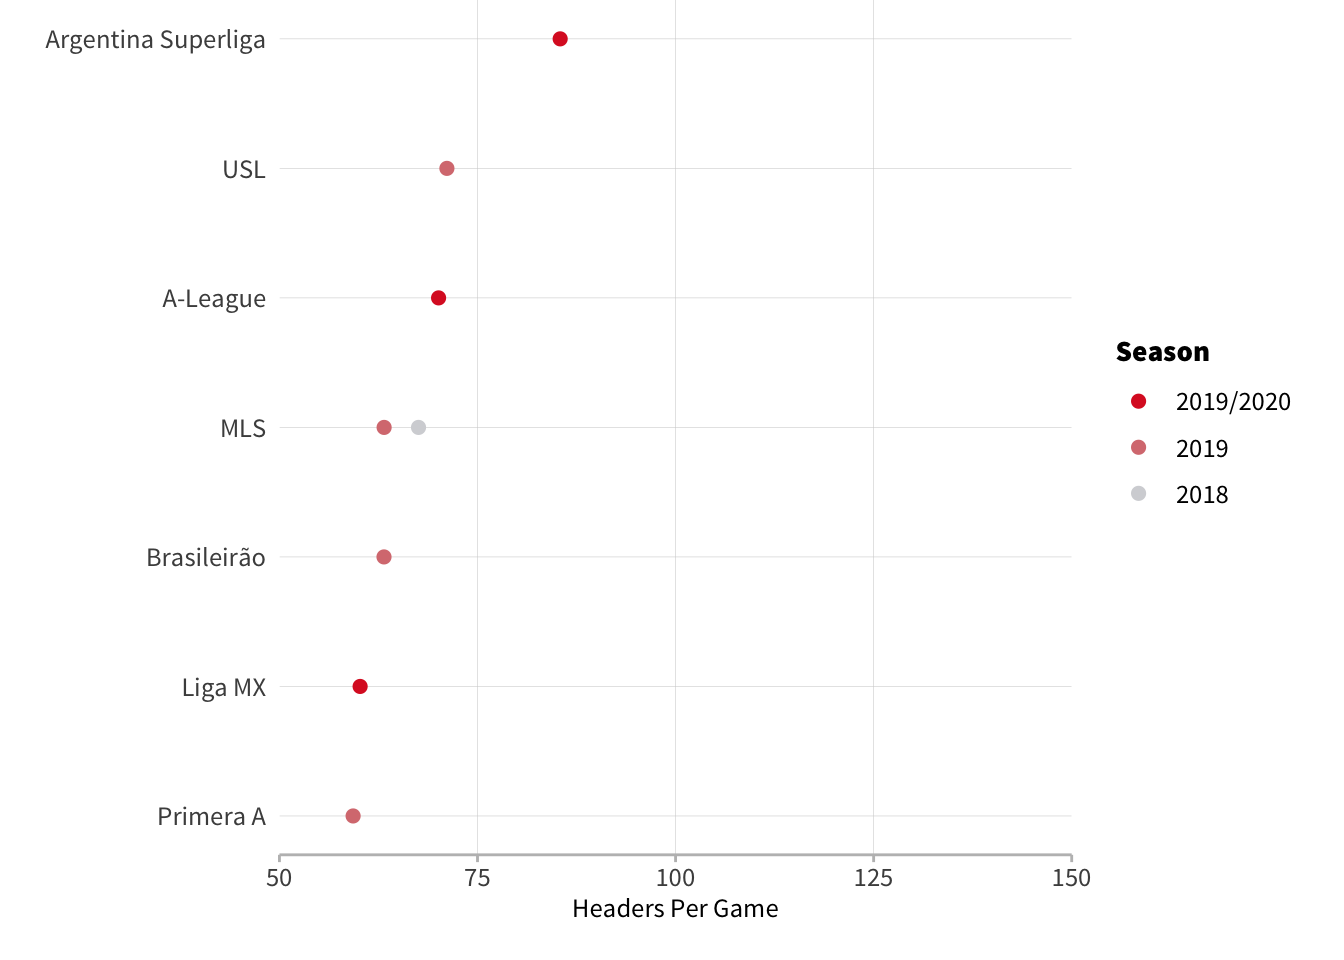
These leagues represent the least aerially active competitions in the men's game - Colombia and Mexico in particular see very few headers. Interestingly, Argentina sets itself part from the other two South American countries with roughly 20 more headers per game.
Women’s Football
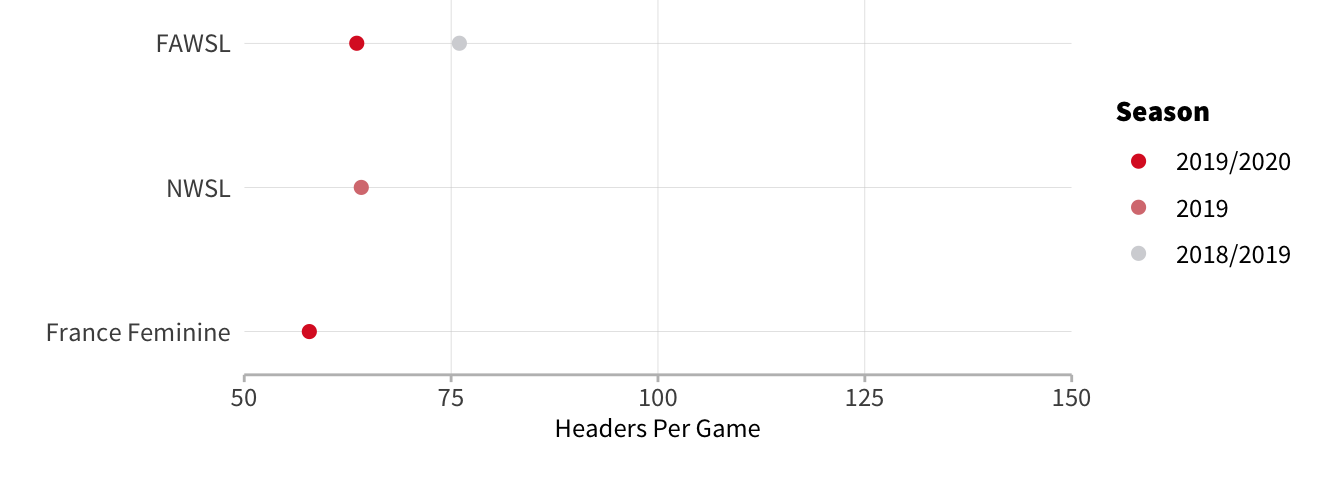
All three competitions have low header numbers, similar to what we saw in the Americas. France actually has the lowest number headers per game in the dataset ahead of the mens' leagues in Colombia and Mexico.
Spatial Trends
Let's see if there are any locational differences between the leagues covered here:
Men’s Competitions
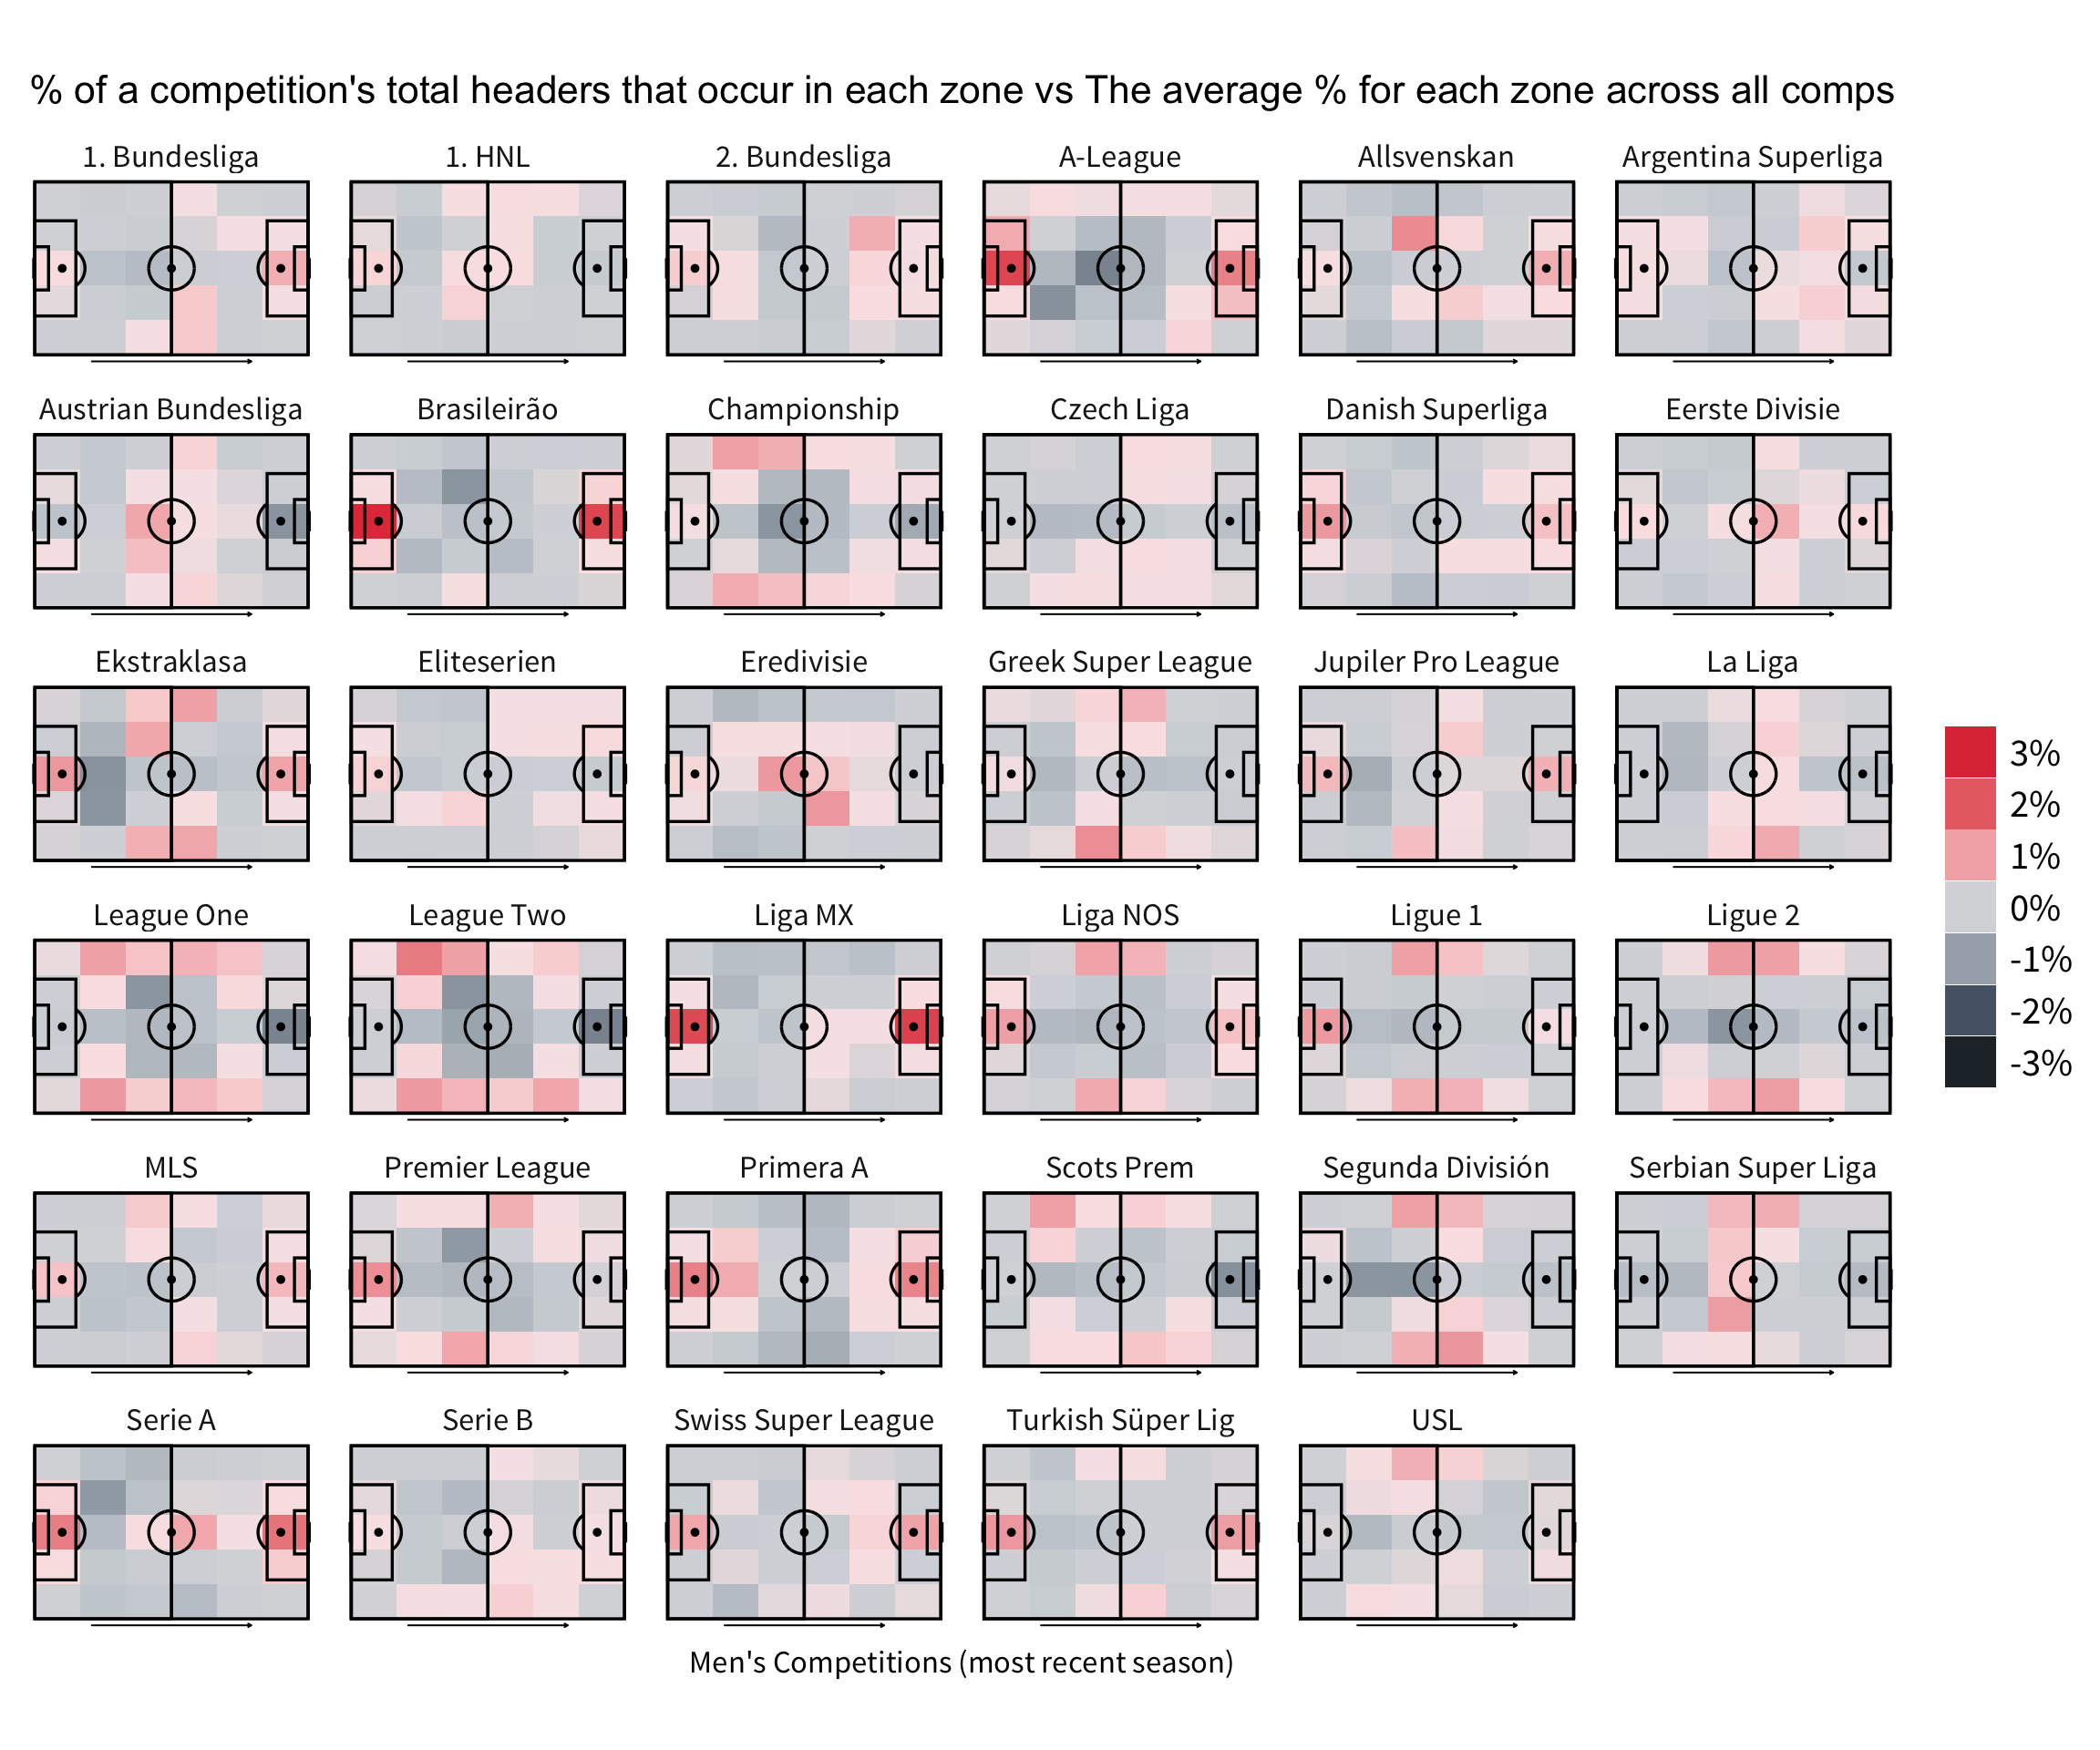
First thing to note is that there’s really not much difference between leagues in terms where their headers take place. At most you’re looking at a three percentage point difference for a zone. That being said, there are a few noticeable clusters.
Firstly, you’ve got the leagues that have a higher proportion of headers inside the box such as Brazil and Mexico. Both these leagues had very low overall header numbers and it seems that heading in those leagues mostly comes from crosses into the box. The UK leagues all show similar patterns with more headers coming in the channels where you would expect the fullbacks to be. If you watch UK lower league football you’ll notice that there’s a lot more long balls into the channel and this seems to support that pattern.
The final cluster has more headers around the half-way line than normal - France, Netherlands, Austria. I’m not totally sure why this might occur, maybe those leagues are willing to clear the ball back the half way line more or aim long goal kicks there more frequently.
By Region
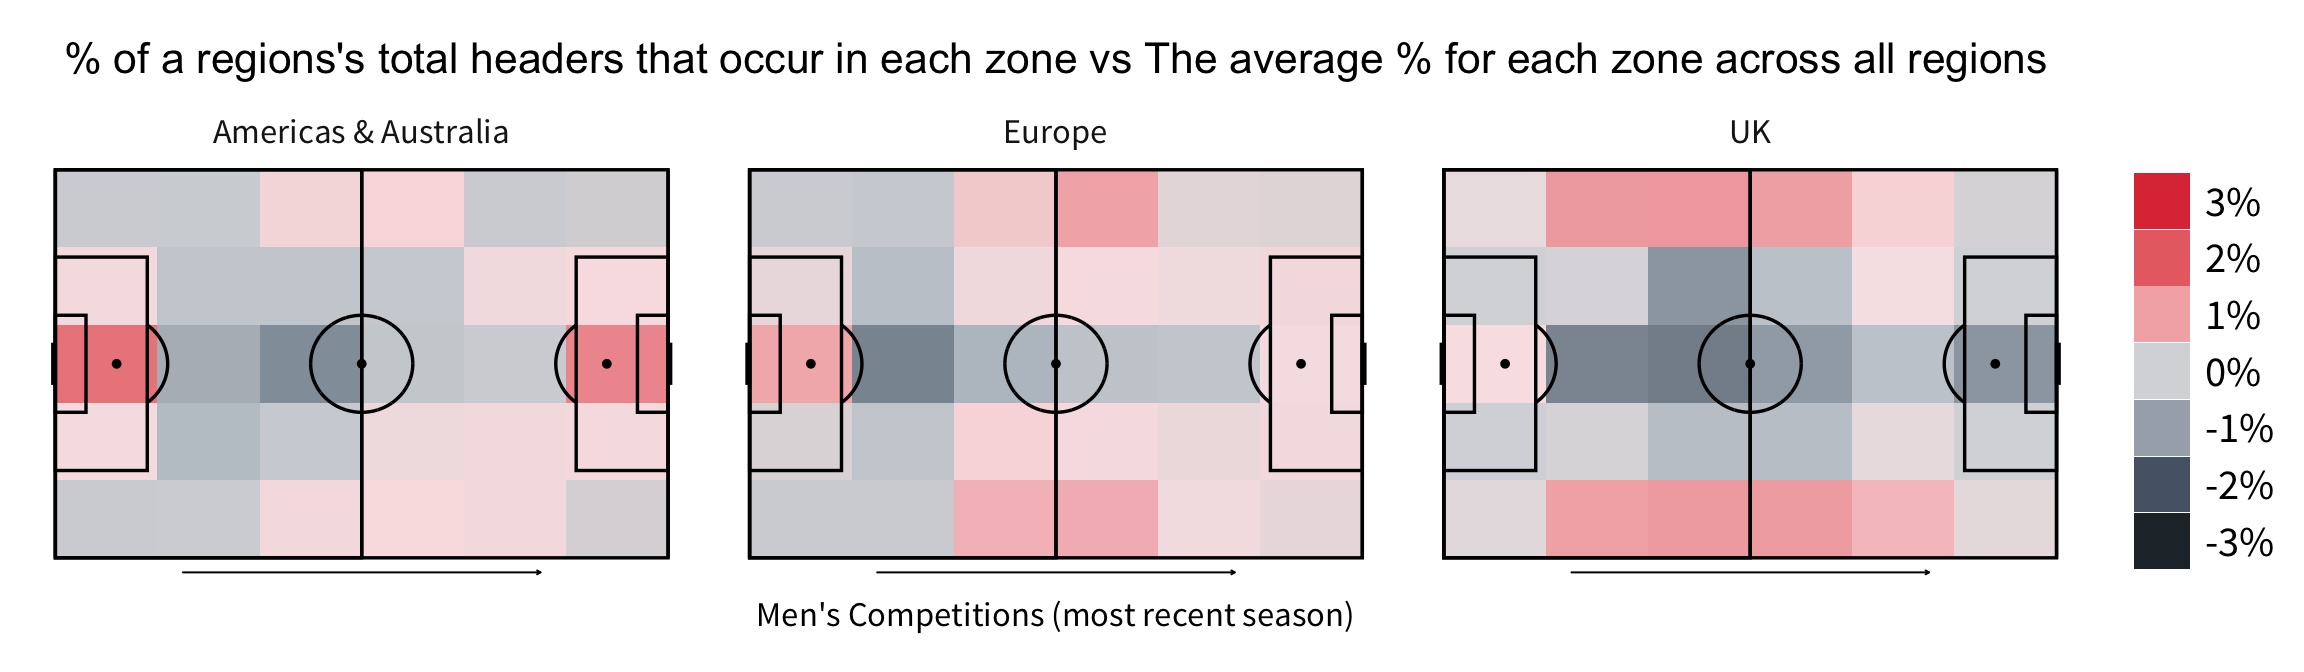
Grouping the competitions by region further highlights these differences - there really are no leagues quite like the UK!
Women’s Competitions
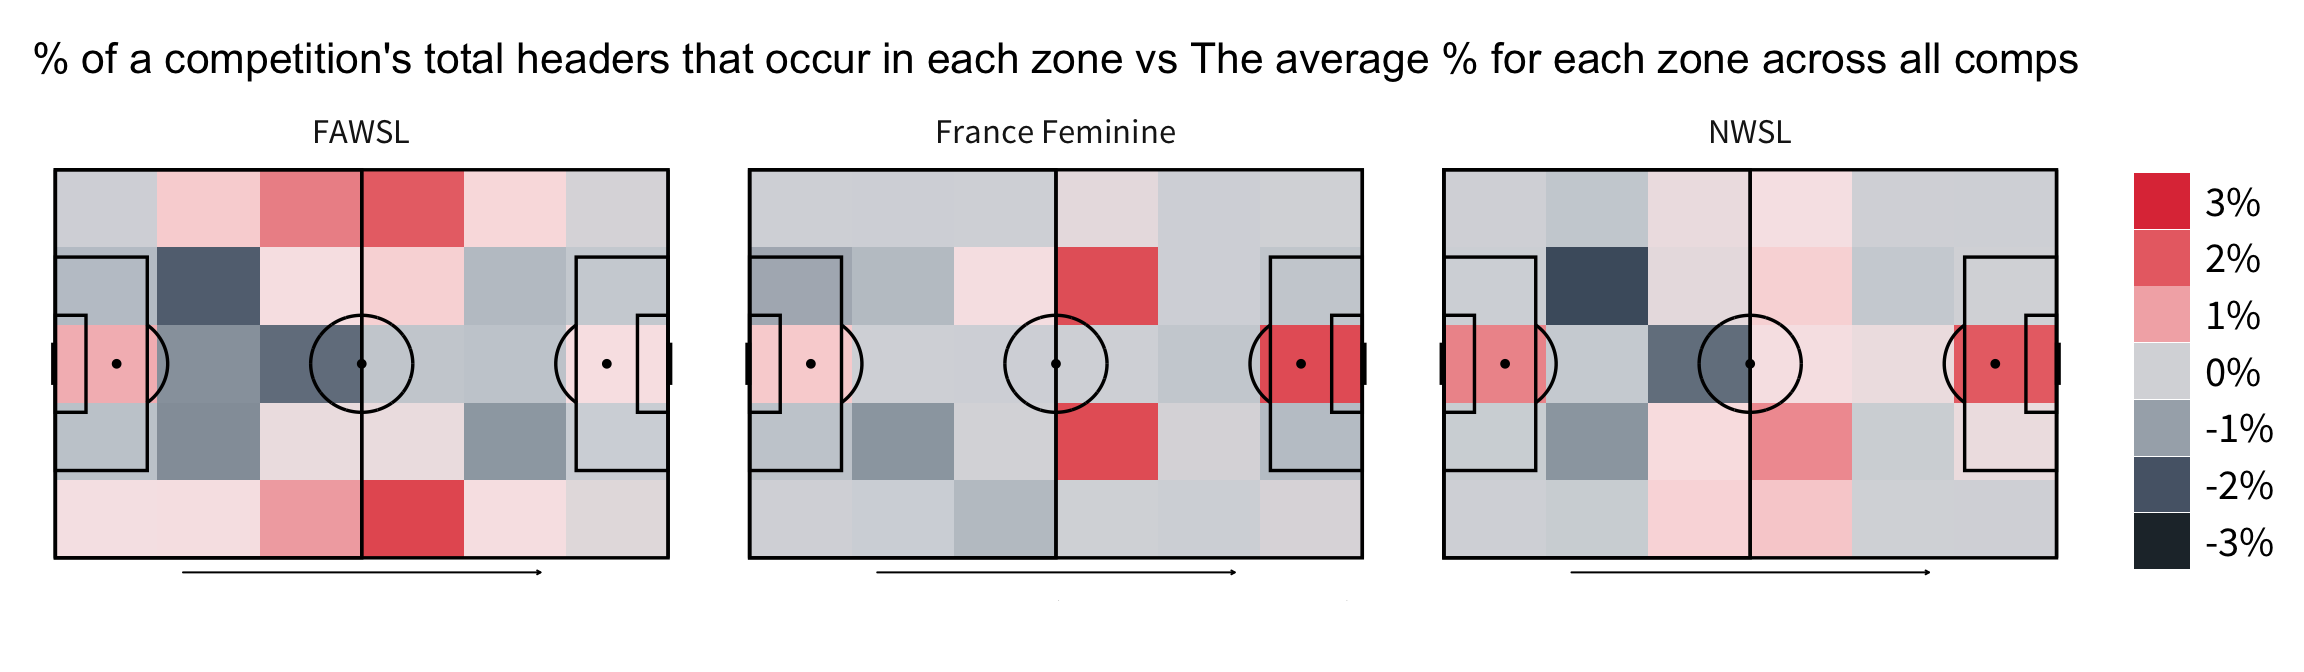 Looking at the women’s leagues reveals three different patterns. It appears heading is slightly different across each of these leagues.
The FAWSL seems to be similar to what we see in the UK’s male leagues with more headers in the channels but they are concentrated around the half way line here. France has a pattern that we haven’t seen before with hot zones in the opposition half. It is possible that the team in possession winning more attacking headers in this league.
The locations of these zones suggest they win these attacking headers from goal kicks and crosses more than usual. In America, we can see a similar pattern to Brazil and Mexico with more headers in each box.
Wider Trends
Finally, you may have noticed in the first section that for leagues in which we have more than one season, headers per game seems to be going down and this is correct. Within the leagues and seasons covered here are 30 instances of a league having less headers per game the following season and only 3 instances of a league having more headers.
Only Belgium, Austria and Spanish La Liga saw an increase in the number of headers this season compared to last. This is an overwhelming trend that can surely only be explained as an evolution of tactical preference and would bear further analysis. This could be through less crossing or in build up play - we already know crossing can be an inefficient form of attack if overprioritised so perhaps teams are catching on to this. It will be interesting to monitor this trend over the next few years.