This article is co-authored by Duncan Hunter (QA Data Scientist), Scott Johnson (Senior Analyst), and Conor Sharpe (Data Scientist).
Football is a game that continues to evolve and transform with each passing season. While the fundamentals remain (score goals, don’t let them in), the strategies and approaches to succeeding in those objectives are shifting. From how teams utilise seemingly routine restarts like goal kicks and throw-ins, aerial duels going the way of the dodo, or distribution-breaking passing and dribbling tendencies. The very fabric of the sport is being reshaped through innovative tactics and rule changes, so we've been diving deep into the data to uncover what’s changing.
Spoiler alert: this isn’t yer dad’s version of football anymore, but you knew that anyway.
Goal Kicks & Throw-ins
We begin with everyone’s two favourite set pieces: goal kicks and throw ins.
As part of our commitment to producing the most accurate and detailed data in the industry, we dilligently monitor the features that go into our models to make sure they aren’t drifting too much. That is to say, our QA processes will flag to us when a particular feature - such as passes, pressures, event locations, etc - has started to trend above or below the previous average to a significant degree.
This process flagged a couple of things: a noticeable drop in the number of throw ins per game across a number of leagues, but also a change in where events in general were happening on the pitch. Events were now happening closer to goal and in more central areas of the pitch than ever before.
The cause? Goal kicks.
Since the start of the 2019/20 season, teams have been able to receive goal kicks inside their own penalty area, which has led to a dramatic change to the way goal kicks are taken. A recent article in the Athletic compares how teams are now taking their goal kicks, and also mentions the rule change.
When we plot the percentage of goal kicks that are ground passes versus high passes over time, we can see a rapid convergence almost to the point where there are more ground goal kicks than high, which is a remarkable change considering more than 80% were high in 2017.
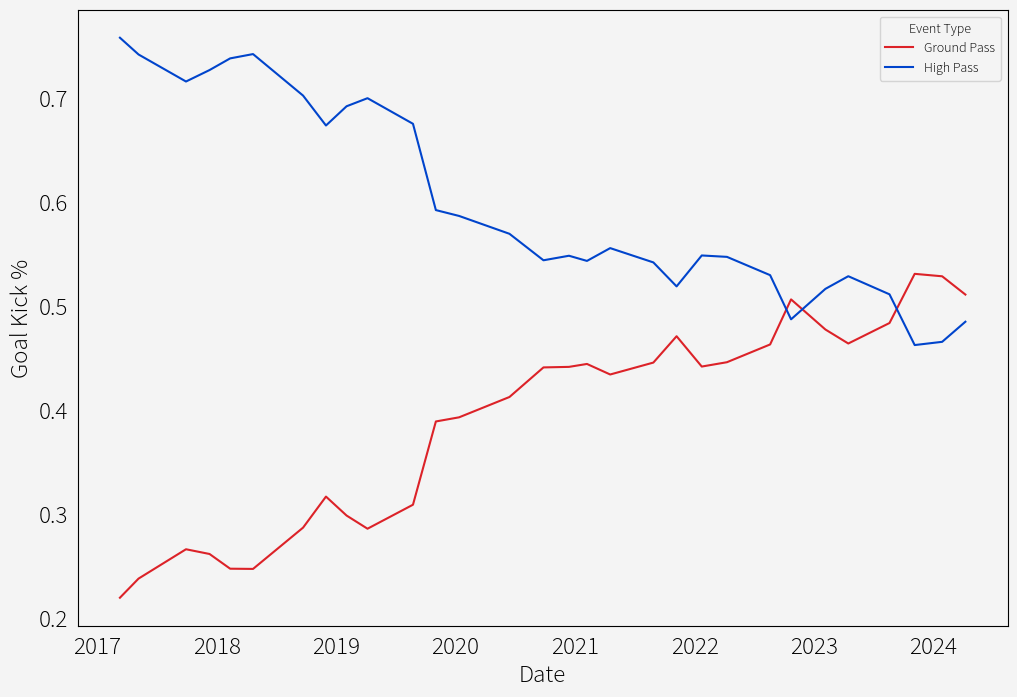
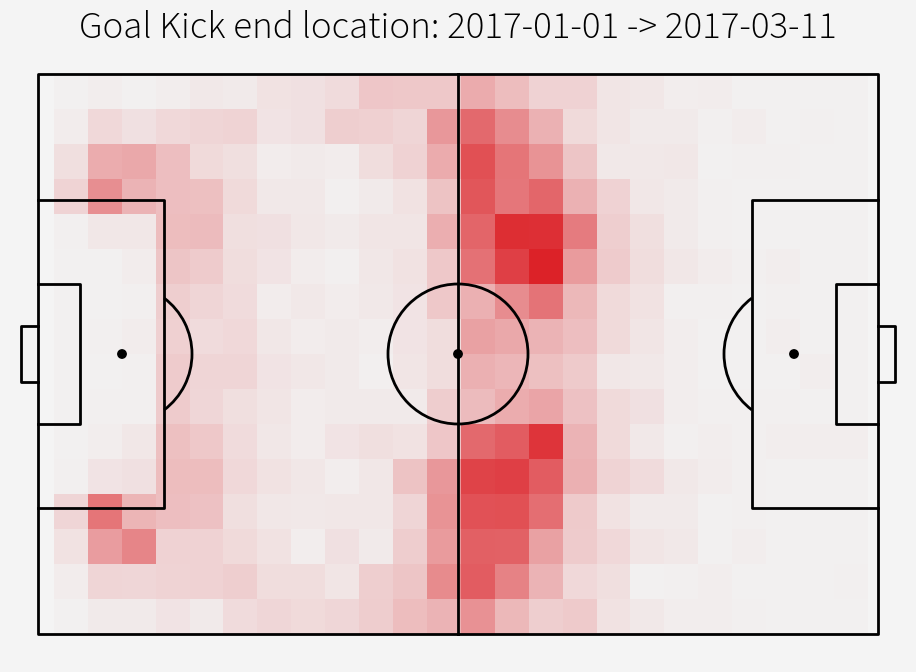
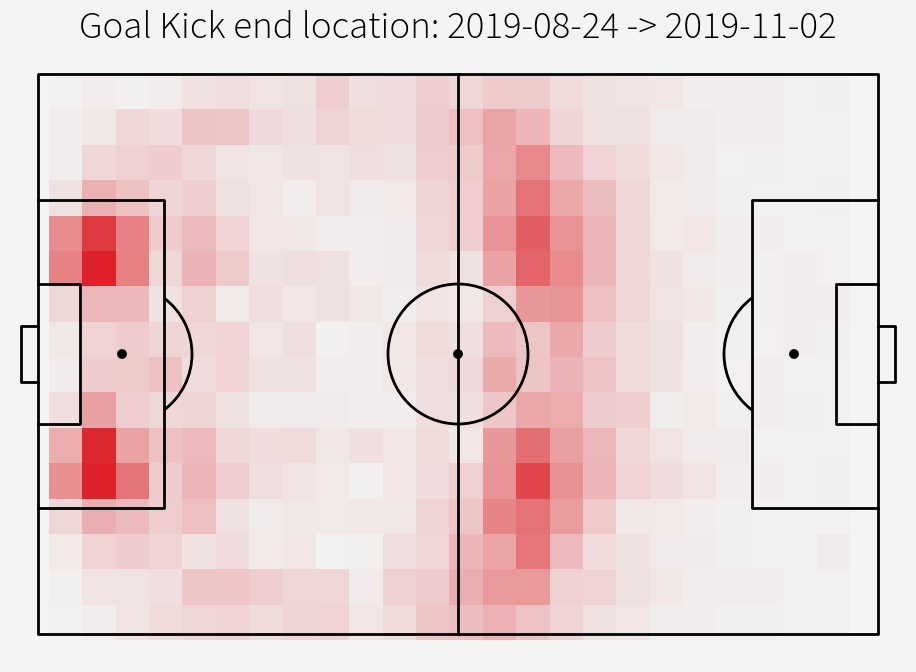
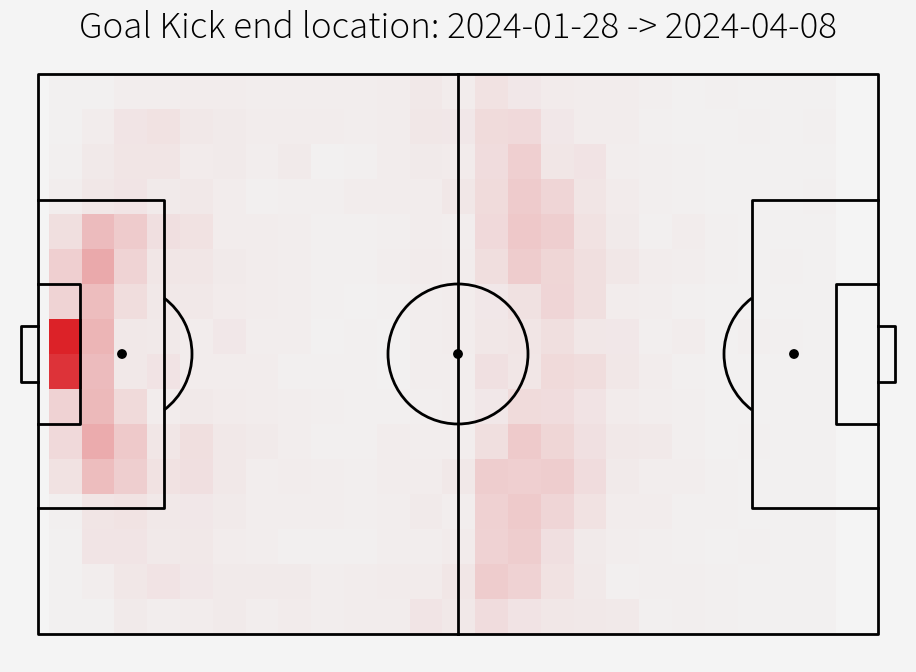
Here’s that trend coupled with a heatmap of goal kick end locations over time:
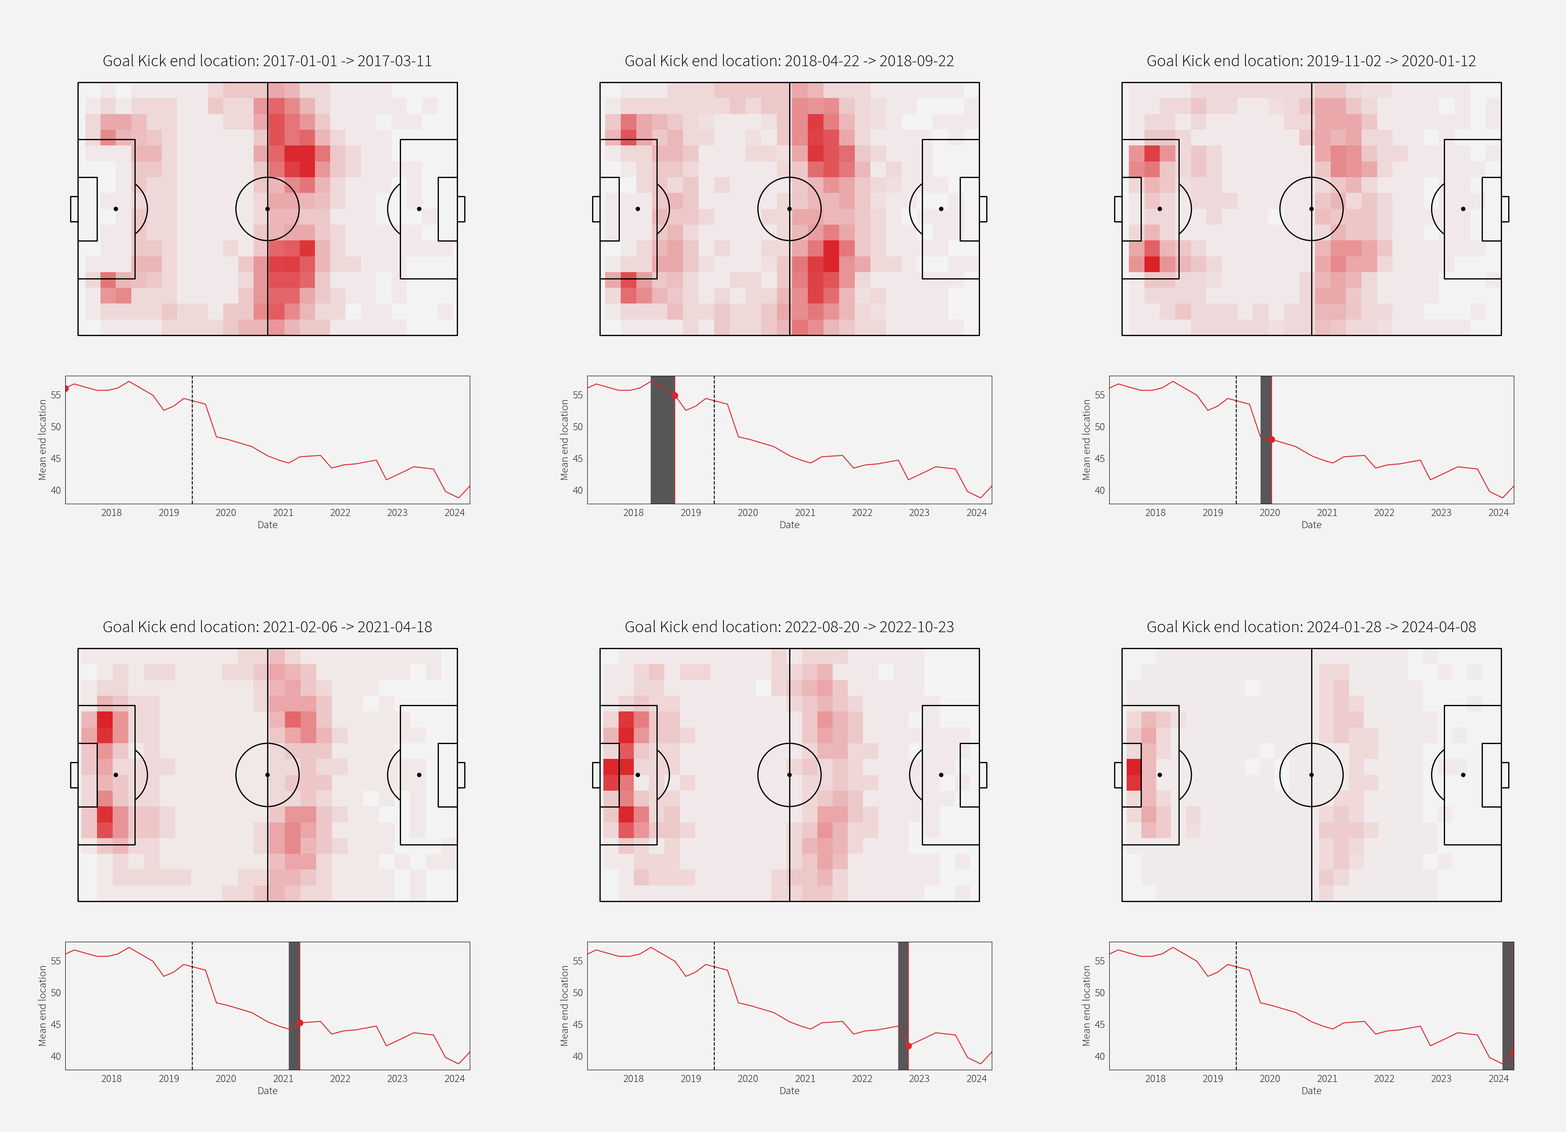
We can take three keyframes from this to see the evolution clearly. From mostly long goal kicks, the rule change leads to a very sudden increase in receptions inside the box, and more recently, defenders passing the ball to their keeper.
But how does this link to throw ins? If we plot throw in counts per match and short/long goal kick counts per match, we can see two loose correlations appear:
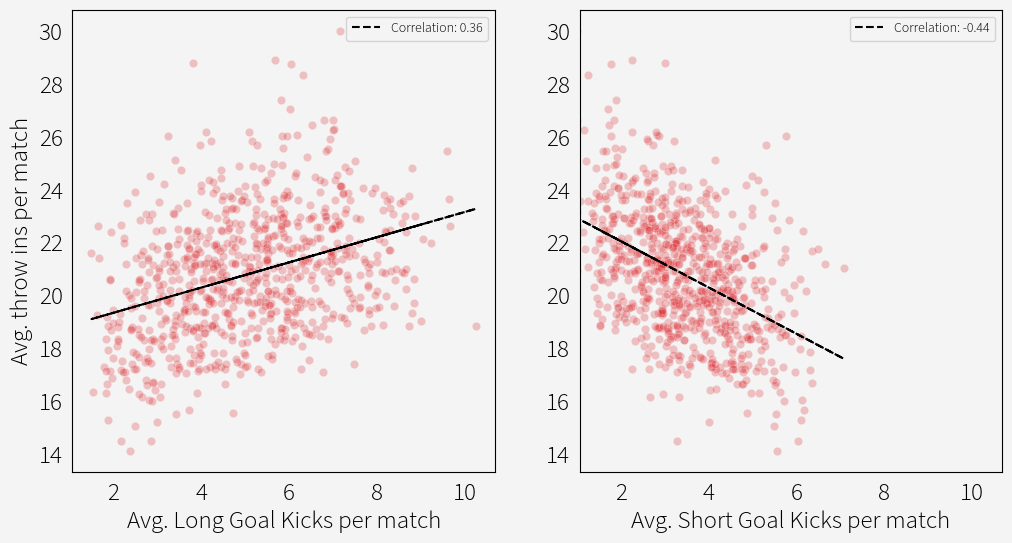
Mean count of actions per match, aggregated by team and season.
The simple explanation is, long goal kicks go directly out much more than short goal kicks:
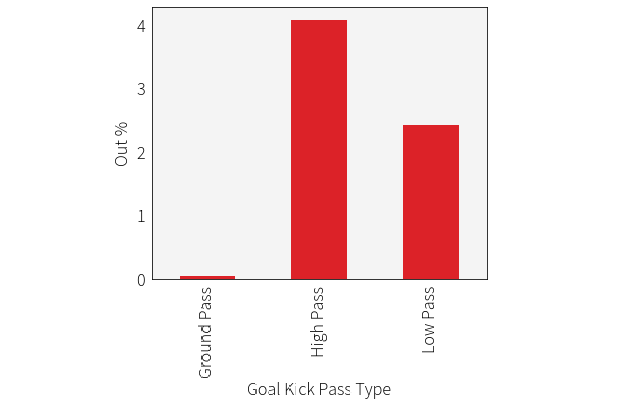
If we look at sequences that start with goal kicks and end in a throw in within 5 events, we can see the pattern even more clearly. In Premier League data from January 2023 onwards, 285 sequences from long goal kicks went out within 5 events, vs 46 for short. And looking at the occurrences for short goal kicks, a large amount of the possessions that ended out of play involve hoofing the ball a long distance after the initial short pass anyway.
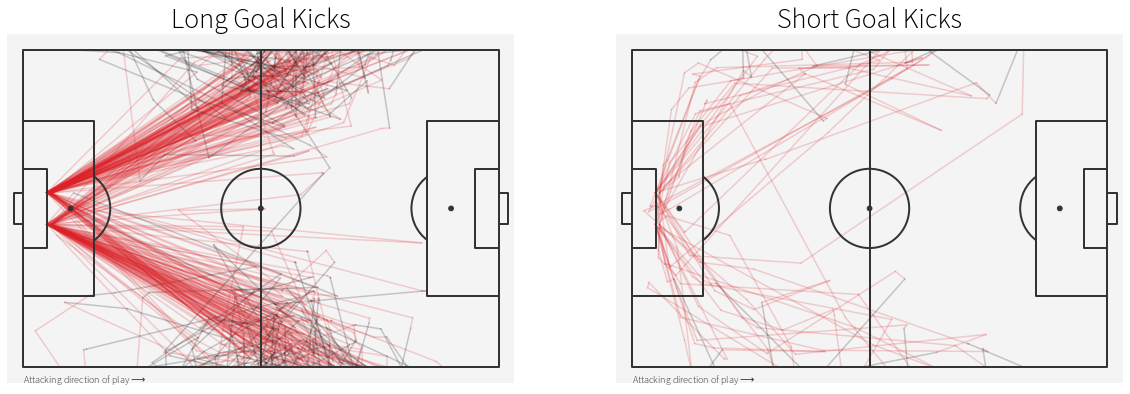
Goal Kicks + 5 events that ends in a throw in
Now, most of this analysis is purely observational, but if you’re a team that isn’t well suited to playing out from the back and you’re decent at throw ins, you should absolutely be kicking long from goal kicks and juicing your throw in counts per game. Heck, you could even go full “game's gone” and hire a throw in coach to really gain an edge.
Passing
Passing in general is changing. A Big 5 team finishing the season with a pass completion rate of 77% in 2015/16 would have been slightly above average -- in the modern game, 77% would land you in the 25th percentile. Pass completion has gone up consistently almost every season since our records began.
The question is whether players are getting better at passing or whether they are choosing easier passes. You can probably guess the answer given what we’ve already talked about, but to check this properly we can use the expected pass model (xPass) which estimates the likelihood of a pass being completed. When we plot the average xPass of all passes in the Big 5 across each season we can see that its rising in line with pass completion.
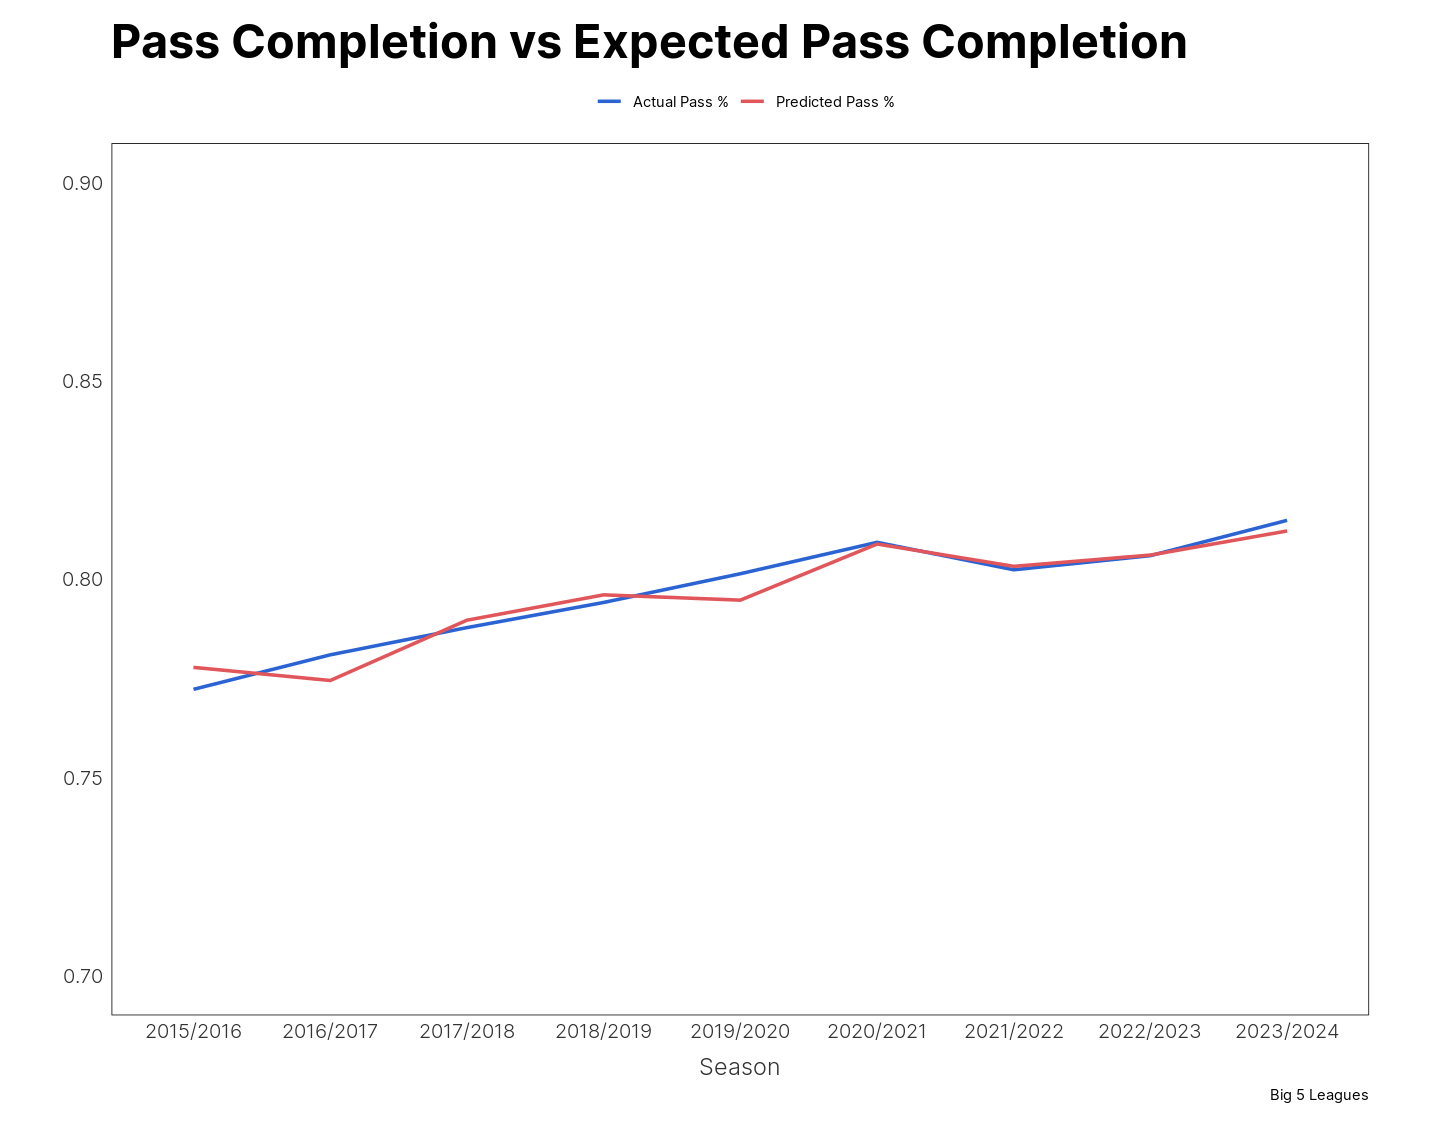
Players aren’t necessarily getting better at passing they’re just playing easier passes on average which explains the uptick in completion rates. Route one football really is dying out.
Headers
Bad news HOPS fans - headers are still going down. We noted back in 2020 that the number of headers per game was trending down across a whole host of leagues, and that trend has continued. If we take the Big 5 leagues, you can see that we’re currently around the mid-60 mark for headers per game, although there has been a small uptick this year.
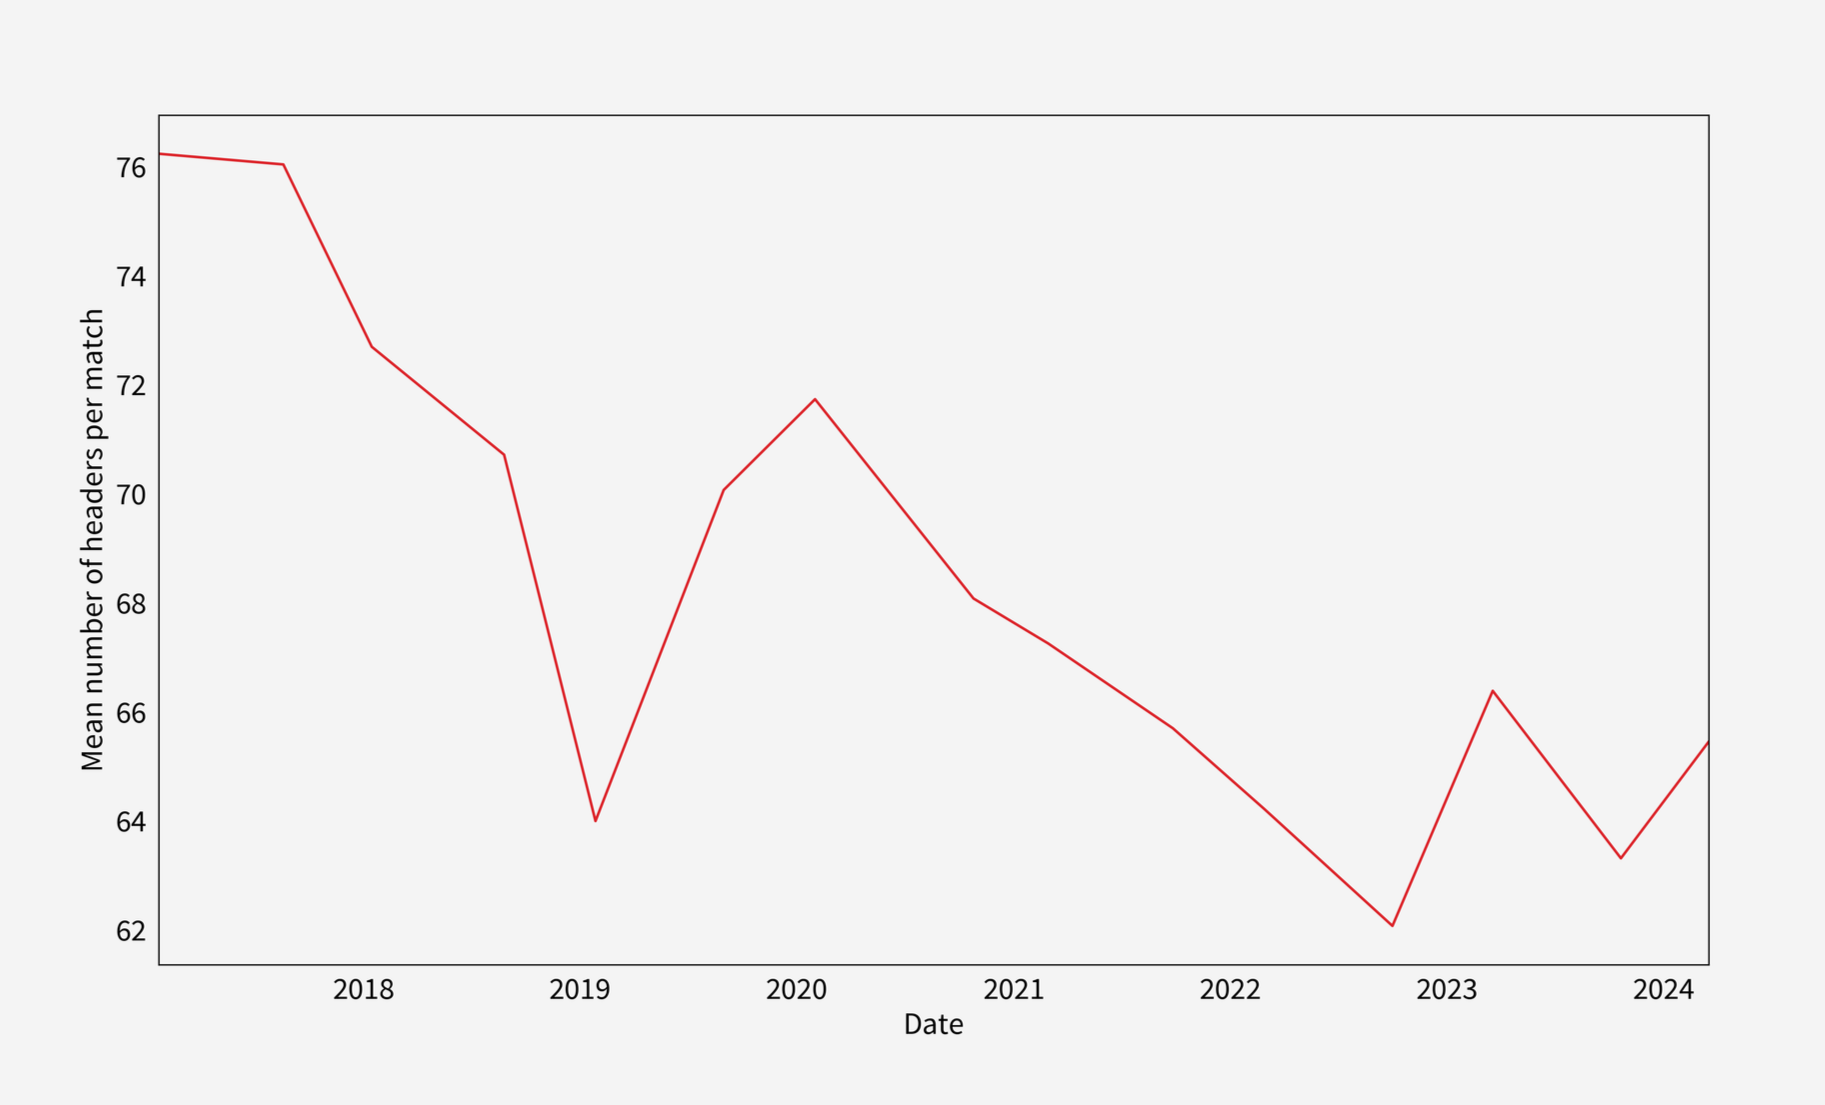
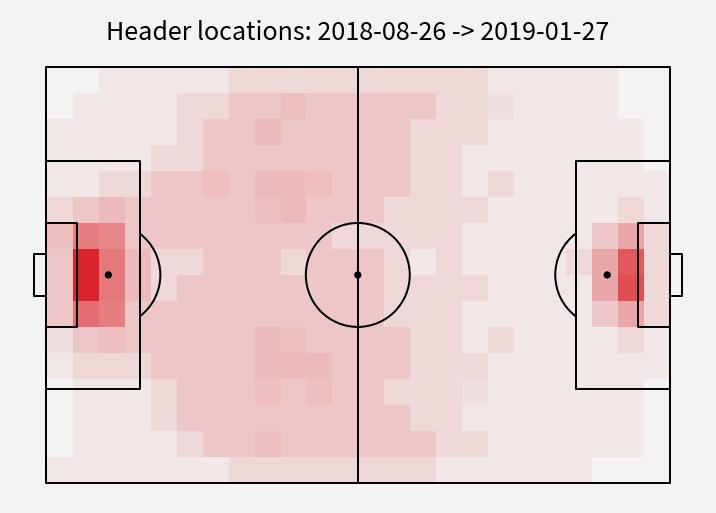
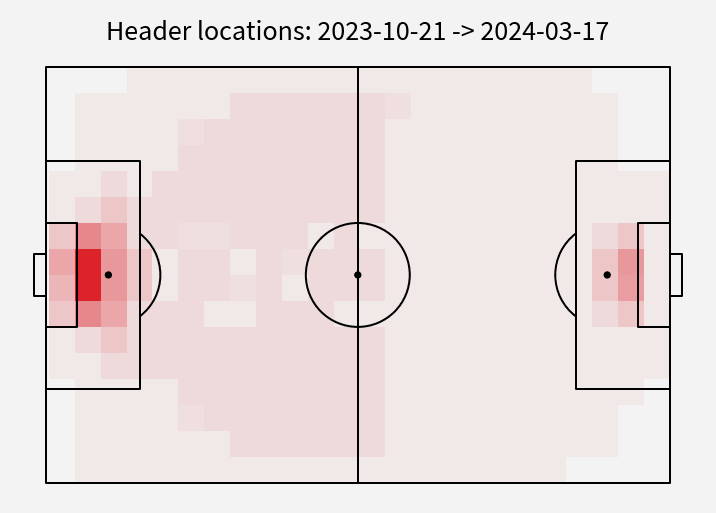
As for where these headers are happening, we’re seeing less and less in the defensive half outside the box. Headers in this area are usually down to long balls from the back and throw ins down the line so it's no surprise to see headers going down as teams look to play along the ground more when progressing the ball.
We’re currently trending towards a 'Latin American' style, whose leagues see the lowest amount of headers per game (as low as 50 per game in Mexico and Brazil). In these leagues, headers are reserved for inside the box as teams try and score via crosses. Though fans of a good old aerial duel might not like this trend, we can probably agree it’s a good one given the link between concussions and heading.
Dribbles
Finally, we turn our eyes to dribbles where keen watchers of football have long been complaining that players are dribbling the ball less and making football a bit boring. And they may have a point - dribble volumes have indeed gone down, as discussed in length by The Athletic in a recent podcast.
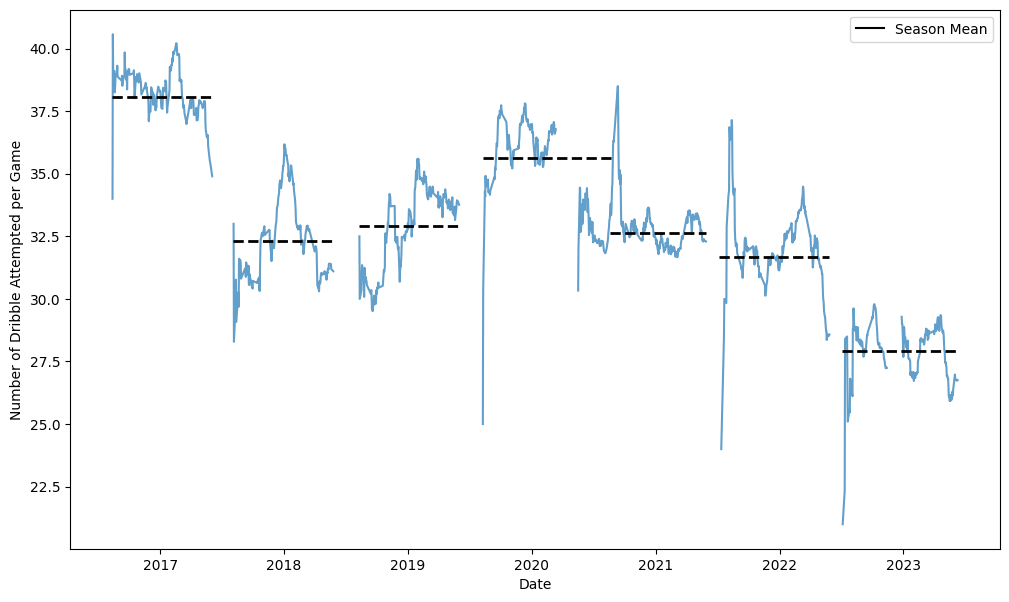
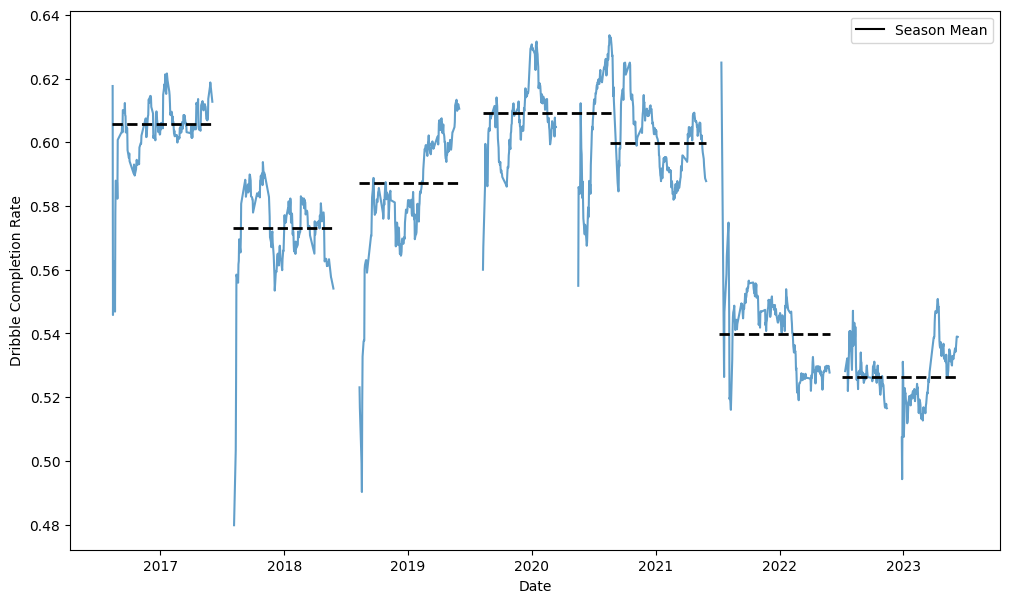
The last few seasons in particular have shown a significant drop off. To make matters even worse, not only are there less dribbles per game these days, but the attackers are completing them at lower rates as well. Less fun all round.
But why? To answer that, let's go through some dribble basics. Breaking the data down spatially, you see that players attempt dribbles more often in the wide areas of the attacking half, as expected. The interesting part is that the areas where players attempt dribbles the most are also the hardest areas to complete them! The heatmap on the right is roughly the inverse of the heatmap on the left.

Has the above changed much over the last two seasons? Let’s compare the two most recent seasons (2021/22 and 2022/23) to the previous five (2016/17-2020/21).

The first takeaway is that players are attempting dribbles in their own half more. We put this down to the increase in short goal kicks and the increasing desire to pressure the short goal kicks, forcing more ground duels and dribble opportunities.
The second point is that players just aren’t dribbling in the centre of the pitch as much these days, but they are dribbling in the wide areas of the final third more. We think this is a tactical trend as coaches are worried about conceding dangerous transitions in the middle of the pitch -- a logical way to combat this worry would be to ask your players to dribble less in the centre of the pitch. They can of course dribble more in the wide areas as the risk of losing the ball and conceding a dangerous transition is much lower there.
Now you might think that the change in dribble locations explains the overall drop in completion rates since players are dribbling less in the centre of the pitch where dribbles are easier to complete, but it doesn’t. When you plot change in success rate across the whole pitch they’re down everywhere. Sadly we don’t know if the players got worse at dribbling or better at tackling.
That concludes our tour through the modern game and how it's changed in even the last five years. But that won't be the last you've heard from us when it comes to dribbles, as we've been doing a lot of work on them in recent months here at Hudl Statsbomb. Stay tuned for more soon.
This article is co-authored by Duncan Hunter (QA Data Scientist), Scott Johnson (Senior Analyst), and Conor Sharpe (Data Scientist).

