
As well as offering the most detailed and accurate data in the industry, at StatsBomb, we pride ourselves on developing new models from our world-class data science team, consistently upgrading the tools available to our customers to derive better and more complete information.
At the start of the summer we launched HOPS, our new way to evaluate player aerial ability. Today we’re introducing two new passing models: Expected Pass (xPass) and Pass Clustering. Both are available to customers now across more than 120 competitions worldwide.
Expected Pass (xPass)
Passing is an extremely prevalent part of the game. An average football match involves not far off 1000 passes, and approximately 62% of ball progression comes from passing rather than ball carrying. As a result, many attempts have been made to measure passing performance and skill, including pass completion rate. It’s intuitive to assume that a high completion rate is evidence of good execution, however this doesn’t account for the fact that not all passes are equally easy to execute.
That’s where Expected Pass (xPass) comes in. xPass provides a baseline for how often we’d expect a pass to be completed based on the conditions of the pass. We can then compare how often a player completes their passes against the expected completion rate for a more accurate estimate of their passing ability and analyse the difficulty of the passes they attempt to measure their passing tendencies.
Our expected pass model considers several factors:
- The start location of the pass
- The target distance of the pass (where possible, StatsBomb collects intended pass recipients and their location on failed passes)
- The angle of the pass
- Whether the passer was under pressure from the opponent
- The body part used (foot, head, other, etc.)
- The pattern of play (open play or set piece)
For example, a backwards pass in the defensive third under no pressure could have a 99% expected pass completion, whereas a switch from inside the player’s half aimed towards the final third on the opposite flank could be closer to 40% or even less.
Looking at last season in the Big 5 European leagues, here are the players that overperformed xP the most per 90 minutes (minimum 1500 minutes played):
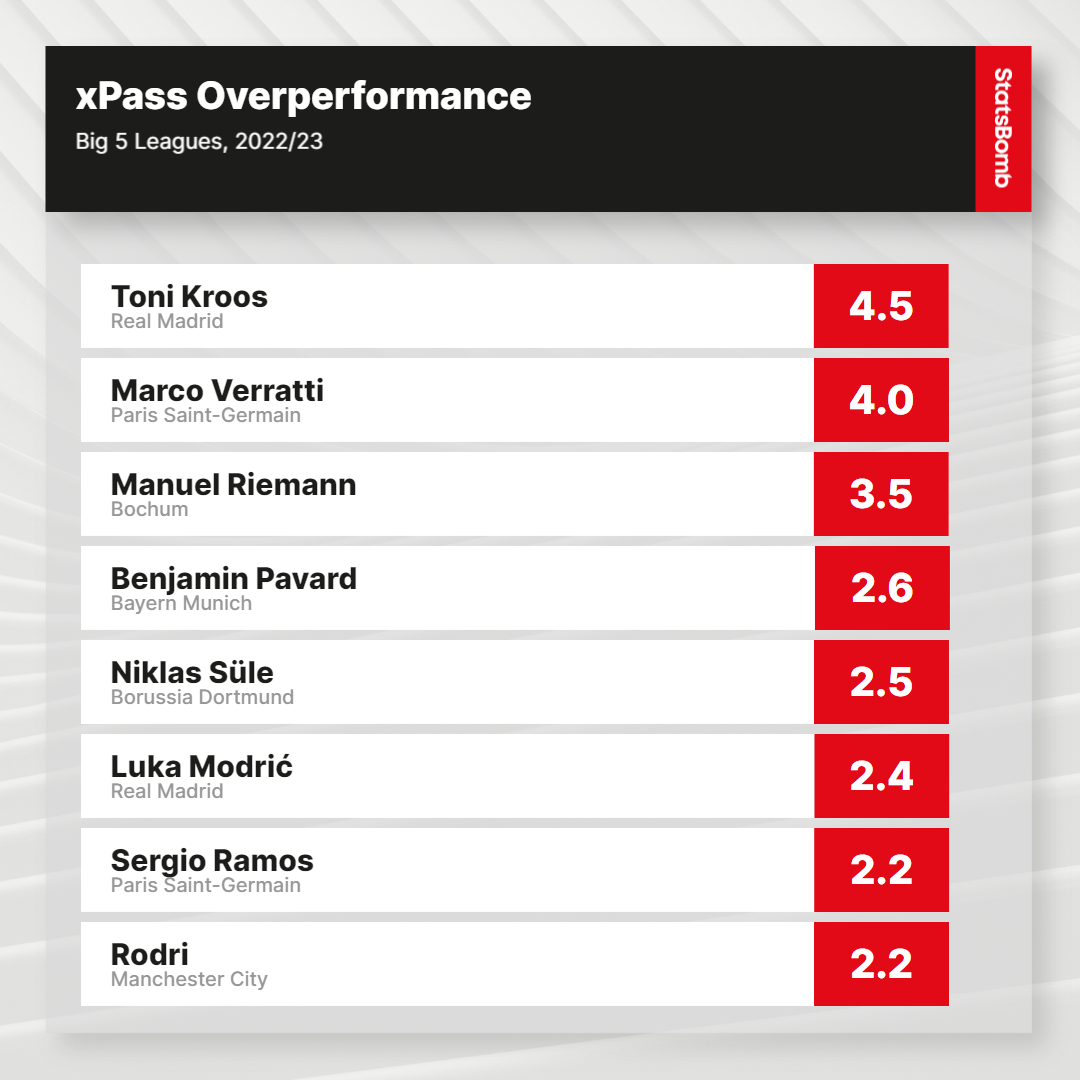
TopRightMessiToni.
As well as measuring which players complete passes above expectation, we can examine player passing profiles – specifically the amount of risk they’re willing to take and a tentative measure of whether a player can complete riskier passes.
Let’s circle in on central midfielders and their risk profiles from last season:
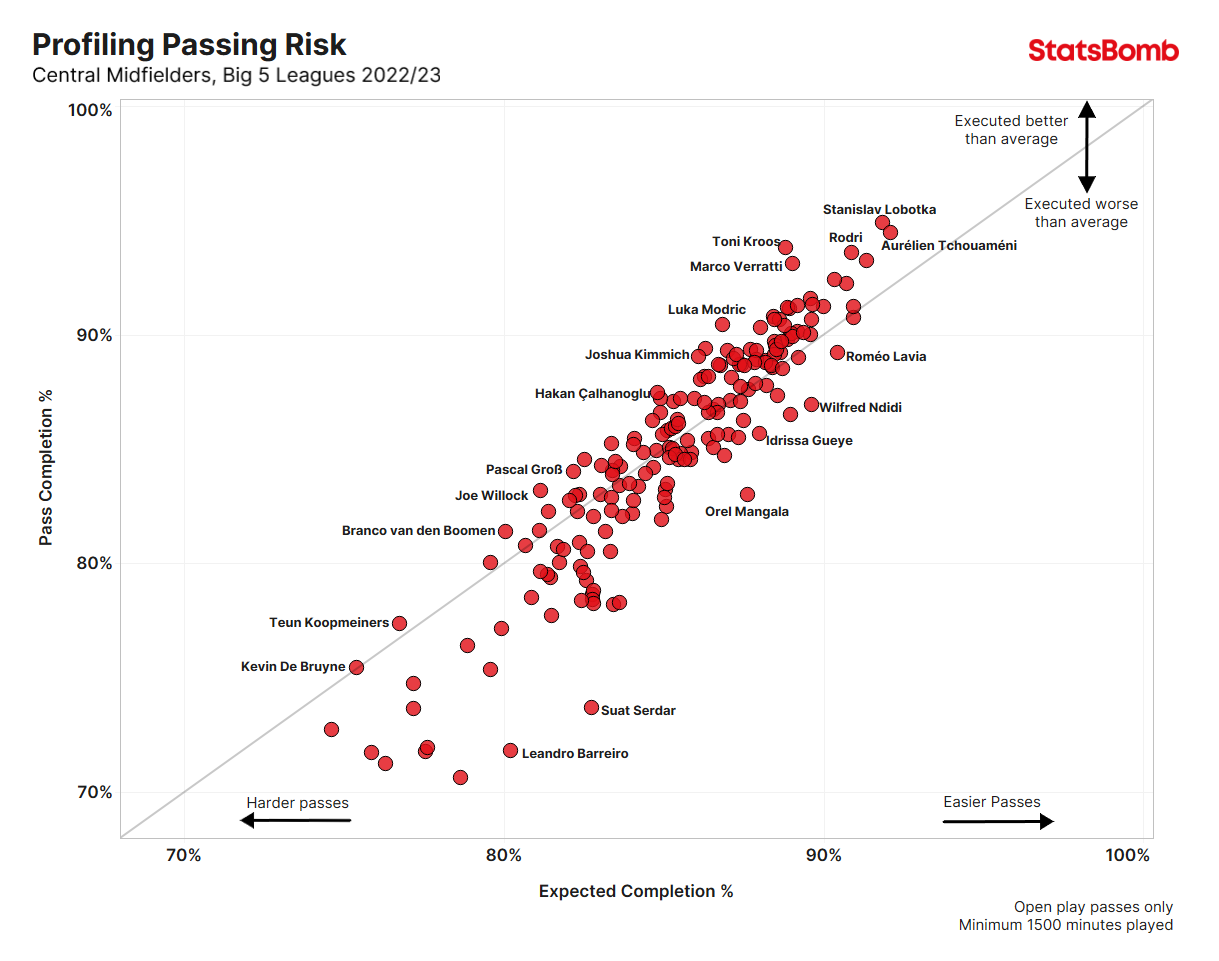
Ok, there’s a little more information here.
Players like Kroos, Marco Verratti and Rodri – metronomic players on high-possession teams – all play some of the safest passes on average, and play them well. At the other end of the scale, chucking Hail Marys into the box at practically every opportunity, Branco van den Boomen, Teun Koopenmeiners and Kevin De Bruyne are some of the riskiest passers in the Big 5, but complete their passes at a reasonable rate compared to expectation.
However, this analysis groups all of a player’s passes into one average and doesn’t account for how a player performs on the full range of pass difficulties. We know Kroos, Verratti and Rodri all have more complete passing ranges than the above would suggest.
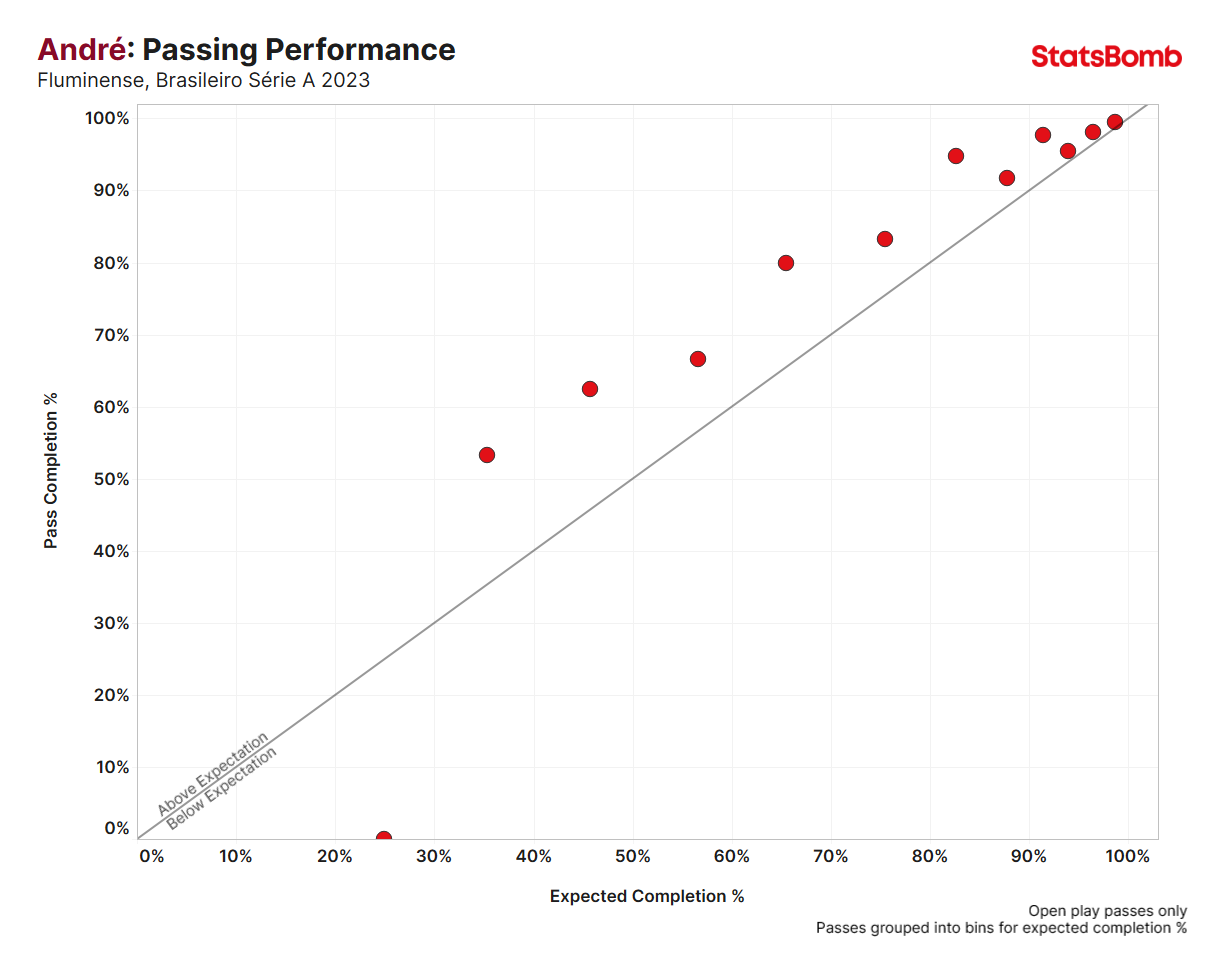
So let’s go deeper and examine individual player profiles. We do this by grouping their passes into bins based on their expected completion rate, and then look at their performance in each bracket. Here’s Rodri:
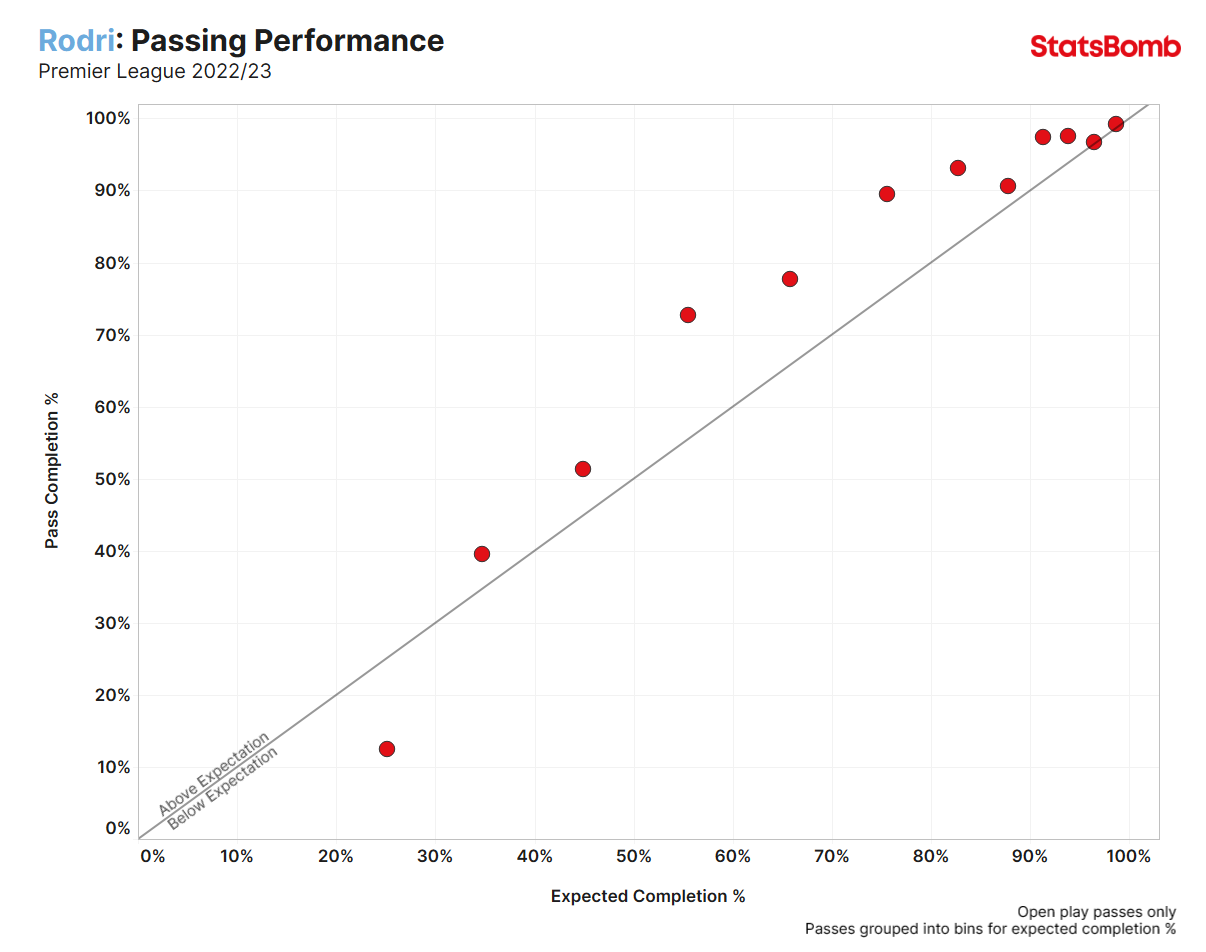
That’s more like it. We know Rodri can recycle safe possession and hit precise line-breaking passes into the opposition block. The only set of passes Rodri underperformed in last season was in the 0%-30% xPass completion bracket – which only ~1% of his total pass attempts fell into.
Another way this approach can be used is to compare players.
The current battle for Arsenal’s #1 jersey is the perfect case study to dig into. This summer, Arsenal brought in David Raya from Brentford to compete with Aaron Ramsdale in goal, and it appears that Raya has won the jersey for the time being. Mikel Arteta will be considering more than just ball distribution to decide between the two, but it’s worth making the comparison to see if we can deduce anything on distribution alone.
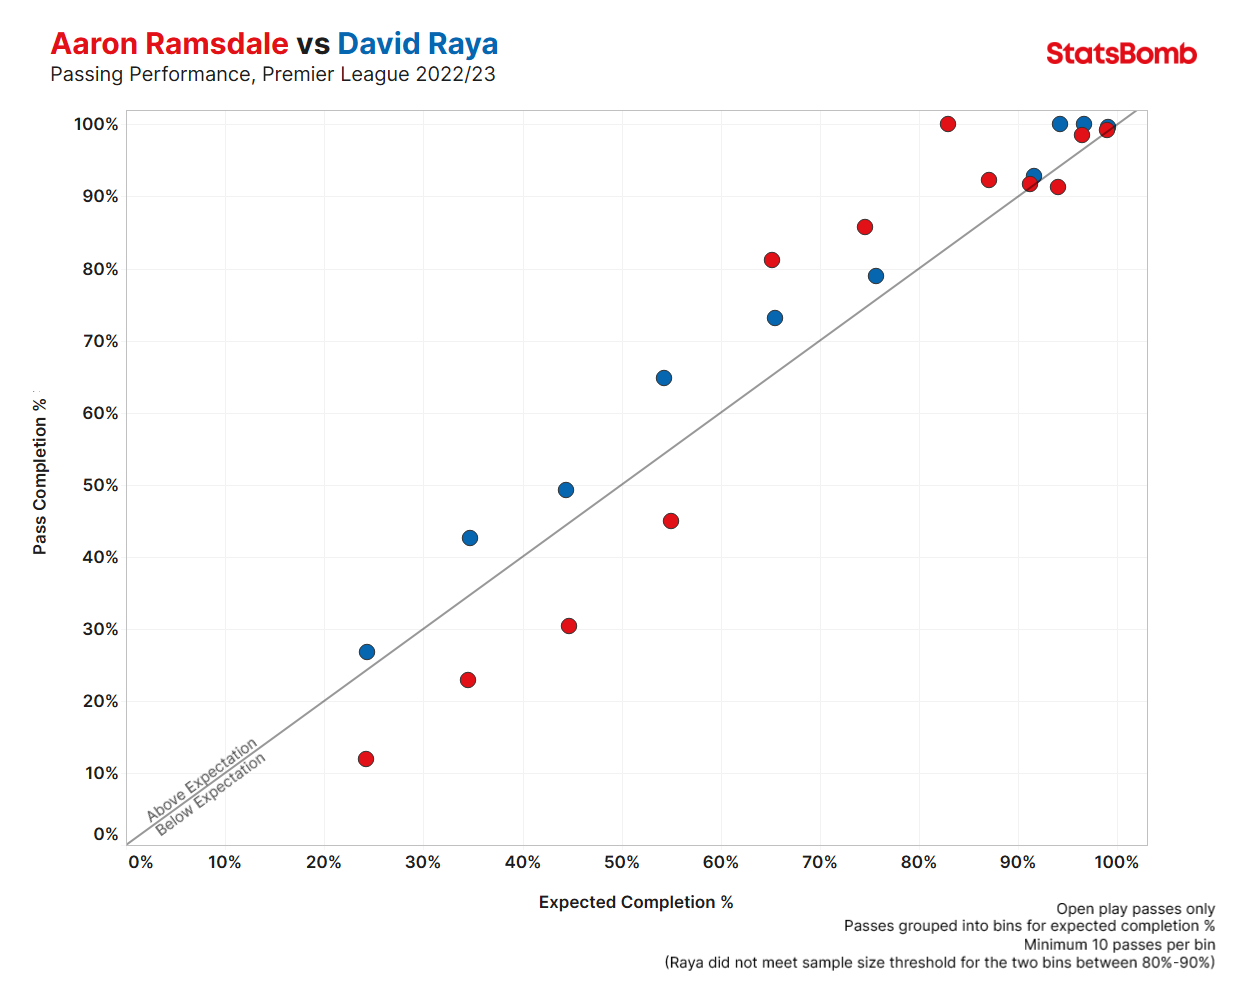
Last season, Raya outperformed Ramsdale at both the safer end of the spectrum (>90% xPass) and the riskier end. The only bracket in which Ramsdale outperformed Raya is the 60%-80% xPass – let’s call it medium risk – range, and even then Raya still performed above expected in those ranges. With how Arteta wants his team to play in the build-up phase, Arsenal may have found an upgrade in Raya.
Pass Clustering
Pass clustering is the second new tool we’ve added to our pass analysis toolbox. Given there are nearly 1000 passes just in a single game, visualising a team or player’s passing patterns over a larger sample of games quickly becomes unwieldy.
In essence, we need to try and make sense of this:
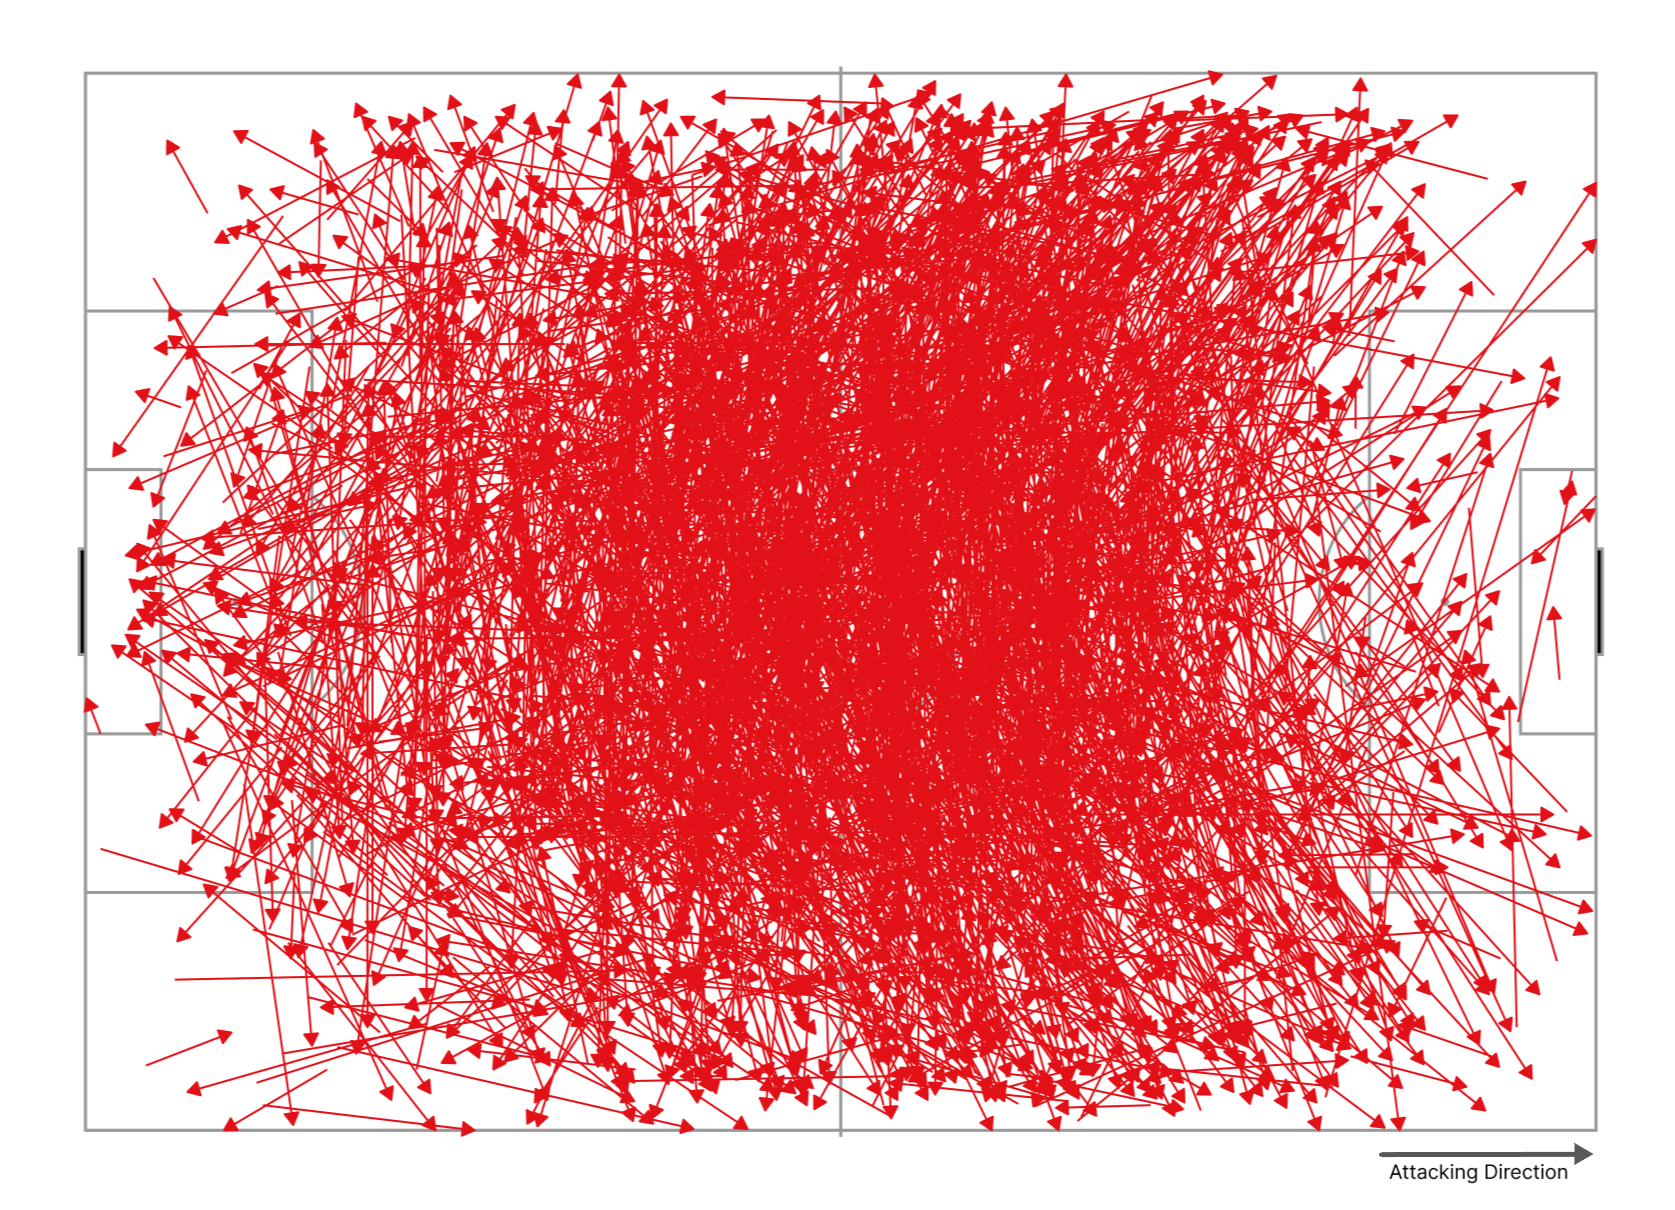
Our pass clustering model groups passes with similar characteristics to make identifying and analysing patterns of play much more manageable and interpretable. It groups the passes based on the spatial features of the pass and assigns each pass a probability of belonging to each of the 60 clusters. The features are:
- Start and end location
- Pass angle
- Pass length
We chose not to include our pass height or pressure information in the clustering model. While both features did lead to better distinction between clusters, it came at the cost of interpretability when visualising the passes. The two features also correlated with the location features: long passes were often high passes, and passes in attacking areas were more often played under pressure. Rather than include them as features in the model, we decided it would be more powerful to combine these factors with the cluster information when analysing the passes on a deeper level.
We have, however, used pass height in our cluster labelling. We label our clusters based on the model features to help with the analysis process. Each cluster is labelled based on the start location of the pass, the direction, and the length, but also with the most frequently occurring pass height within that cluster.
For example, Cluster 8 is “A short, ground pass played to the right from the centre of the middle third.” Cluster 38 is “a long, ground pass played backwards from the left-hand side of the middle third.” Cluster 43 is “a short, ground pass played forwards from the right-hand side of the attacking third.”
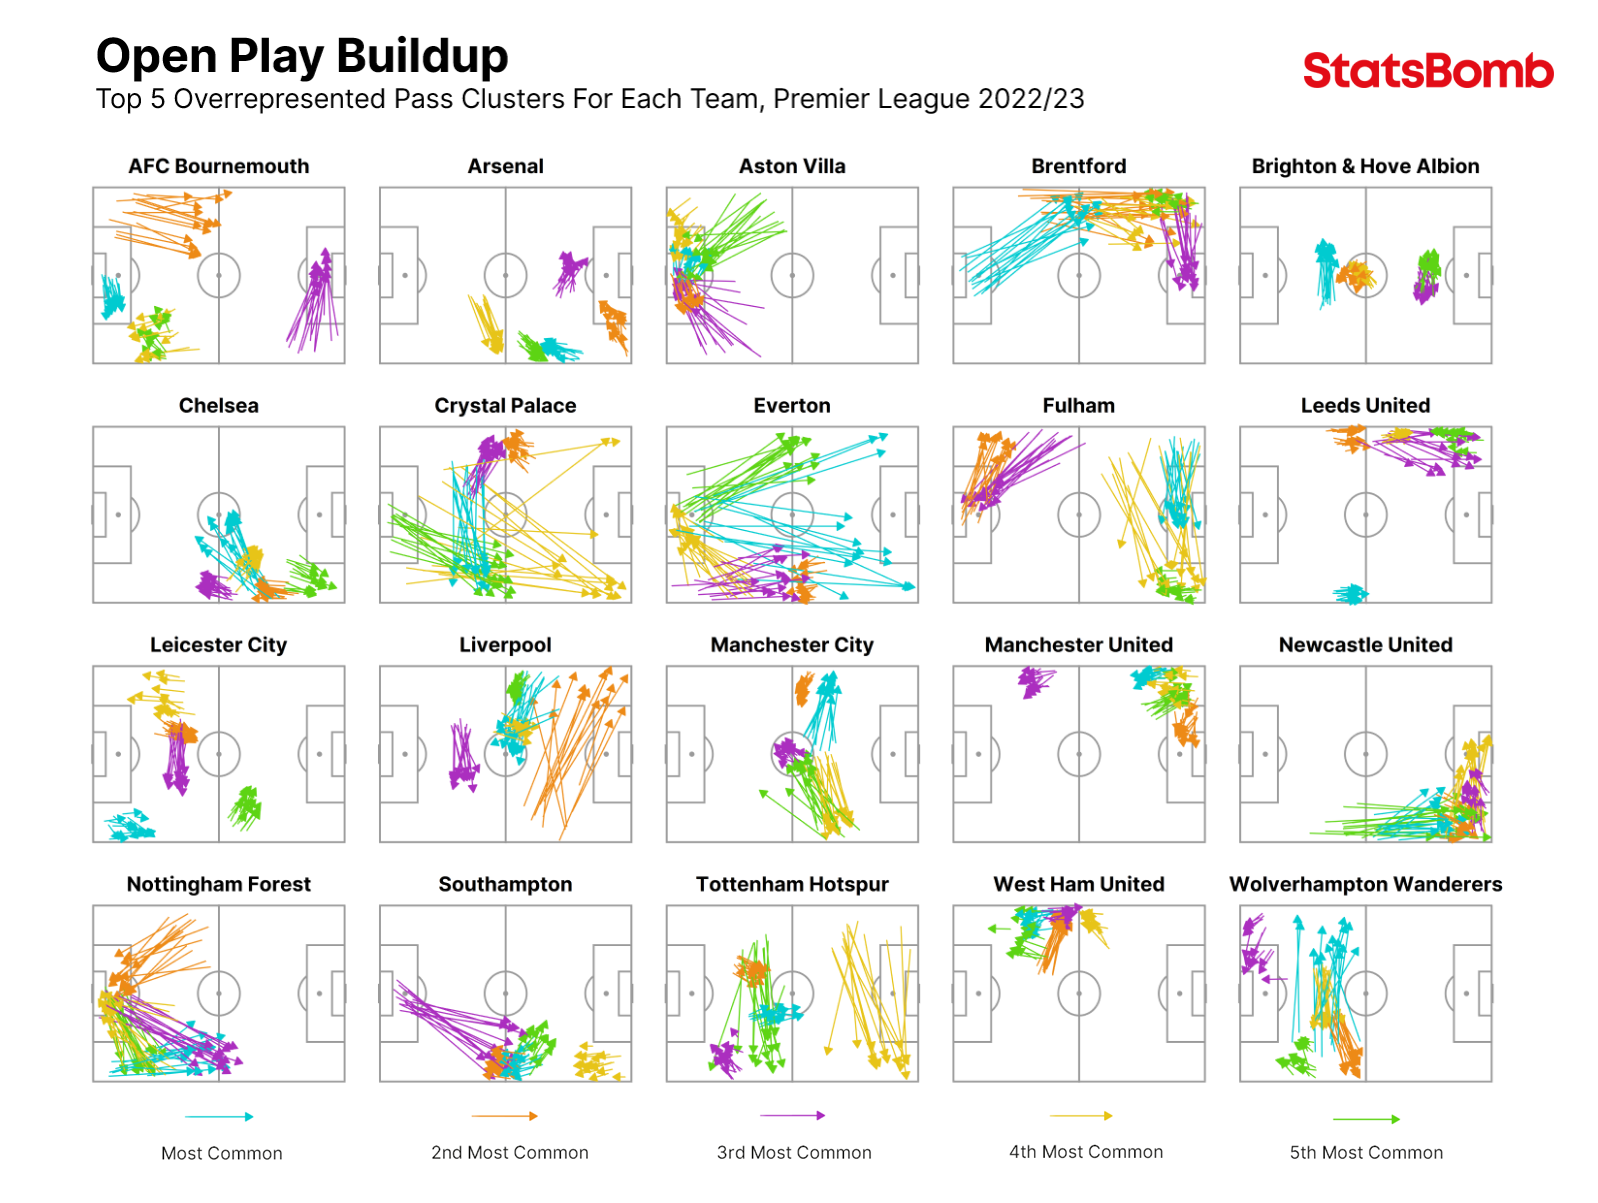
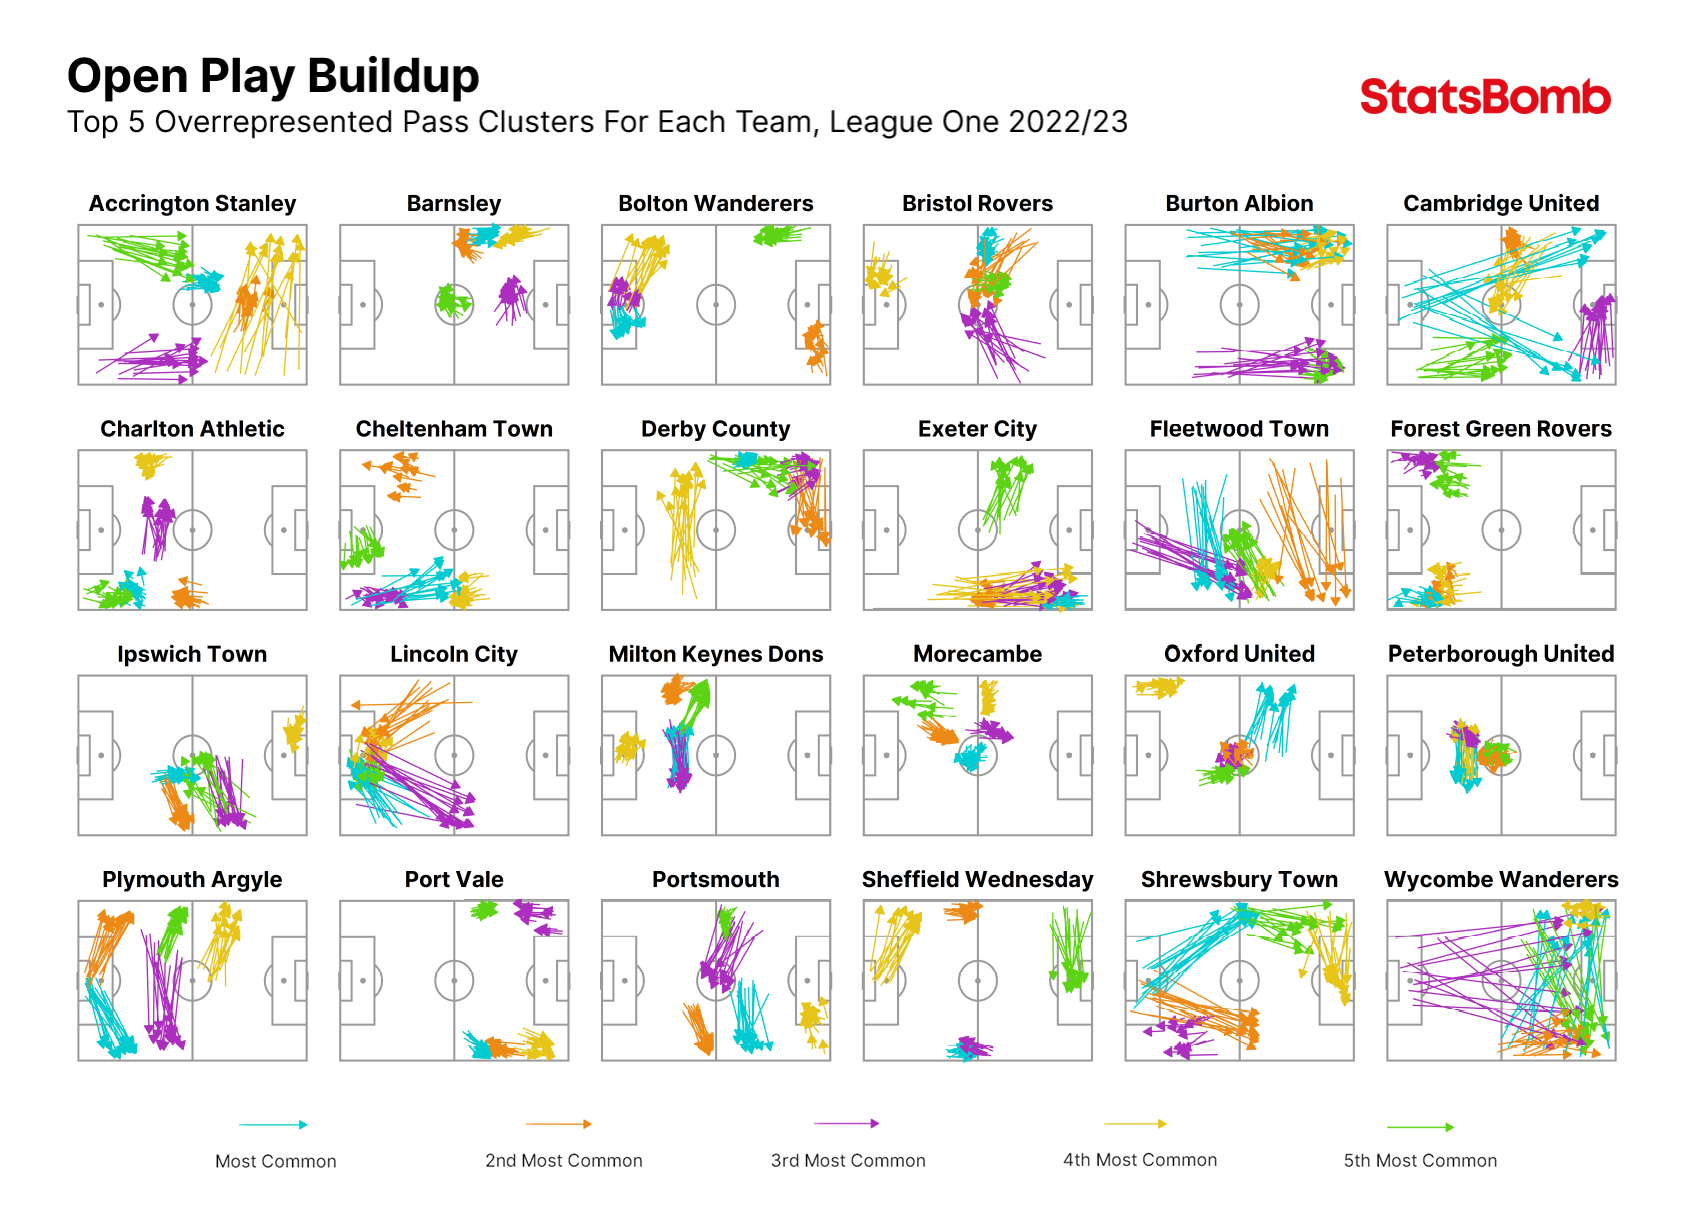
A good starting point for pass clustering analysis is to look at a league as a whole and identify the pass clusters that each team uses in possession more frequently compared to their rivals.
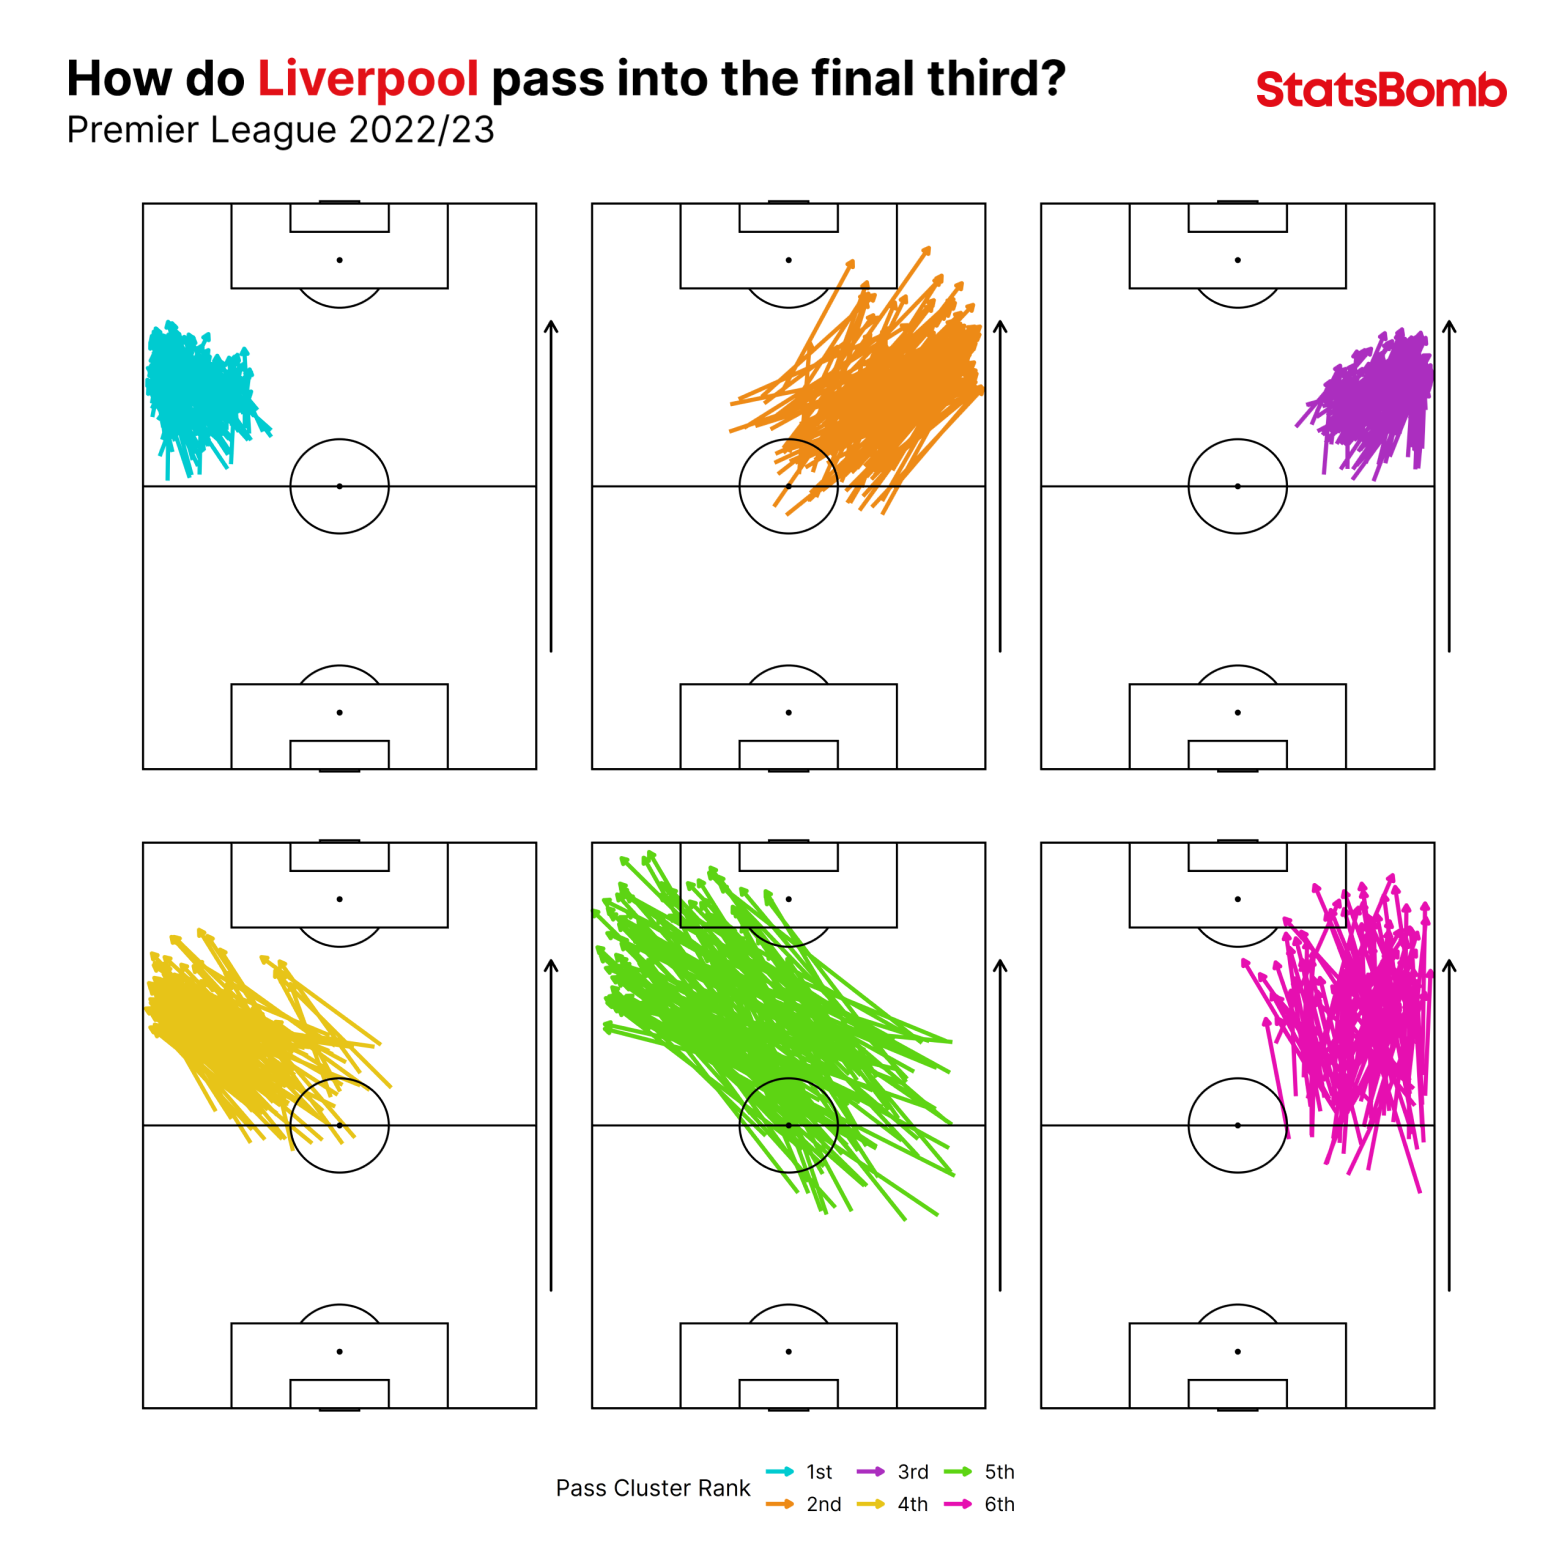
This gives us a general idea of each team’s approach in possession, but an analyst may want to dig deeper. Here’s how they may choose to look at how an upcoming opponent progresses the ball into the final third:
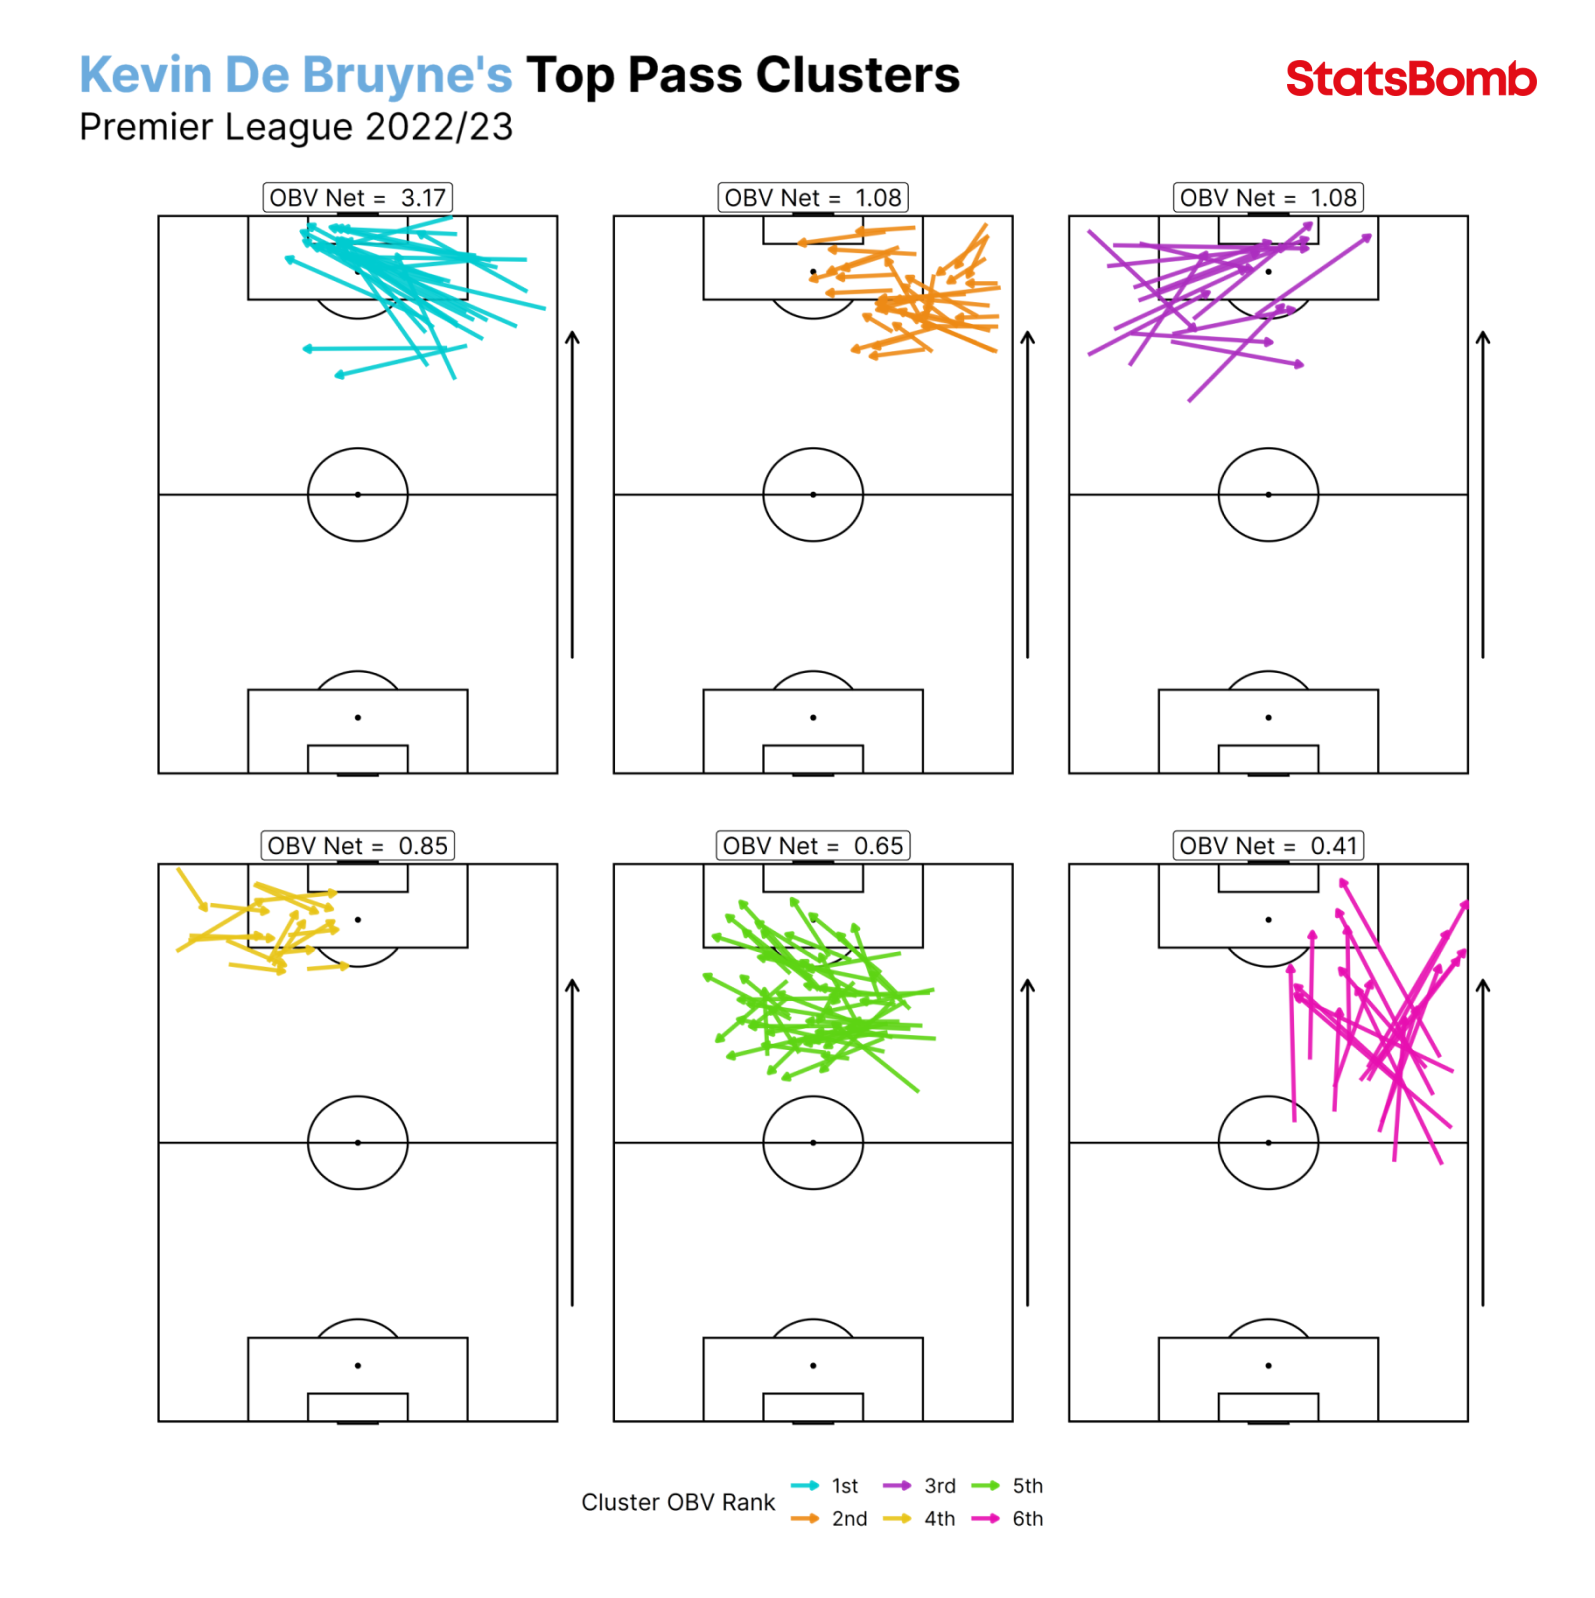
Pass clustering becomes even more powerful when combined with other metrics.
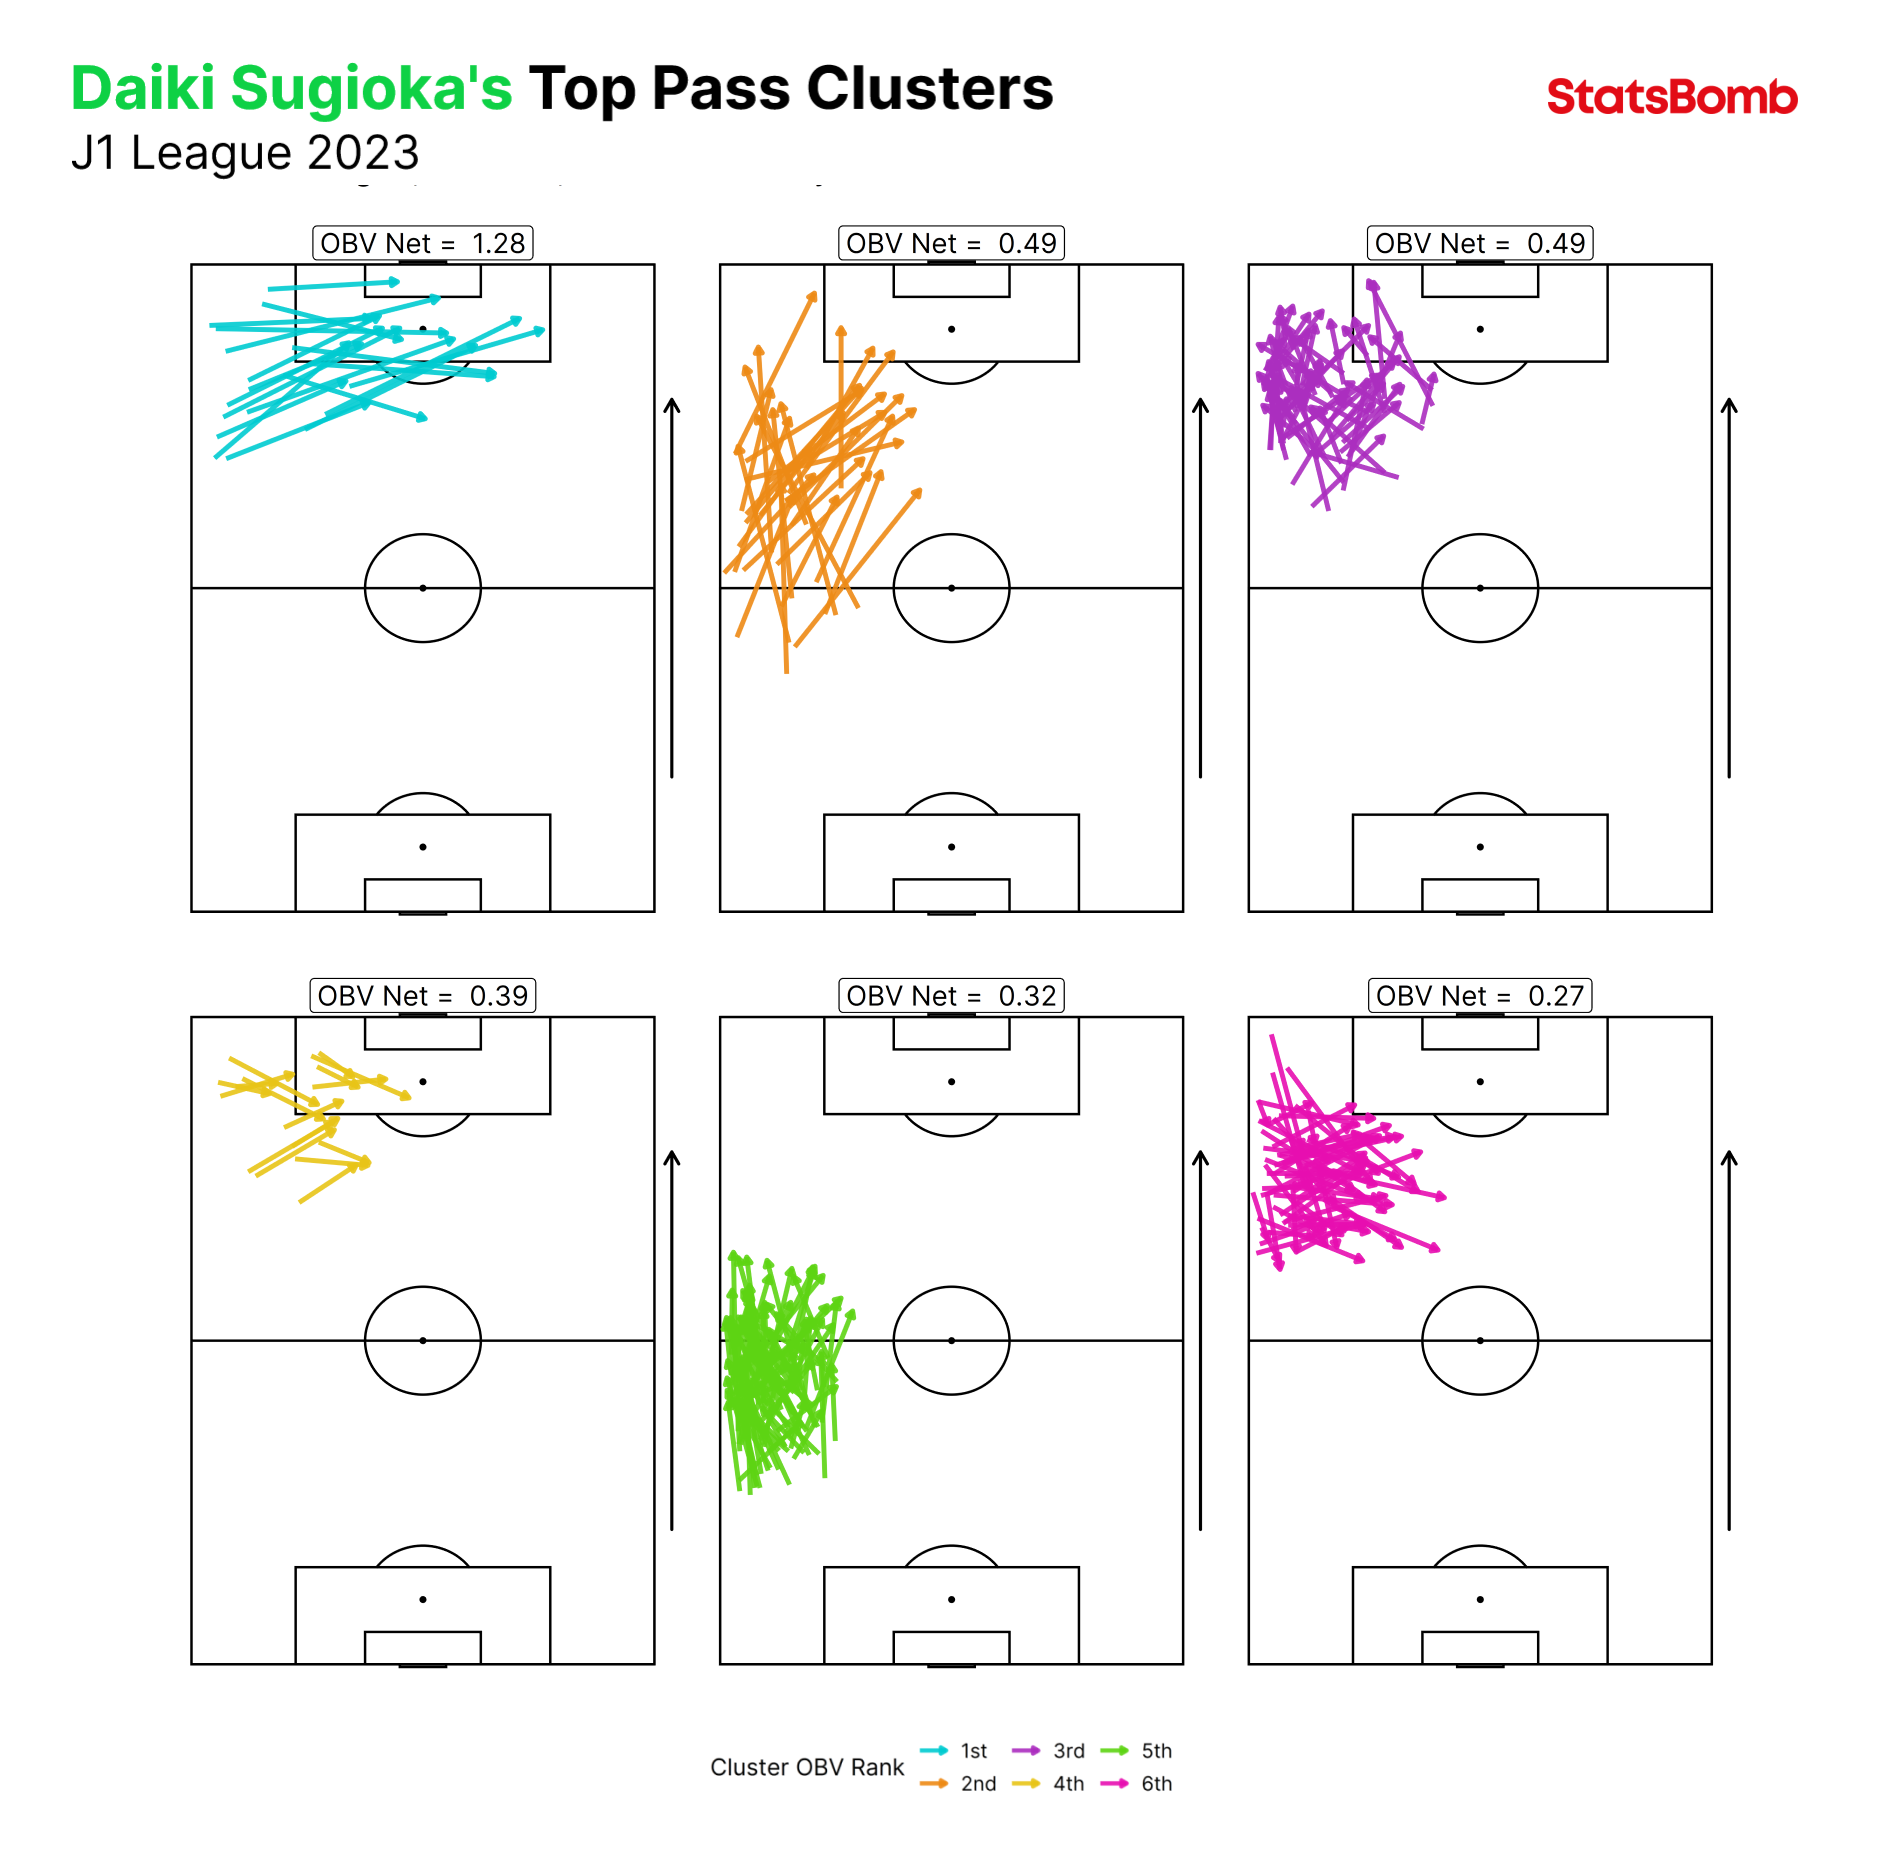
Say we’ve identified our next opponents’ most dangerous passer through video analysis or through metrics such as On-Ball Value (OBV).
We can combine OBV with pass clustering to analyse how that player creates value, looking at which passes they’ve generated the most danger from:
This also has potential applications in player recruitment, where a team may be looking for a specific passing profile to complement their game model, perhaps a particular type of pass for chance creation in the final third or ball progression from deeper areas.
Though we’ve so far shown outputs from the Big 5 leagues, it’s worth reiterating that both models are available to customers across the 120+ competitions we cover worldwide, as are all our models, at all levels of the game.
They can be used to analyse the EFL or National League in England:
Or across South America…
Or perhaps in Asia’s major leagues.
If you work for a club or federation, media or broadcaster, or gambling organisation and want to know more about how StatsBomb’s data, analytics and tools can help you, feel free to get in touch today.
