Last week, we released phase one of our Goalkeeper Module onto the StatsBomb IQ analysis platform. There have been others to do analysis at the individual level (Sam Jackson, Paul Riley), and I'm sure some teams have built frameworks, but to my knowledge, it's the first broad scale analytical tool to help evaluate GKs released into the market. Today I want to discuss the framework we chose to use, and explain some of the decisions and visualisations you will see in the coming weeks.
Our entire StatsBomb team worked on this, but the bulk of the legwork from a data science perspective was conducted by Derrick Yam, former goalkeeper himself and captain of his university soccer team. We also want to thank former professional GK, coach, and current pundit David Preece for his feedback and insight about the position.
Goalkeepers Are Weird
20 of the 22 players on a football pitch are largely similar. They kick the ball a lot and they kick each other a little. They use their feet a lot and other body parts a little. They pass a lot and they shoot a little.
Then there are these two other guys whose positions totally break the rules of the game. They are the only two players on the pitch who can use their hands in contact with the ball, and that presents some challenges, especially from a data-based analytical approach.
The other big oddity about goalkeepers is that they are the one position on the pitch that is totally reactive, and their stats outside of distribution (and even there, to a moderate extent) are almost completely dictated by the actions of the opposition.
With all of this in mind, we've focused our initial analysis on three primary areas:
- Shot Stopping
- Claims (cross and high ball collection)
- Distribution
What's interesting to me from our early research is that shot stopping displays a nice spectrum of good to bad that largely matches the eye test. Claim activity often feels more like part of a profile and not strictly good or bad, but we've discovered and will explain in the future that you can attach a value to this type of (in)activity.
Finally, you have distribution, which seems to be growing significantly in importance for the GK position. At this time we treat distribution as something to describe and characterise, and not something we can objectively say is good or bad. That may change in the future when we produce a robust GK distribution model we feel confident in, but one of the problems there is that goalkeeper distribution is more often dictated by coach systemic preference (play the ball short) and opposition defenses (a high press means you can't play the ball short), than regular goalkeeper choices.
Shot Stopping
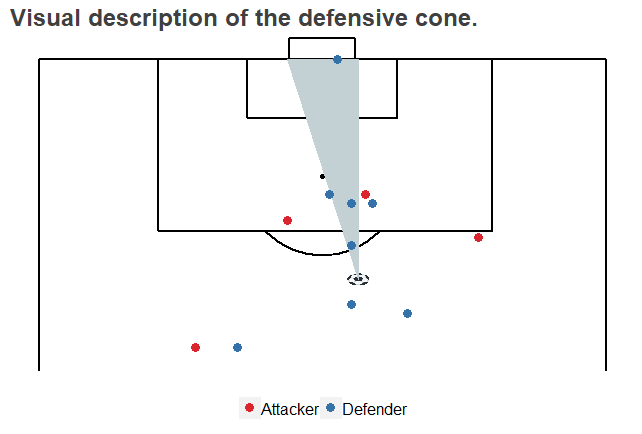
The difference between StatsBomb Data and data from our competitors is that for every shot, we collect the location on goalkeepers and all the defenders in the frame. What this allows us to do is properly credit GKs for positioning inside our models, as well as to better assign the difficulty in scoring to each shot.
The primary stats we use to evaluate shot stopping are Goals Saved Above Average on an aggregate level (GSAA), and Adjusted Save Percentage (aSV%) on a per shot basis. [Update: This is becoming GSAA% next week to align the names and help avoid confusion.]
To make this a little easier to understand, let's use the example of Manchester United's David De Gea.
- Last season David De Gea conceded 25 non-penalty goals.
- Our underlying model believes that, given the shots he faced, post-shot expected goals on those shots adds up to 38 goals we expected to be conceded.
- Therefore the Goals Saved Above Average by De Gea last season was 13.
To look at it from a percentage perspective, we expected De Gea to save 73.2% of the shots he faced last season. He actually saved 82.4%, giving him an Adjusted Save Percentage of +9.2%.
In layman's terms, David De Gea was absurdly valuable between the posts for Manchester United last season, saving around 13 more goals than an average GK would save.
Saving goals and scoring goals are not completely comparable, but if they were, DDG would have been the 9th highest scorer in the Premier League last season.
- To flip it around, given the on target shots he faced last season, the model expected Joe Hart at West Ham to concede 27.2 goals.
- He actually conceded 34 non-penalty goals, giving him a GSAA of -6.8.
- His expected save percentage was 69.1, while his actual save percentage was 61.4, giving him an Adjusted Save Percentage of -7.7%.
No numbers take: Joe Hart was unfortunately not great last season.
A couple of general notes on shot stopping while we are here...
First of all, it's inherently pretty noisy in smaller samples. A couple of mistakes or even minor imperfections can send GKs plunging down the table in the early parts of the season, but that doesn't really feel unfair, because GKs probably should be punished in the rankings when they make mistakes. A few weeks ago, Joe Hart and De Gea were 10th and 11th in our shot stopping rankings for this season's PL. Right now, De Gea is 3rd and Hart is 13th.
The big thing the model delivers that the eye test does not is that the model is capable of correcting for the difficulty of shots faced. It wasn't Fabianski's fault that Swansea gave up a ton of good chances last season on the way to being relegated. However, controlling for that, we still think Fabianski did quite well, ranking third in aSV% among GKs that payed a lot of minutes last year.
One big question is: how repeatable is shot stopping performance? If a GK is impressive one season, is he likely to continue being impressive in future seasons?
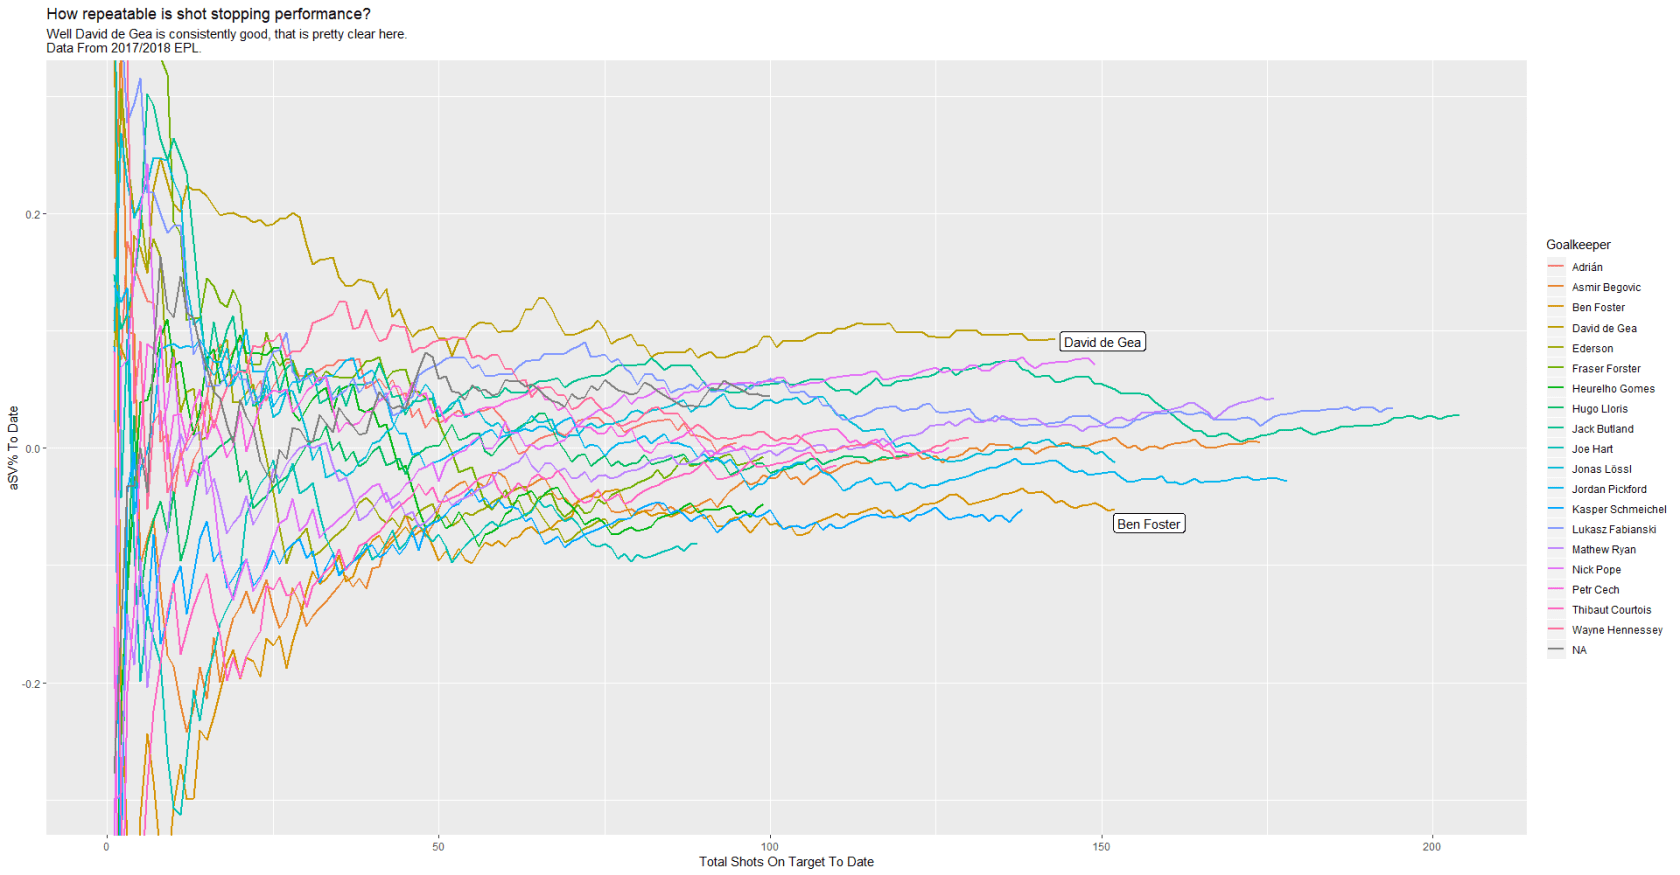
Early research suggests yes. If it's true, that's a remarkably big deal.
Now obviously shot stopping isn't the only thing keepers do. Depending on what style of play you want to execute, other skills can be nearly as important.
Claim Activity
We've done fairly extensive work to look at activity around balls into the box, and how to profile player behaviour in this area. Being active and coming off your line to claim crosses and high balls probably doesn't have as much value as elite shot stopping, but it does have some value. Stopping high balls in the box from becoming potential shots is a useful skill. Keepers can't "just stay on their line" and play the position optimally.
Unfortunately, all that stuff is packaged into Phase 2, which isn't due to be released until next week.
Stay tuned...
Distribution
Our objective on the distribution part of the module was to profile keeper ability to complete passes, locate counter attacks, and begin the attack. As noted above, right now it's very much about profiling and not about defining whether GKs are objectively good or bad at passing.
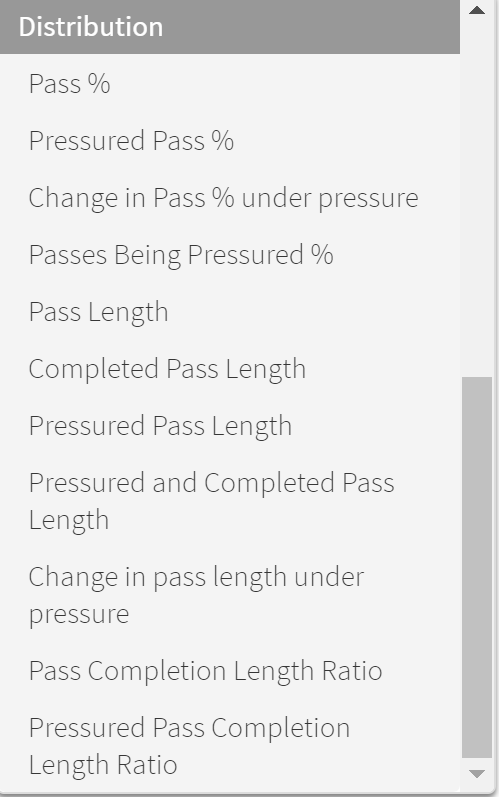
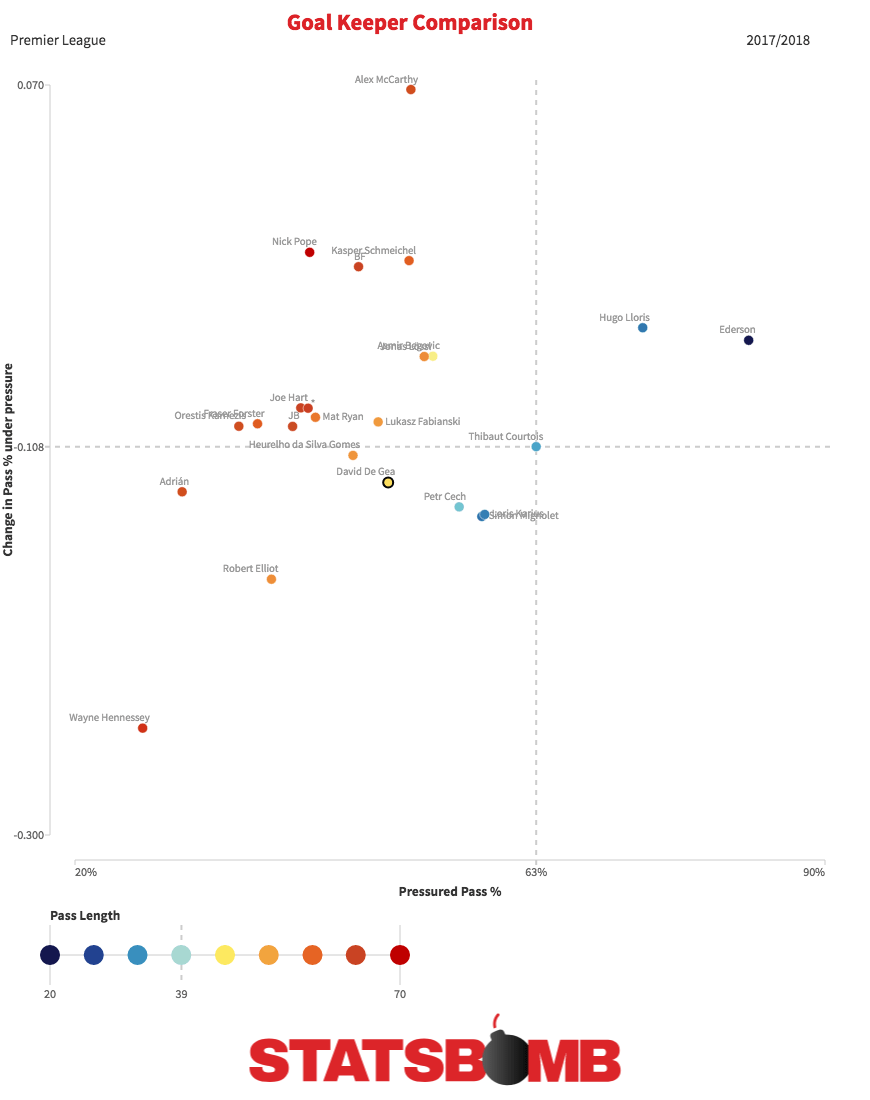
So in the plot below, you see the change in pass completion% when a goalkeeper is being pressed versus when they aren't on the vertical axis. The horizontal axis is pass completion% for passes under pressure, and the colour is the average pass length.
Scatterplots
As part of the GK Module release, we also built an internal scatterplot tool to help visualise player strengths and weaknesses inside StatsBomb IQ. You can also use it on any player and team level metrics (alongside treemaps and bar charts). Here are some fun comparisons of La Liga GK stats from last season.
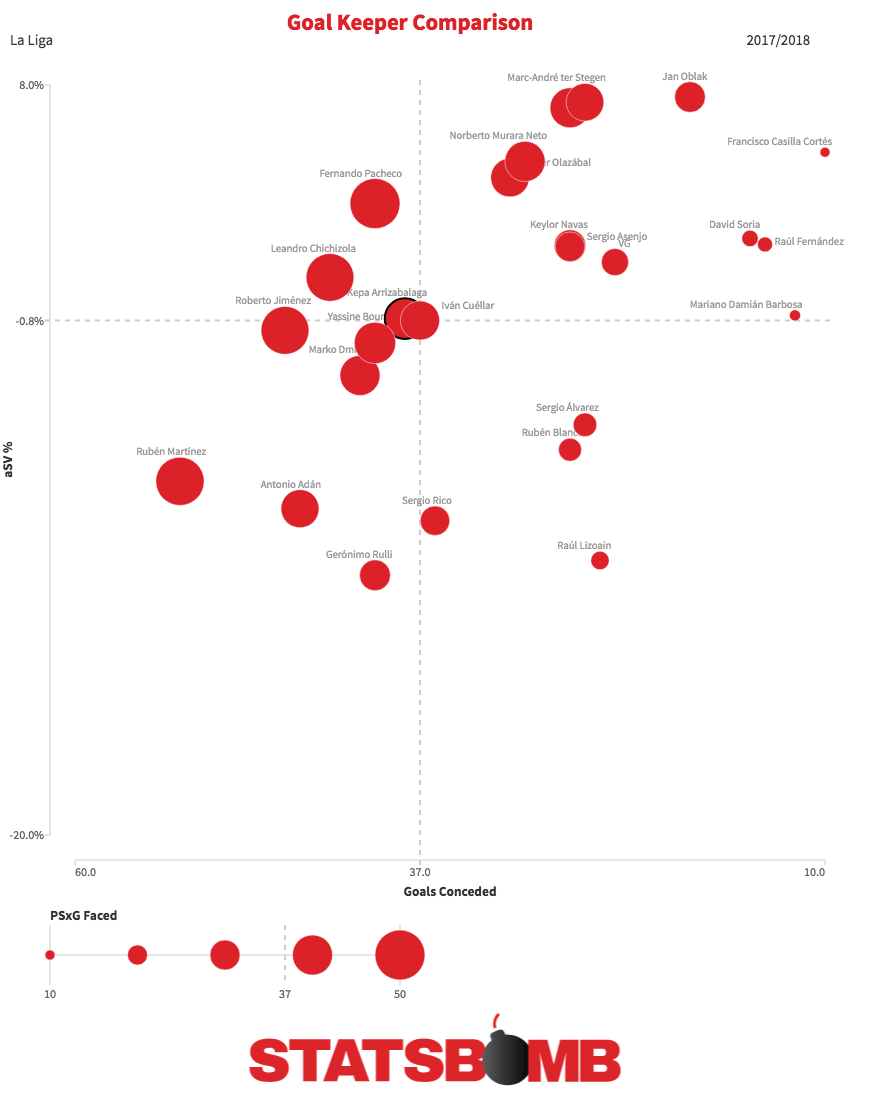
Oblak and ter Stegen? Pretty good. Who knew?
Anyway, after months of work, this is just the start of what we're producing for Goalkeeper analysis with StatsBomb Data and StatsBomb IQ. Rumour has it, Managing Editor Mike Goodman is so excited that he's going to dedicate an entire week during the international week to Goalkeepers.
It will be like Shark Week. Except for goalies.
--Ted Knutson
ted@statsbomb.com
@mixedknuts
Bonus Scatterplot
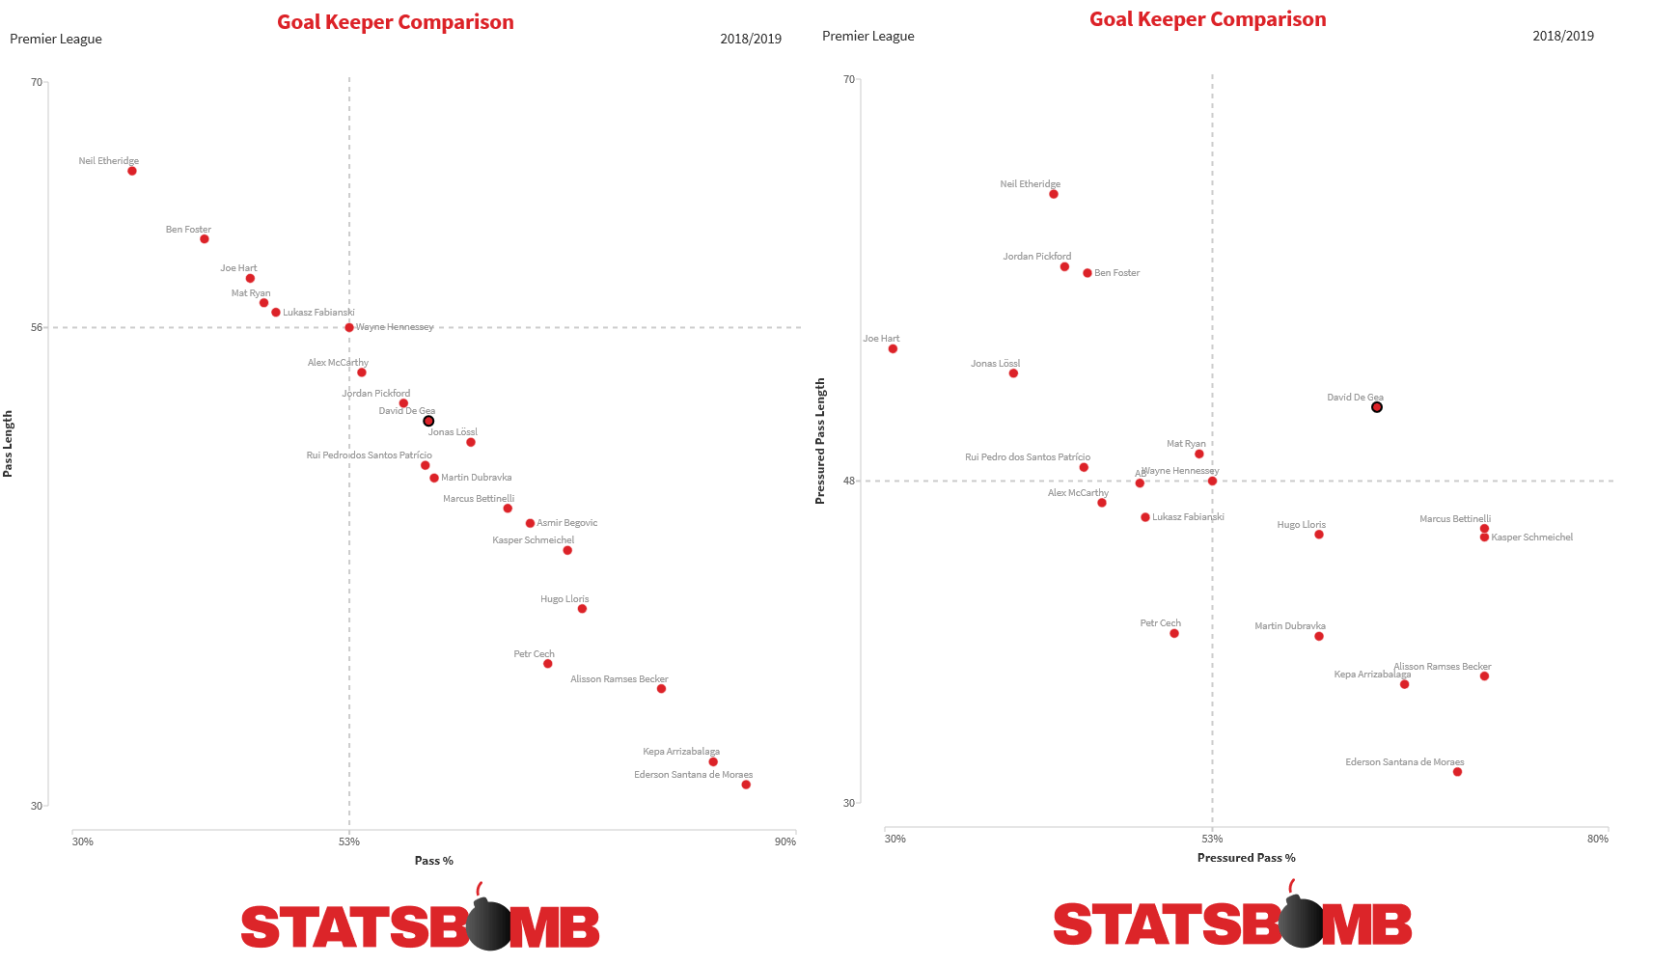
In a surprise to absolutely no one who has been paying attention, pass length and pass completion are almost completely correlated. But when you add pressure into this mix? Well, that starts to get interesting.
Splash image of David De Gea courtesy of the Press Association.
