If you read my Introduction to Manager Fingerprints, you know I’m pretty excited about this line of research. Statistical output for football teams is a function of both talent and tactical systems, but it appears that at least some managers (like Mark Hughes) end up with similar statistical production almost in spite of differing talent levels. This area of research is incredibly deep, because you can apply it to every single manager across every single league you have statistics for, both currently and historically.
It’s also tremendously interesting because it creates an actual consulting product that teams who are searching for new managers can and should use. You want to know the managers out there across leagues whose teams have the best (and worst) statistical output. In fact, I would immediately argue that teams trying to hire a new manager need to know these things just to prevent themselves from making big mistakes.
I’ve got a few more ideas I pitched to the guys at Opta that I want to write about, but here on StatsBomb I wanted to talk about one of the most exciting young managers in Europe – Andre Villas-Boas.
AVB
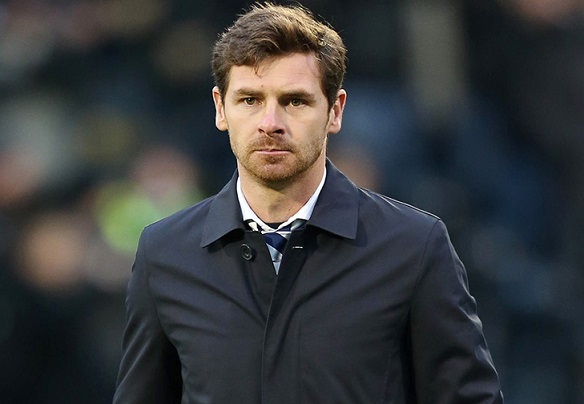
From Porto to Chelsea to Spurs - and nearly to PSG this summer - Andre Villas-Boas is a manager in demand. A fresh-faced 35 years old, when hired AVB comes complete with ginger beard, gravelly voice, and an alleged general disdain for stats. Yet he also employs a tactical system that produces statistical output that is an analyst’s wet dream, and it is wickedly consistent.
According to Wikipedia, for his first managing gig he took over Academica Coimbra when there were bottom of the league without any wins, in October 2009. By the end of the season, they were 11th in the league, 10 points clear of relegation. Unfortunately I don’t have any stats from that season, but we do have the stats from his next stop.
Check this out.
This is AVB at Porto. Granted, those numbers are fuelled by the best talent in the Portuguese league, but they are tremendous. Shot Dominance of 1.92 (meaning they shoot they ball almost twice as often as an average opponent) is outstanding, as are the shots on target percentages, especially on the defensive side of the ball. 27% of opponent shots on target would almost always be one of the leaders in Europe for that metric. In his one season at Porto, AVB went undefeated in the league, won the Portuguese Cup, and the Europa League, not unlike his mentor Jose Mourinho.
In fact, I ran the rest of Porto’s stats from that year through the predictive model, and while the level of league competition is different, Porto graded out like Bayern Munich from last season. Cruising to the Europa League was no problem.
For reference, Porto had finished third the season before, 8 points behind Benfica. In AVB’s one season they won the league by 21 points. 2.82 points per game in a league season!
That summer, Roman Abramovich hired him away from Porto (paying 15M euros for the privilege) and made him the new Chelsea manager.
His time at Chelsea was (allegedly) fraught with personnel clashes. AVB’s system requires his team to employ a high line to allow selective defensive pressing within a confined space. This is especially true when employing two midfield destroyers, who hunt the ball and immediately recycle it to attacking players. He was also hired to help transition Chelsea away from their aging, Mourinho-built core into a newer, younger team. Unfortunately, John Terry and company were not very interested (or capable) of playing AVB’s preferred style, which resulted in all sorts of political stuff leaked from the dressing room and into the press. It also resulted in way too many great chances for opposing attackers – note the shots on target conceded percentage - and AVB was eventually fired in March.
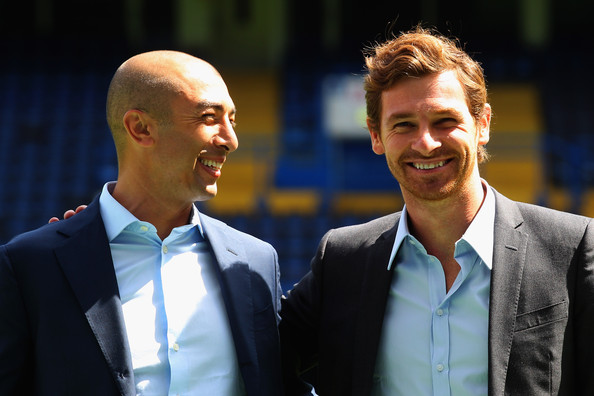
Chelsea would go on to win the Champions’ League title that season under assistant manager Roberto DiMatteo.
Things might not have worked out quite how he hoped, but you can see the outline of what AVB was working toward. Play the high line, employ faster center backs in defense, tighten up a bit, then drop the shots on target while pushing the shooting pace. Another year of personnel changes and he might have gotten there.
Note the incredibly large dive in Shot Dominance and overall effectiveness once DiMatteo took over the same personnel. They may have managed to grind out a Champions’ League title, but a team with those stats would never win the league.
Never one to overlook a quality bargain, Daniel Levy hired AVB as Harry Redknapp’s replacement that next summer, and this is what AVB’s teams have produced at Spurs.
Look familiar? This season should look even better, as Spurs parlayed Gareth Bale’s skills into talent upgrades all over the park.
Three different teams, three different groups of talent, two different countries, and yet the system is producing nearly the exact same thing year in and year out. Everything we had been told previously suggests that’s not supposed to happen. This type of statistical output is very often the product of teams that win the league. Granted, Villas-Boas has gone to teams with pretty good talent levels each time, but look at the difference between the stats Chelsea produced under him versus what they did immediately after under Di Matteo. That’s massive.
Look at what he did at Spurs with the same group of guys versus Redknapp, and you see nearly identical offensive shot stats, but the defense got much tighter. As a result, Shot Dominance ramped up. This year, you’ll probably see that improve slightly again.The key to winning the league, however, will be improving the shots on target numbers to closer what they were at Porto (Premier League average is about 32.5%). It could still happen, since Spurs have better personnel in nearly every spot except whatever role Gareth Bale was actually playing.
That said, they are still integrating the new players into the offense, and they still have some fairly serious issues defending set plays, which thus far in the season is hurting the shots on target numbers at both ends.
I would be shocked if Spurs don’t make the Champions’ League this year. Despite massive spending disadvantages compared to the rest of the top teams, they might even be a reasonable dark horse contenders to the league title.
This would not have happened under Harry Redknapp.
All data used in this piece is from Opta.
Abbreviation Guide
Shot PG – Shots For, per game
SOTPG – Shots on Target For, per game
SOT% - Shots on Target percent
ShAgPG – Shots Against, per game
SOTCPG – Shots on Target Conceded, per game (sometimes written as SOTCON)
SOTC% - Shots on Target Conceded percent
ShDom – Shot Dominance. This is a metric that looks at how many shots a team takes versus concedes against average competition. Greater than 1 means a team takes more shots than average opponents, less than 1 means they take fewer than the opponent. This is a different way of working with TSR (Total Shots Ratio)
Poss – Possession Avg_PPG – Average points per game in the league table for that season.


