During the short time that I've been involved in football analytics I've learned a few things about match prediction, or more specifically win percentage prediction, which is very interesting from a betting perspective because it allows you to directly compare your own predictions to the bookies’ odds and see if there's value in a specific bet.
As I see it odds prediction consists of two major parts: predicting the relative strength of the two teams involved in a match, and estimating the likelihood of a certain outcome given this relative strength. This article is about the second part. It’s common knowledge that given an ‘expected goals’ value for one team in a match, you can calculate the probability of that team scoring a specific number of goals quite easily by using a Poisson or binomial distribution, which can then be turned into win percentages. This actually gives remarkably good results, but it’s not perfect.
It can’t be. It’s ‘only’ simple mathematics so it assumes that the probability of a goal being scored during the time frame of a match is fixed and independent of other events. We know that this isn't the case in reality. For example there’s something called ‘score effects’. The ‘game state’ (in this case the goal difference) influences the probability of scoring, and obviously the probability of scoring eventually influences the game state.
Measuring Effects
After analyzing data from the last four full Premier League seasons I've identified some more of these effects and by putting them together you can see a sort of ‘system’ taking shape that explains/models how a match progresses and that can be used to simulate a match and figure out the chance of a certain outcome.
To do this I've divided each of the 1520 matches into 10 sections and measured team performance (ExpG) during each section, comparing different initial game states (in the broadest sense, not just the score).
Here’s the theory: assuming a random team at a random time and a random game state, all we know is a theoretical average scoring probability. For any extra ‘information’ (about the team, the game state, etc.) we can measure the effect that is has in terms how much it causes the probability to deviate from this theoretical average.
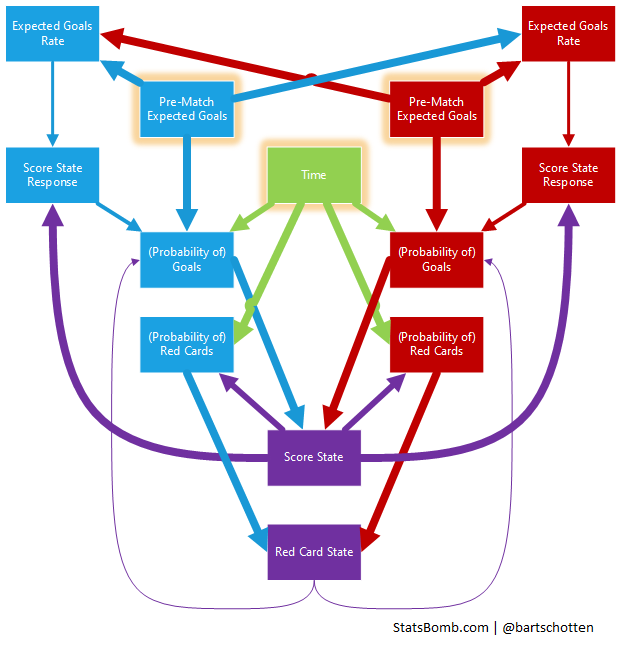
The probability of scoring is influenced by these (independent!*) effects:
- Initial, pre-match expected goals (how good the team is on paper, including home advantage etc.). On average this causes a 43% deviation.
- Time (it’s well known that the amount of goals significantly increases as the match goes on). Average deviation: 14.5%
- Response to goal difference (score effects): 8.5%
- Red card state (being a man up or down): 2.5%
This might seem counter-intuitive in the sense that a red card obviously has a much bigger effect on scoring probability, but the chance of the situation occurring in the first place is also taken into account here, and a team being a man short happens less than 10% of the time. Similarly a goal difference other than 0 only happens about half the time, while the factor ‘time’ itself is always at play.
A note on score effects: I've noticed that score effects are much more pronounced in games where the teams are evenly matched. If a team is really dominant (on paper) they seem to stick to their plan and continue to create a similar amount of chances even when ahead.
It’s also interesting that the total amount of goals scored has no clear effect on the future probability of scoring. Something can seem like an ‘open game’, but that’s mostly in retrospect, as it has little predictive value. Finally you can take this one step further because the probability of a red card occurring isn't fixed either. It’s heavily influenced by:
- Time. Most red cards occur late in the game: 52%
- Goal difference: the chance of receiving a red card somehow increases by about 50% when a team is trailing by one goal. On average this causes a 14.4% deviation.
At this point I’m really stretching my data though, and as sample size is becoming a problem that’s as much detail as I’m daring to go into.
The full picture looks like this (the size of the arrows roughly corresponds to the strength of the effect):
To test this I've built a little “simulator” based on the underlying numbers. It works by taking only initial ExpG values and running through the match in a number of iterations in which the game state influences the scoring probability and the probability (potentially) influences the game state.
It does seem to produce reasonable results, although the jury is still out on whether it’s a significant improvement upon Poisson. As far as betting goes it does have the potential added benefit of being able to quickly run some numbers as the state of the actual game changes (for example after a red card).
*For example: to see the effect of goal difference, the performance I measure is relative to pre-match ExpG and after correcting for the influence of time.
