Hudl Statsbomb and Radars are intrinsically linked. We’ve been using them for nearly ten years, giving regular updates to the design and layout in that time to ensure they keep pace with advances in our data. We’re here today because it’s time for another upgrade.
For those of you who might be new to Hudl Statsbomb or interested in a history lesson on the viz, you can find an article about the original baby steps in 2014 here. We discussed the limitations of the viz and why we continue to use them in 2017 here, and an article from 2020 on developing alternative viz options to marry up with the radars is here.
Before we take you through the positional templates and their new metrics, some Radar 101:
- The values at the boundaries of the radar represent the top and bottom 5% of statistical production by players in that position group across multiple competitions and seasons of data.
- The data points are calculated per 90 minutes to normalise for playing time.
- Defensive stats are possession-adjusted to normalise for the opportunity a player has to perform defensive actions.
So why the upgrade? The reasons are two-fold.
One: we have much more data since we did our last update. We now collect over 120 competitions worldwide, and have full seasons of data going back to 2015/16. As a result, the pool of data we’re drawing from has increased significantly, and the template boundaries have been updated to incorporate this.
More importantly, we’ve developed several powerful new metrics in the last couple of years that have become central to how we analyse players internally — particularly On-Ball Value (OBV). OBV is a model that values each action based on the +/- impact it has on the team’s likelihood of scoring and conceding, and we use it regularly to gauge the value of a player’s actions.
After extensive research and rigorous testing, we’re confident the new radars represent a well-rounded measure of each position group, their quality and their stylistic output.
Feeling primed? Let’s get into the new stuff.
If you wish to skip ahead to the metric definitions, click here.
The New Radars
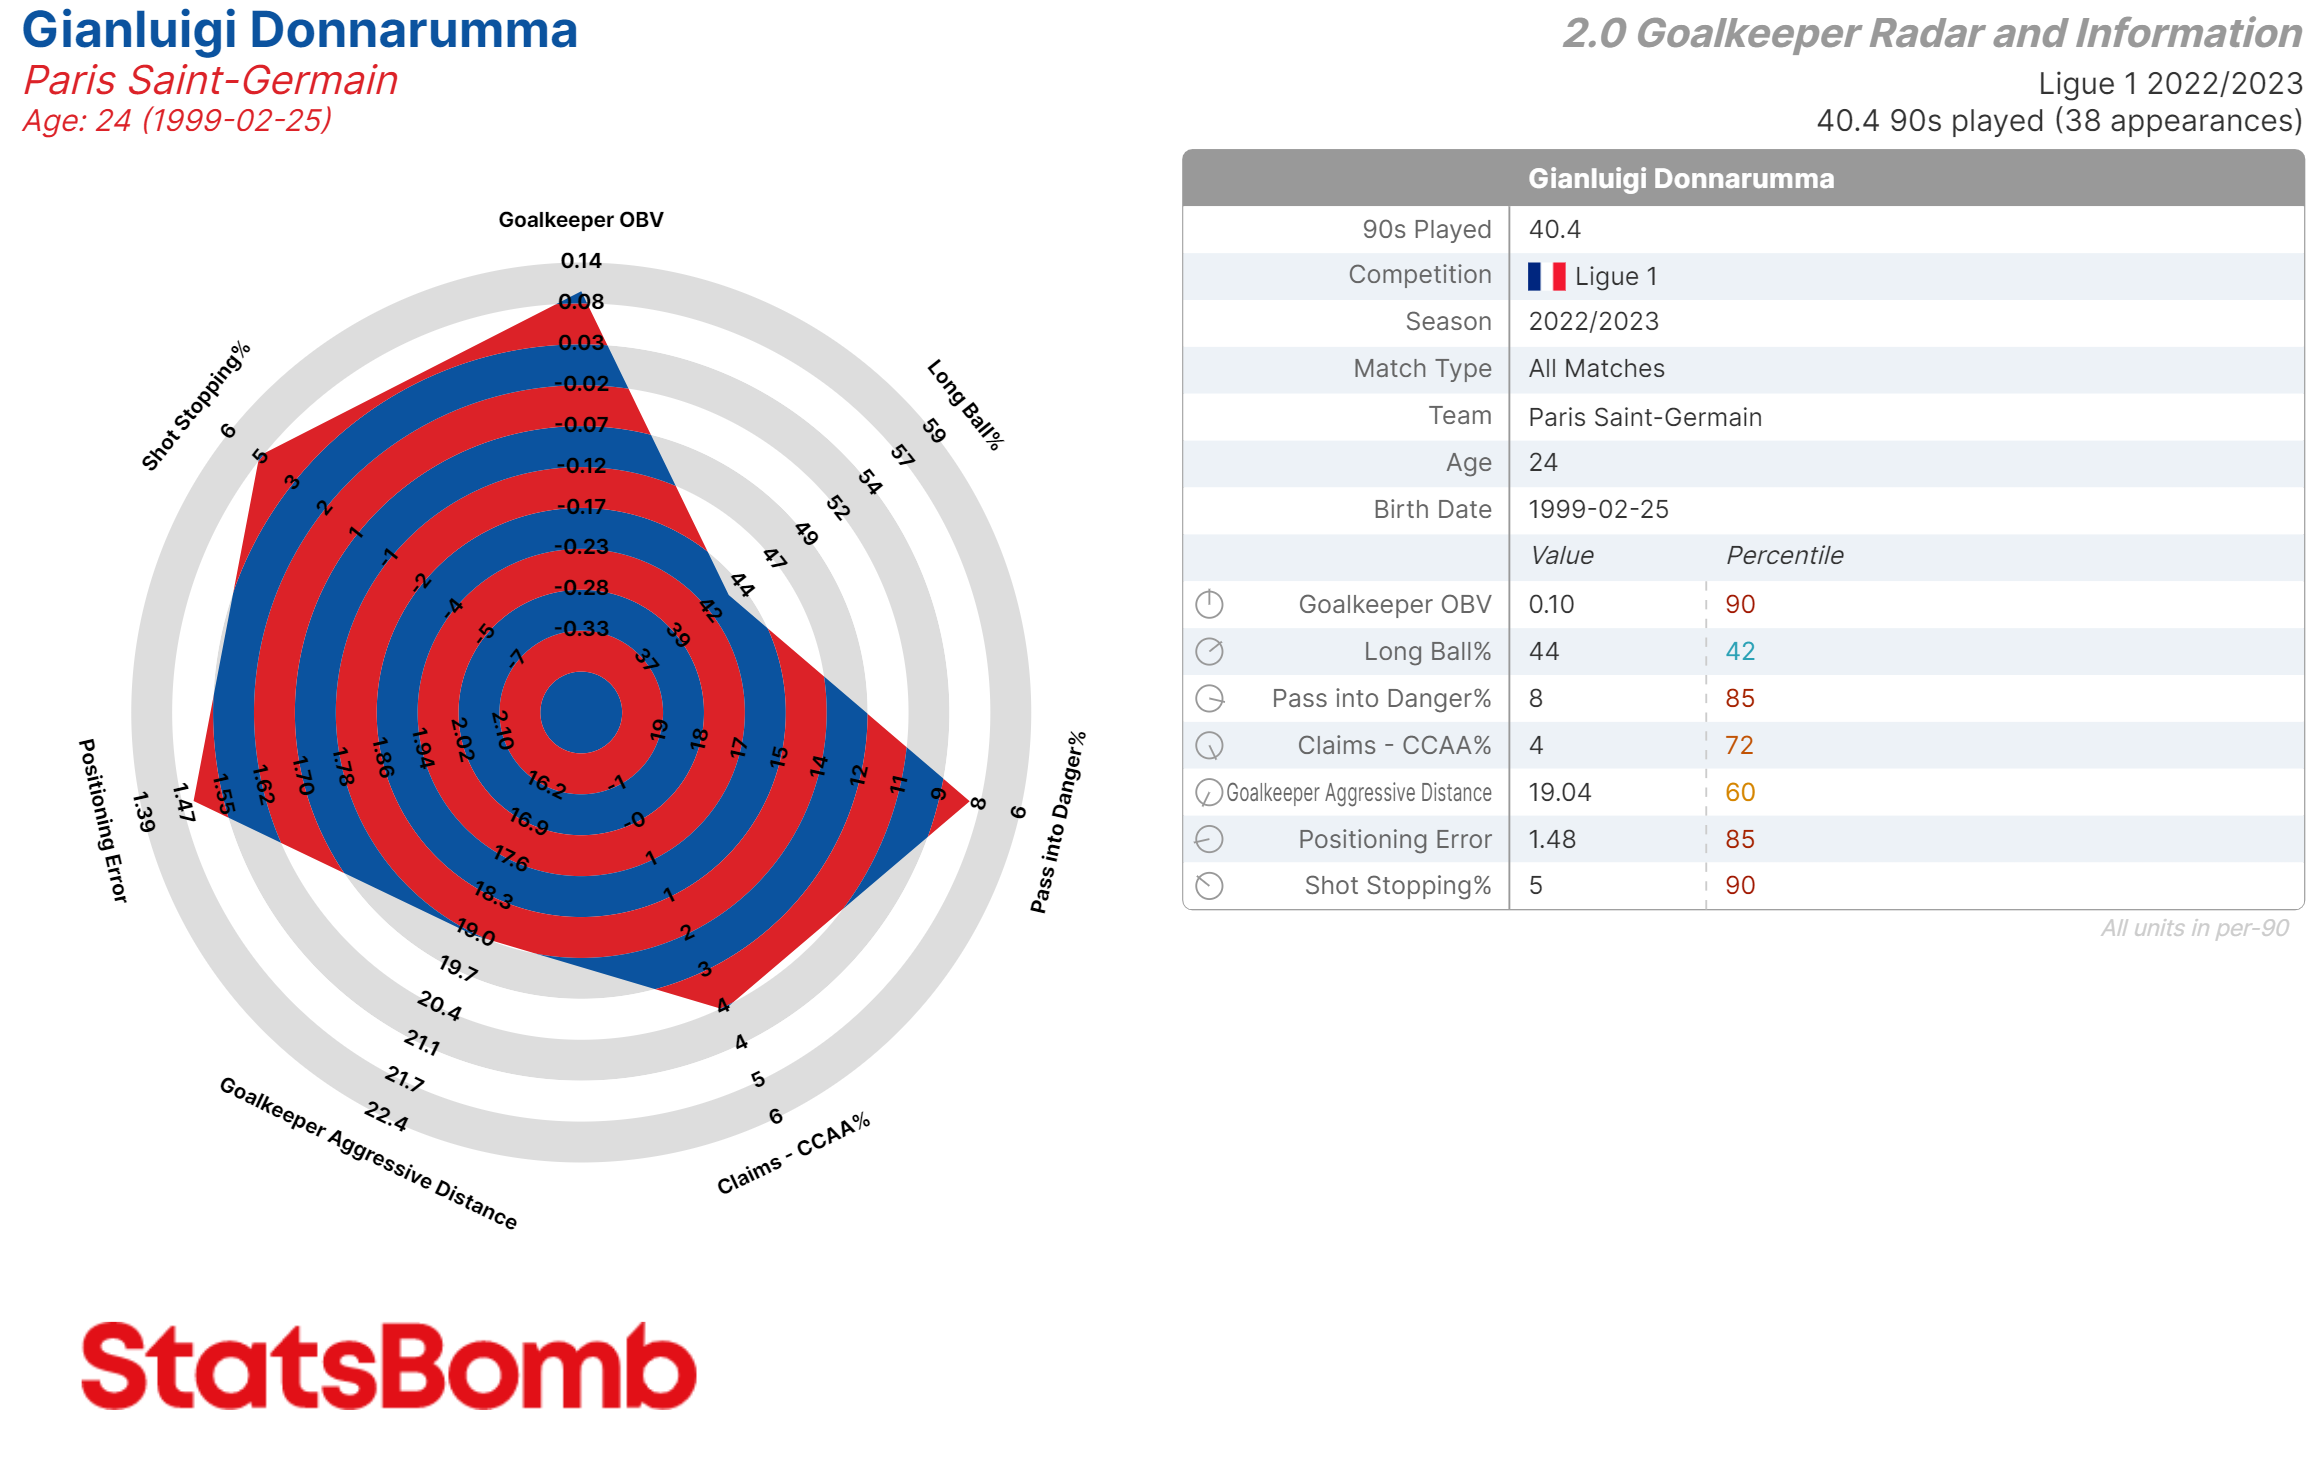
Goalkeepers
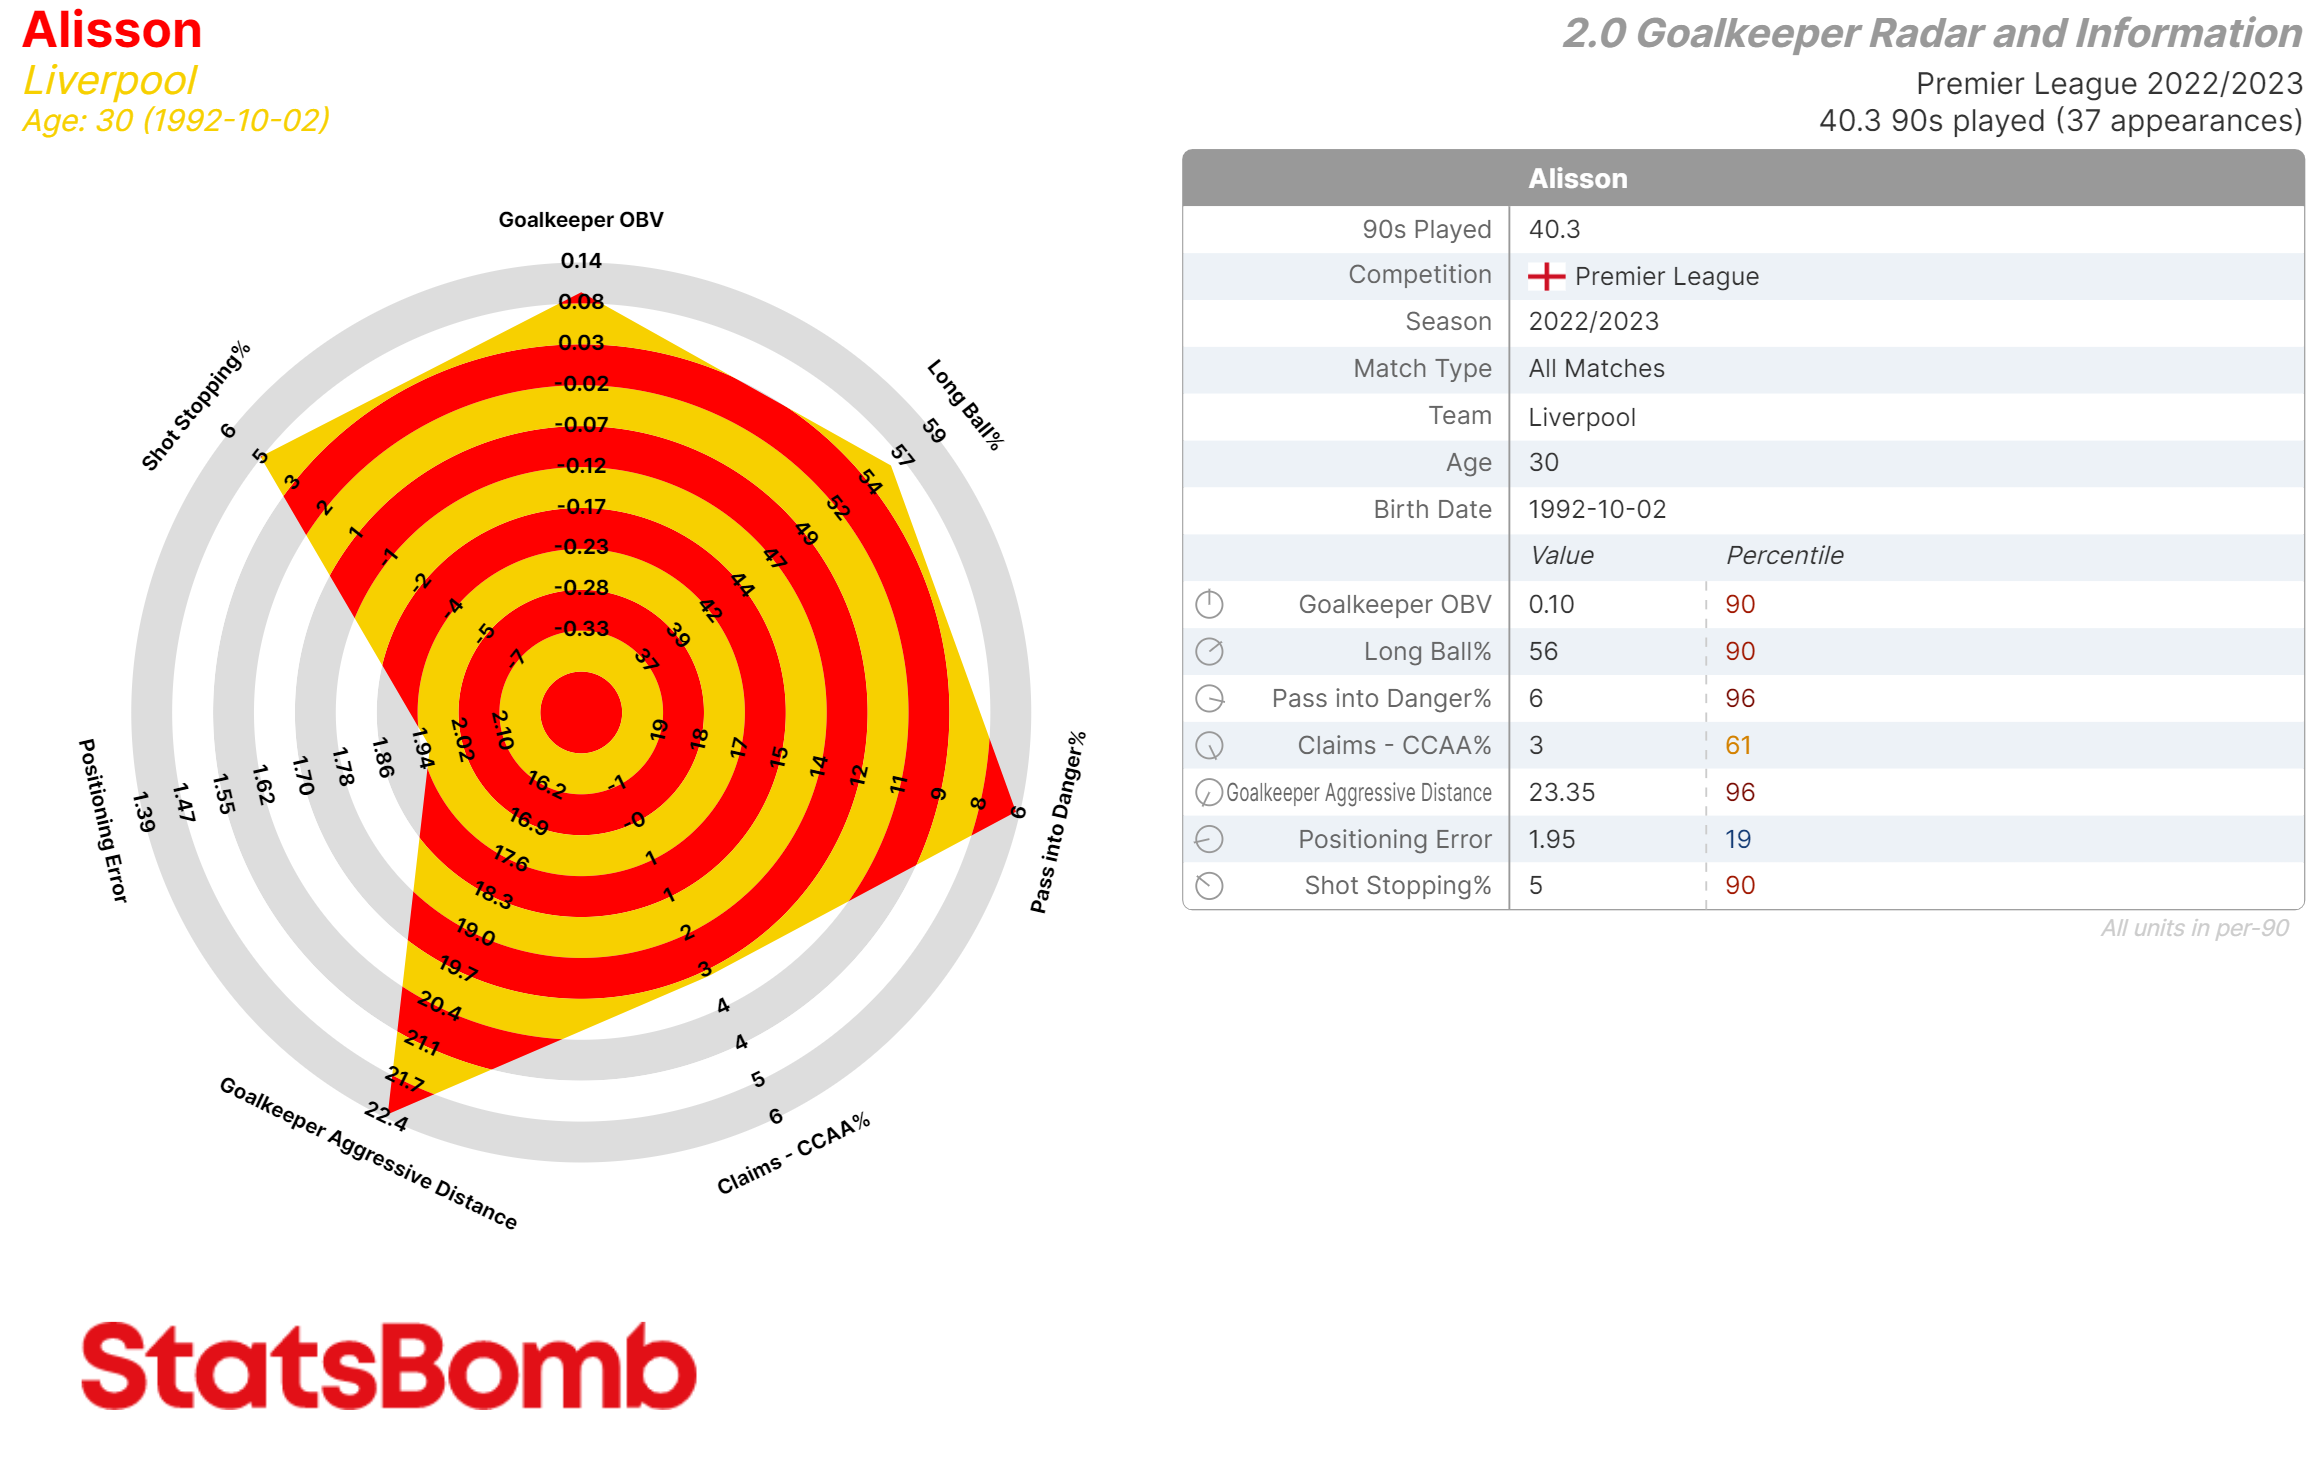
The template has two new metrics: Goalkeeper OBV and Long Ball %.
Goalkeeper OBV assigns a value to a goalkeeper’s goal-preventing actions – such as shot-stopping, cross-claiming, and sweeping actions. Think of it as an indicator of whether a goalkeeper is making a net positive contribution to their team or a net negative one.
Long Ball % measures the rate at which a goalkeeper completes passes over long distances. Being able to break a press and access teammates in space is a desirable attribute many teams look for in their goalkeeper in the modern game: Long Ball % was found to be the best metric to measure this right now.
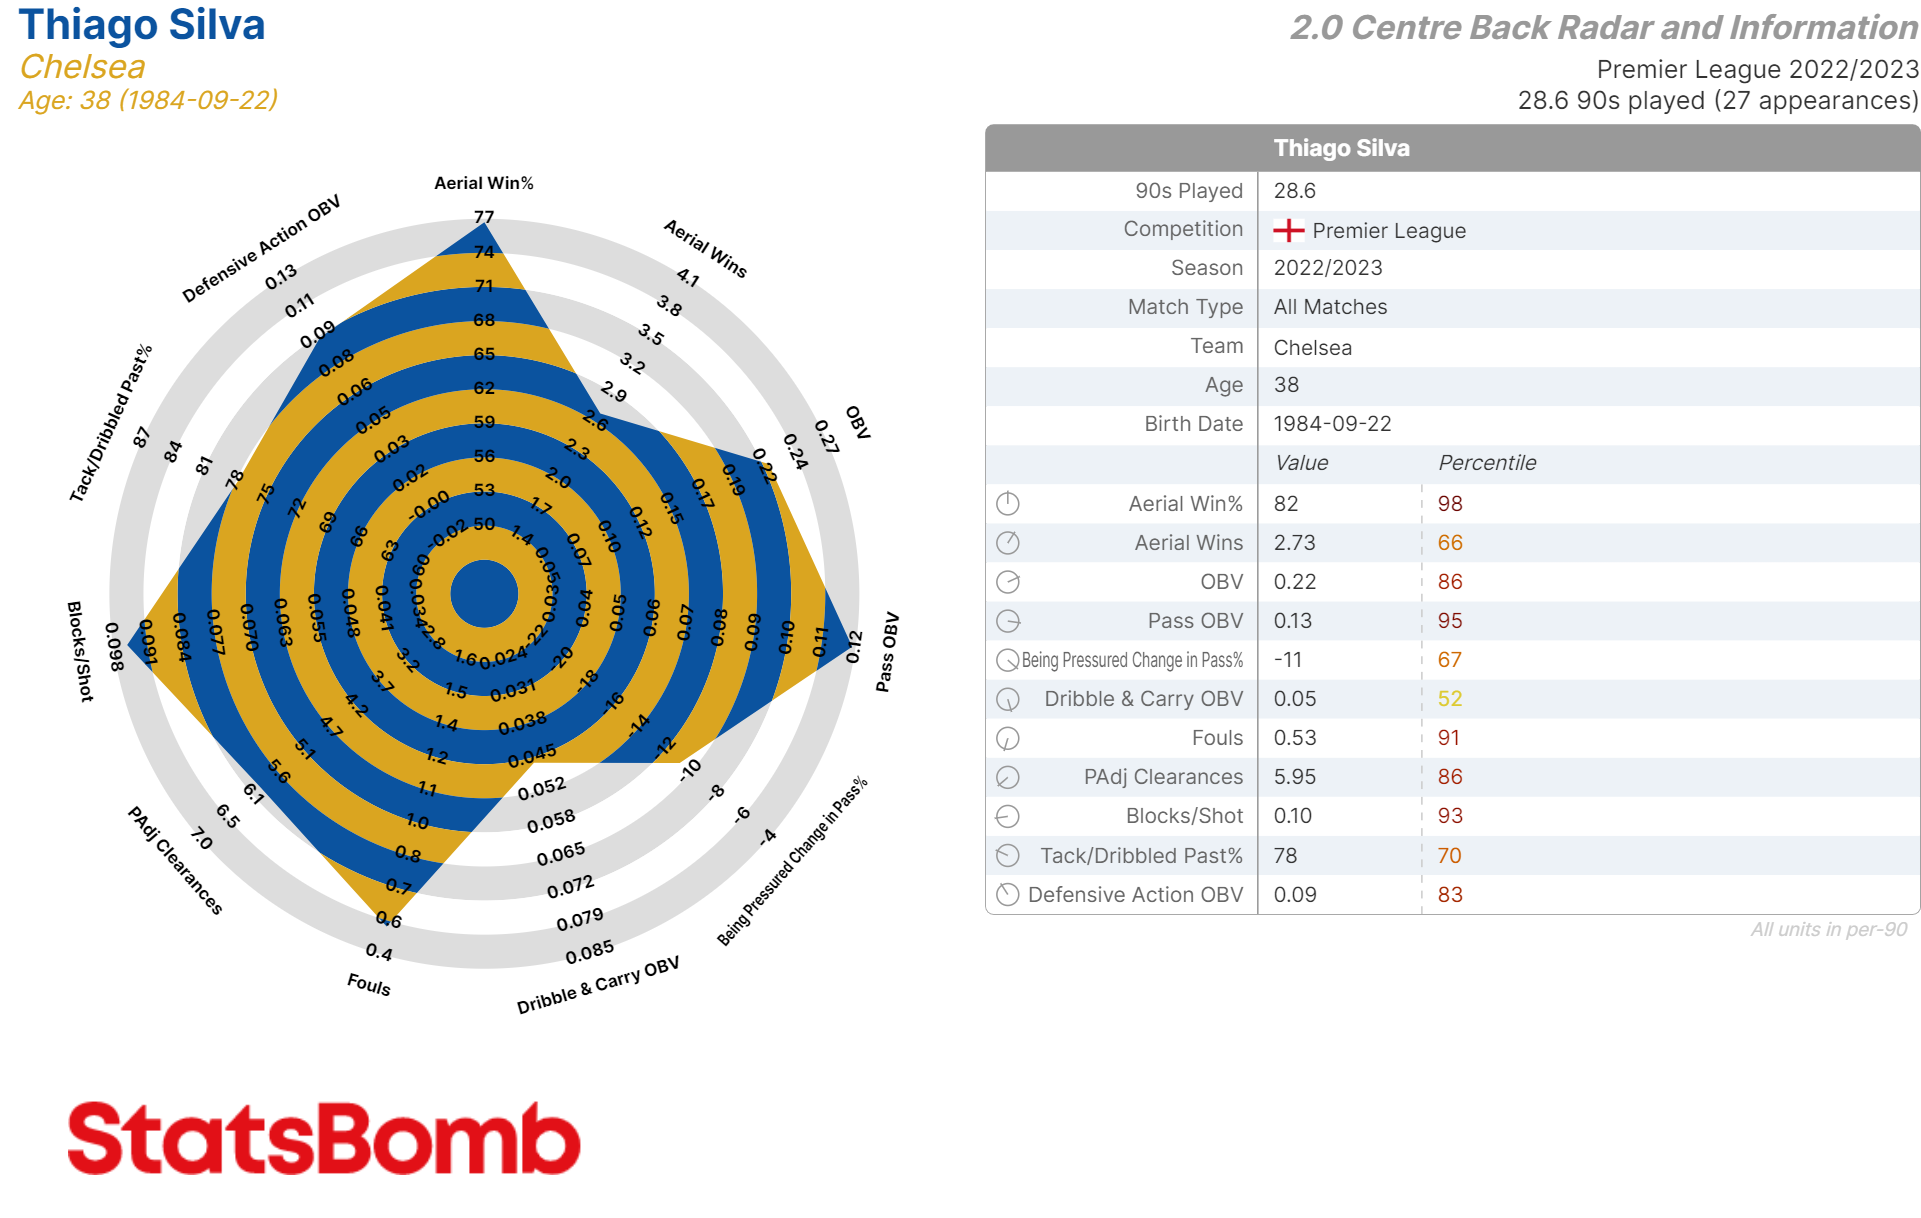
Centre Backs
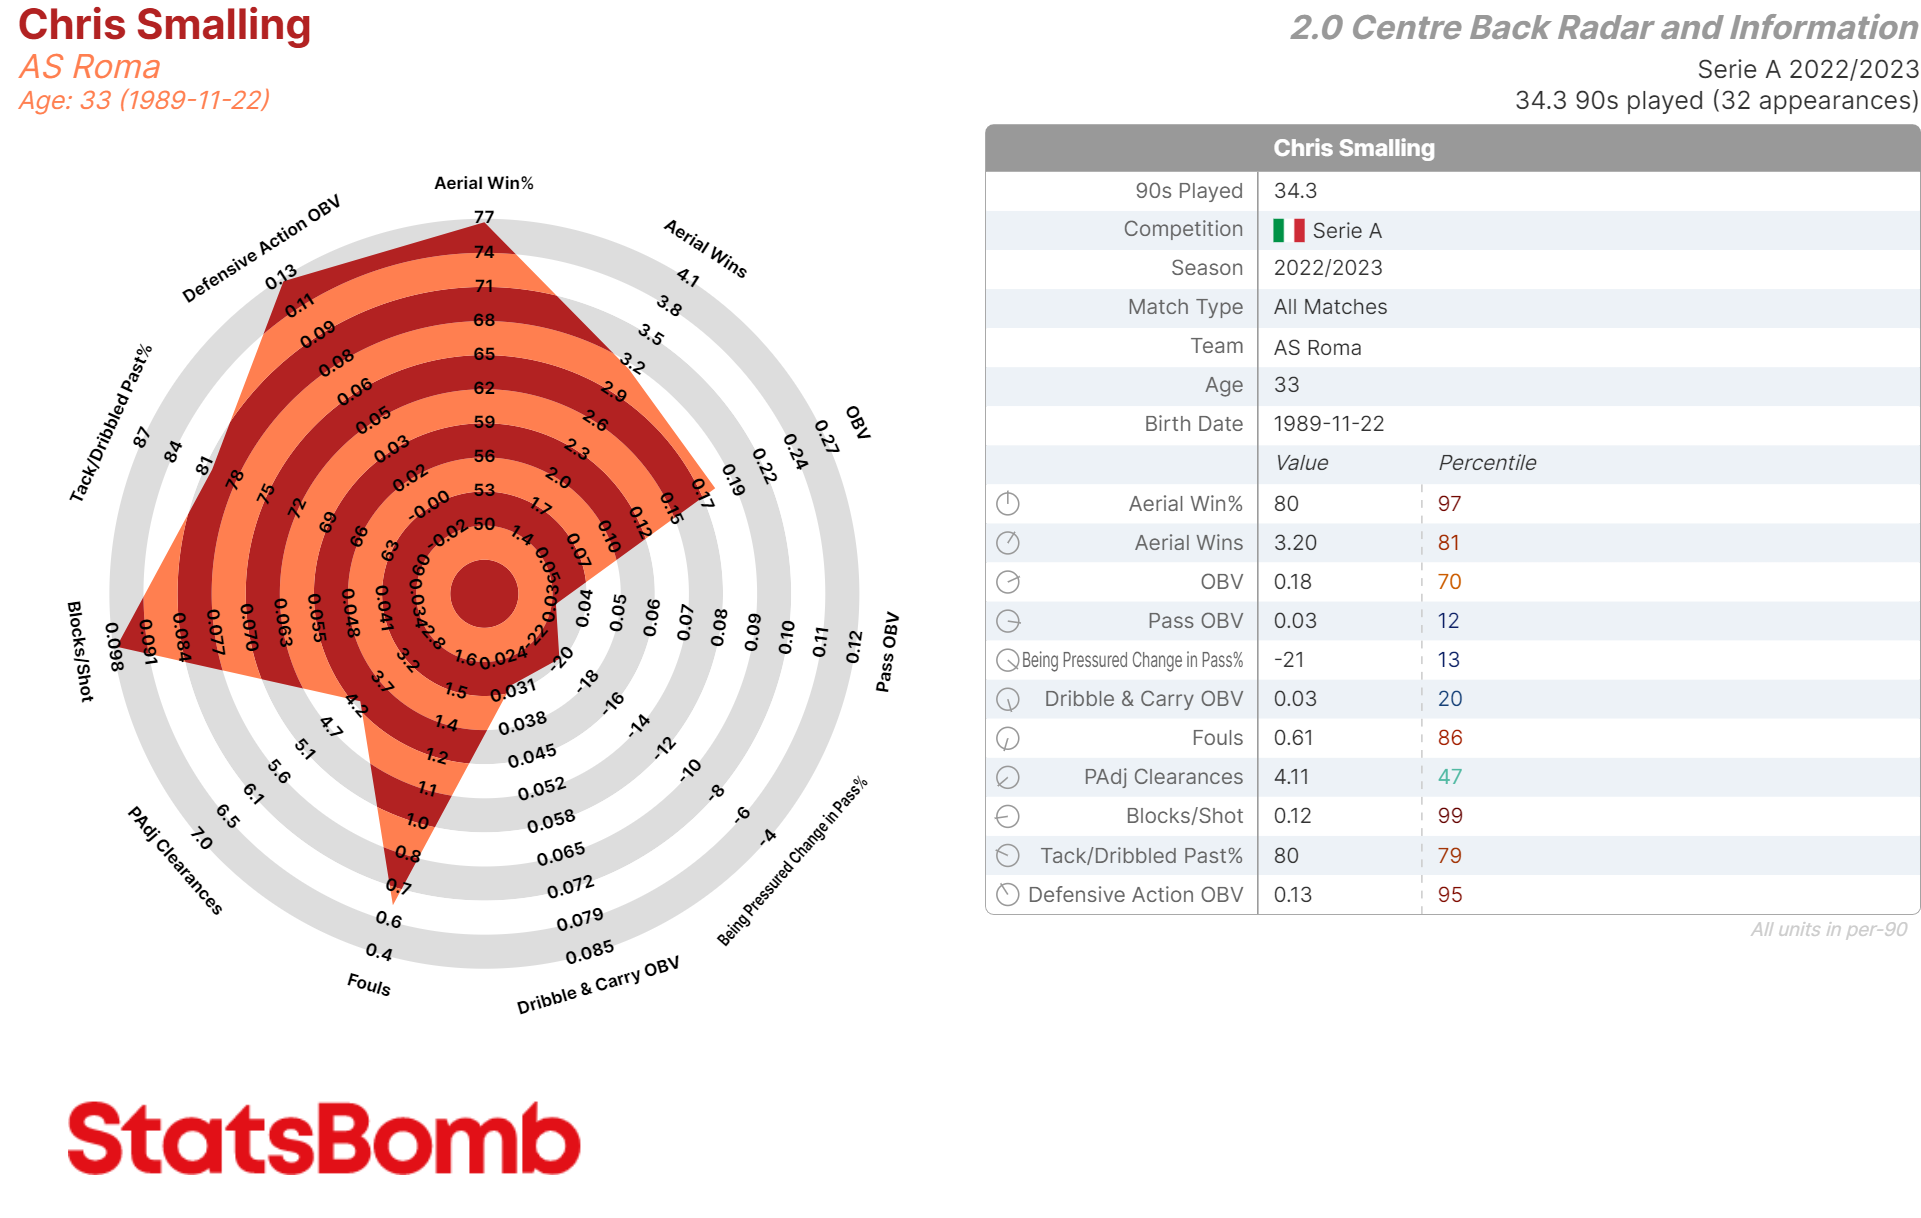
Centre Backs have had a significant overhaul, with seven new metrics on the template.
Because centre back outputs are tied to team tactical style, they’ve always been used more for profiling style rather than quality. These new radars are a bit – and we mean only a bit – closer to being a measure of quality over style due to the removal of several counting stats (Tackles, Interceptions, Pressures, etc) and the addition of more qualitative, contextual metrics (Defensive Action OBV, Blocks/Shot, etc).
That said, the message still remains: use caution when evaluating centre backs with data.
Defensive Action OBV works similarly to Goalkeeper OBV. Every time a player makes a defensive action, they receive a positive or negative value for that action based on its impact on the team’s chances of conceding. Defenders can receive negative values for fouls conceded, for example, or a failed tackle that leads to them being dribbled past. Another benefit of this approach is that the model will assign greater credit for successful defensive actions performed in more dangerous areas of the pitch.
Finally, handling the ball under pressure and playing through the press are key attributes for centre backs in the modern game. Adding Being Pressured Change In Pass % is an addition that made complete sense as a measure of a defender's ability in this way, identifying those defenders whose average pass completion rate sustains or drops off when they come under pressure.
Aerially dominant defenders will pop at the top of the radar. Those that excel in defending their penalty box and in ground duels should pop towards the left-hand side. Those that are capable on the ball should pop towards the right.
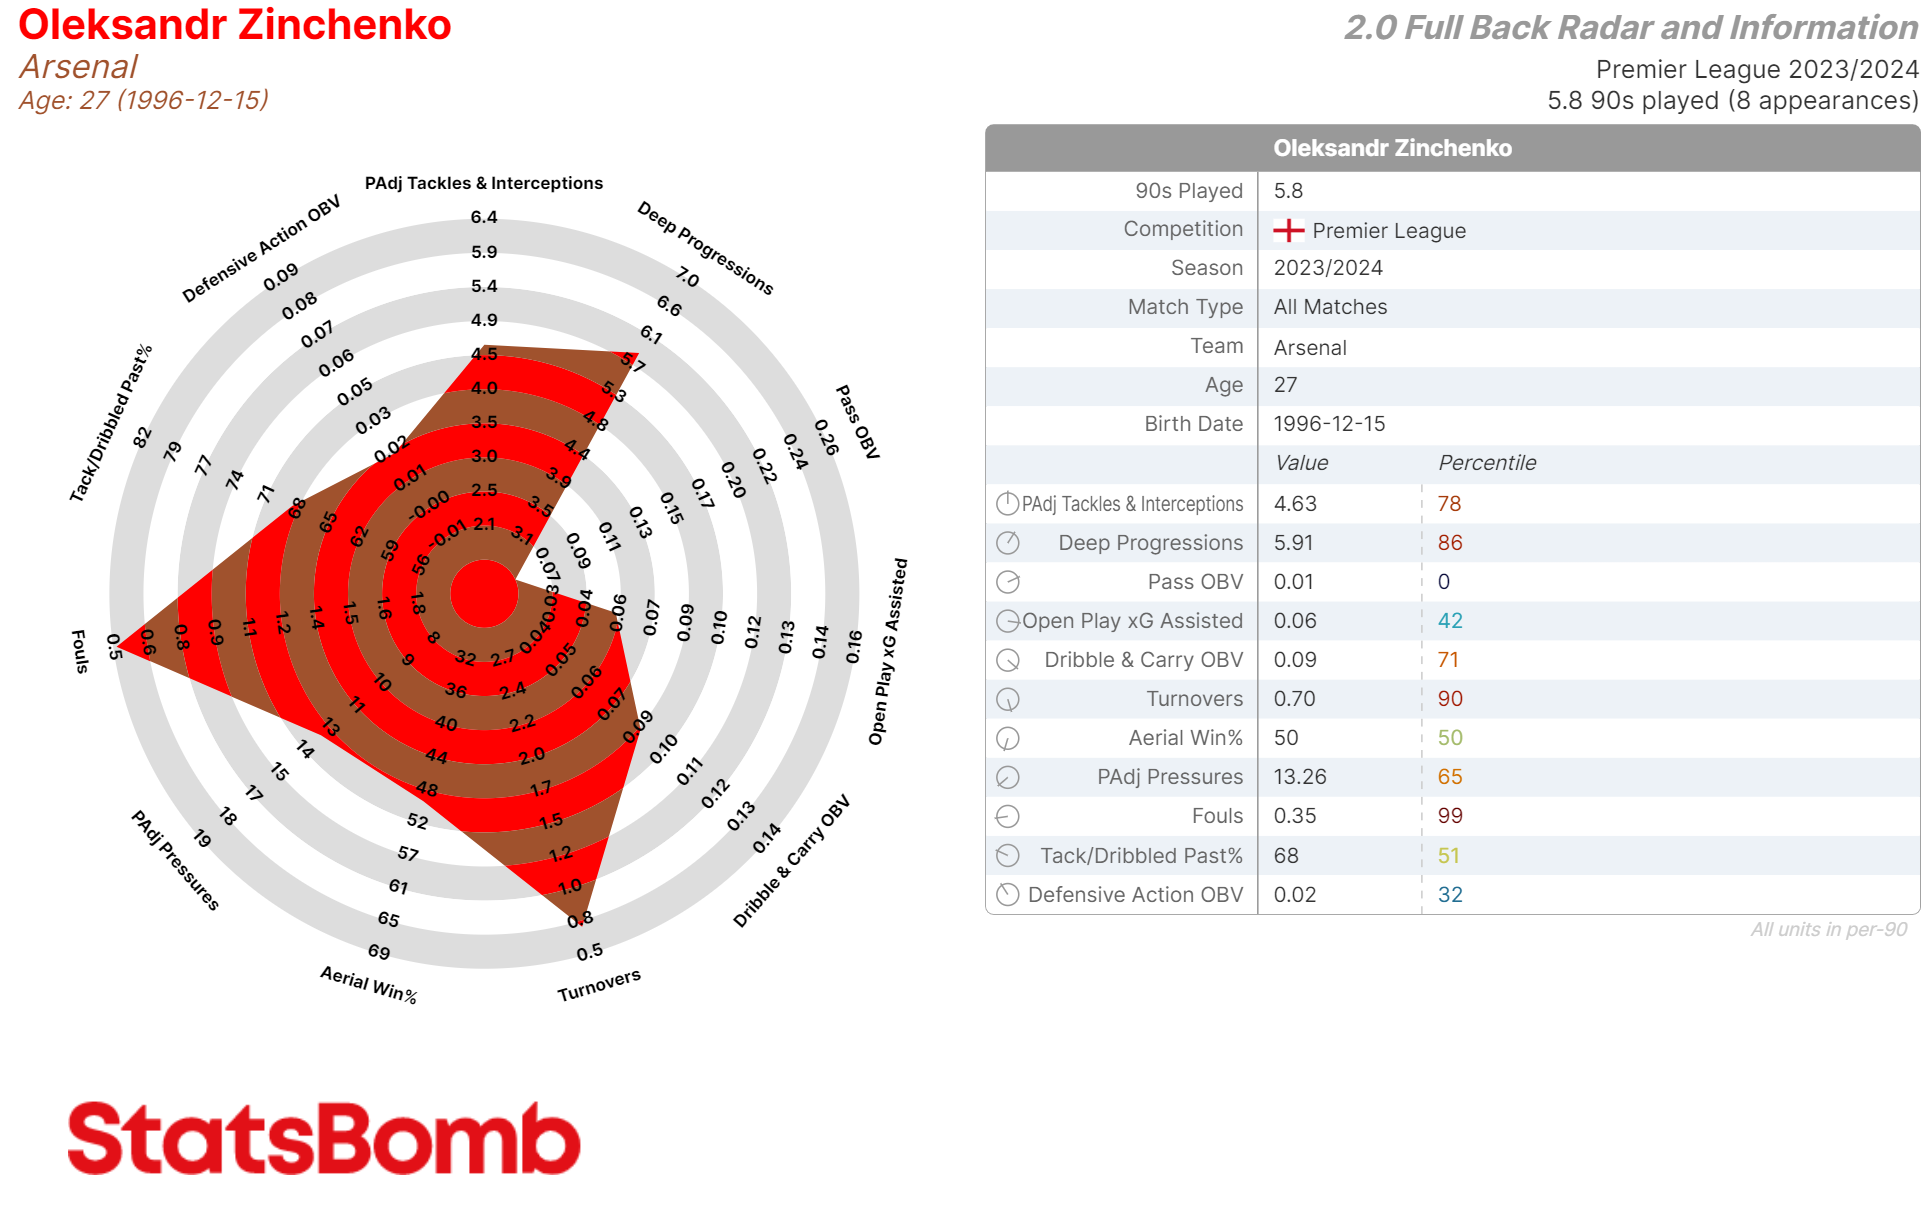
Full Backs
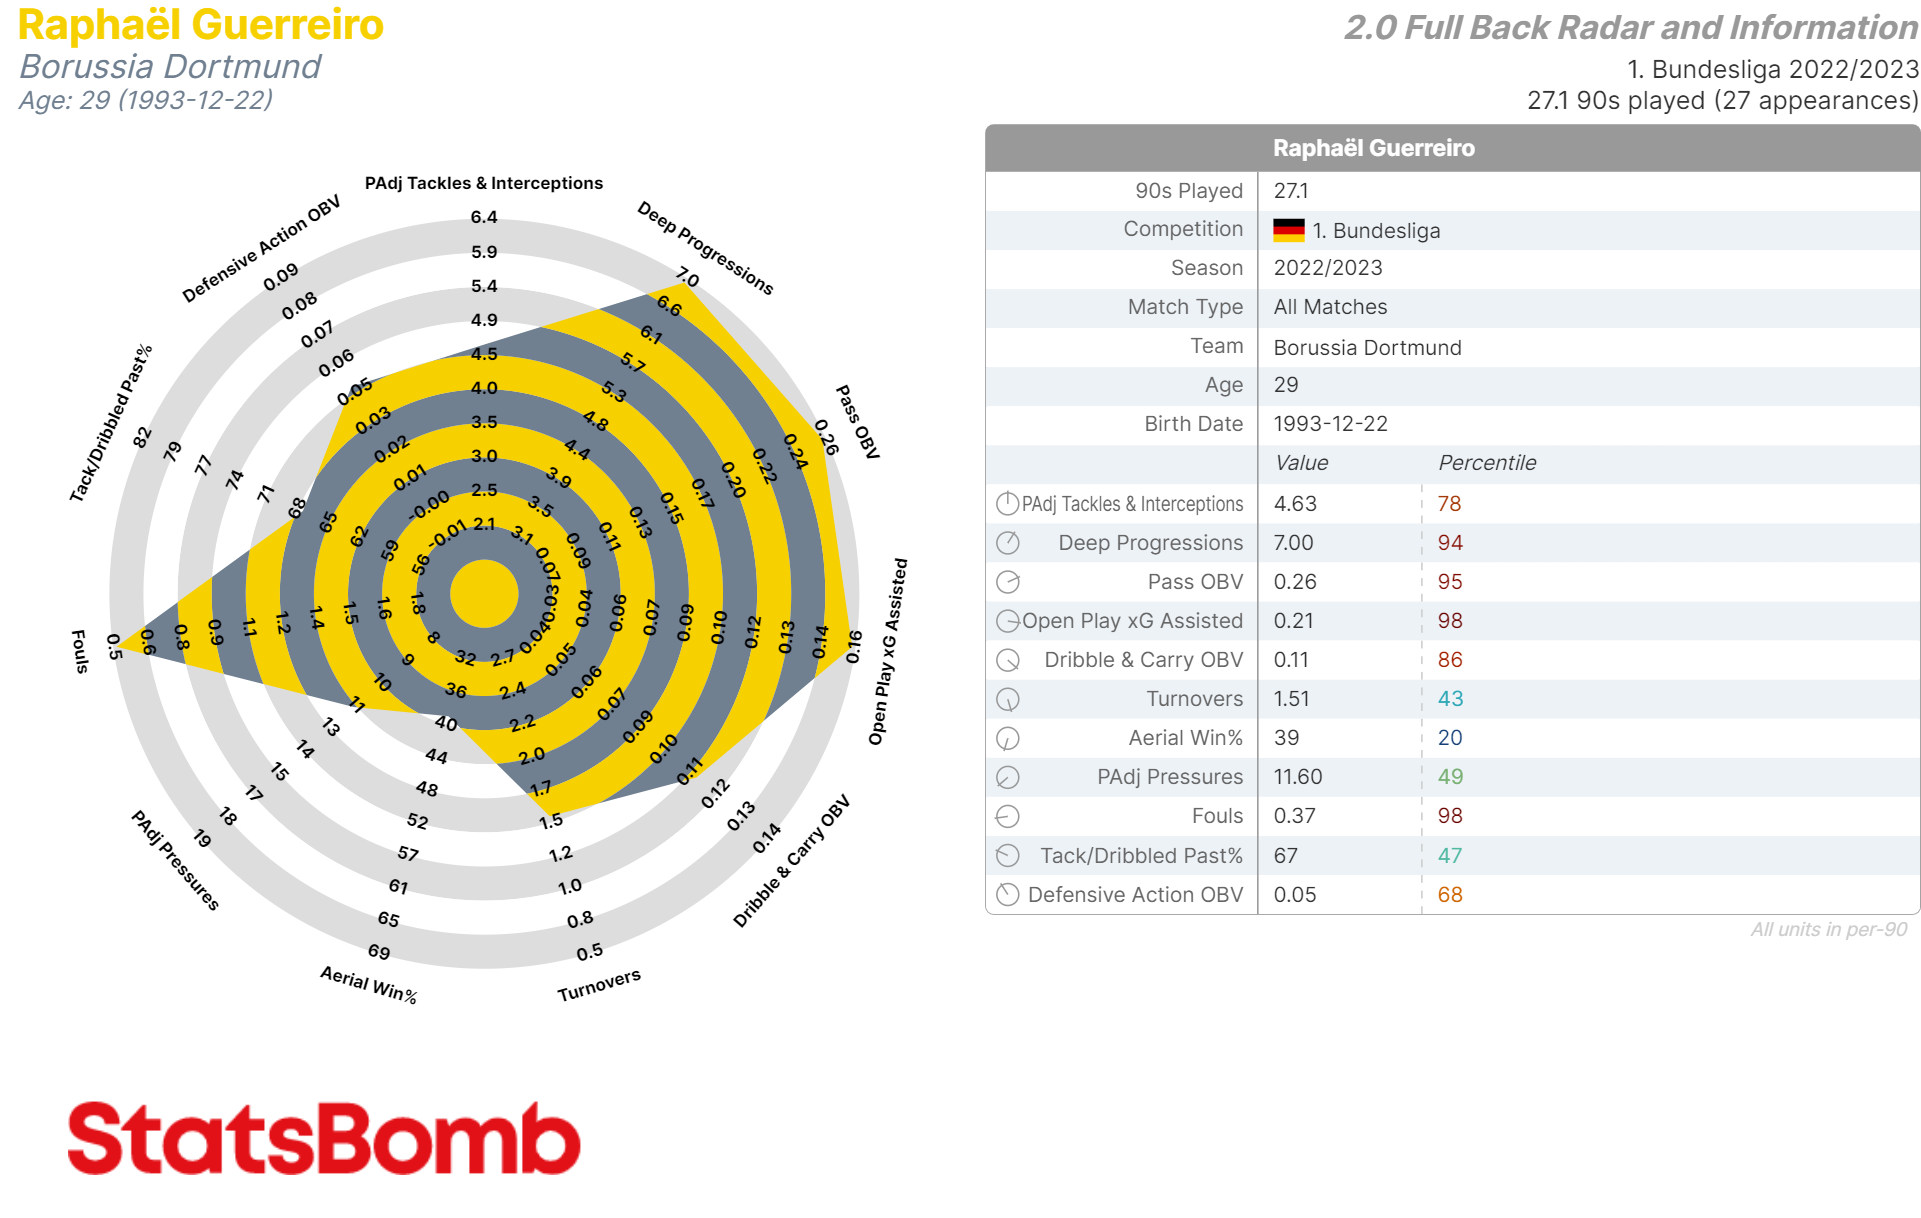
Another fairly sizeable overhaul. We felt it was time to add more information around ball progression and chance creation – most teams have at least one full back or wing back they look to have regularly involved in at least one of those disciplines, so it became clear we needed to include some measures on the template. In come Pass OBV and Open Play xG Assisted.
You should notice that defensively disciplined full backs will pop to the left, whereas attacking wing backs involved in ball progression or final third play will pop to the right.
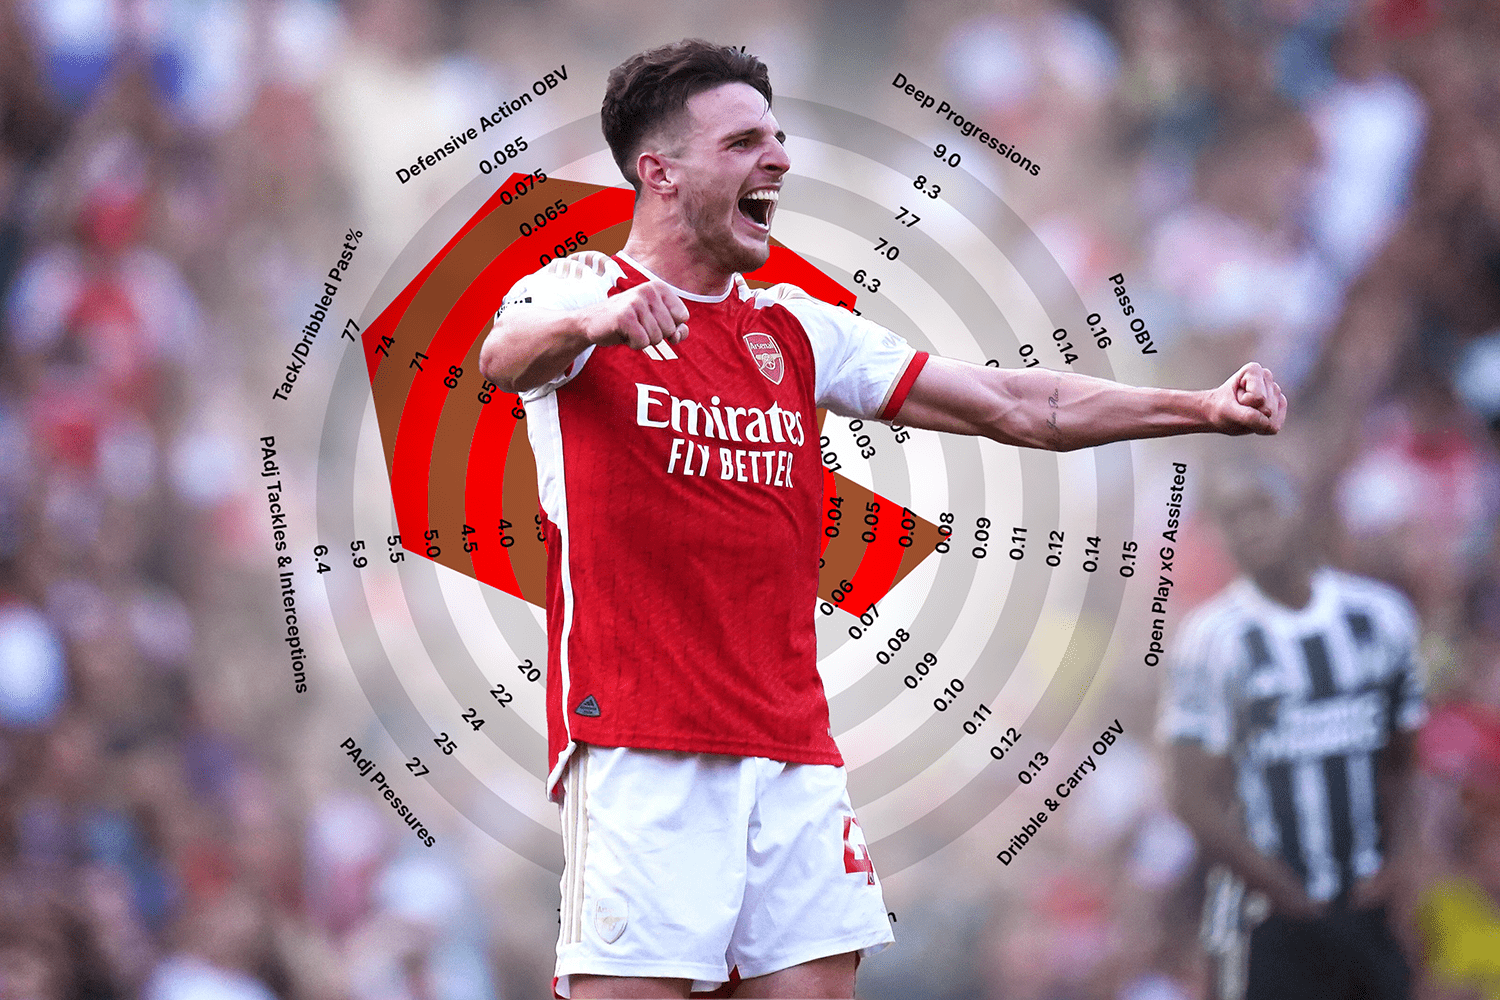
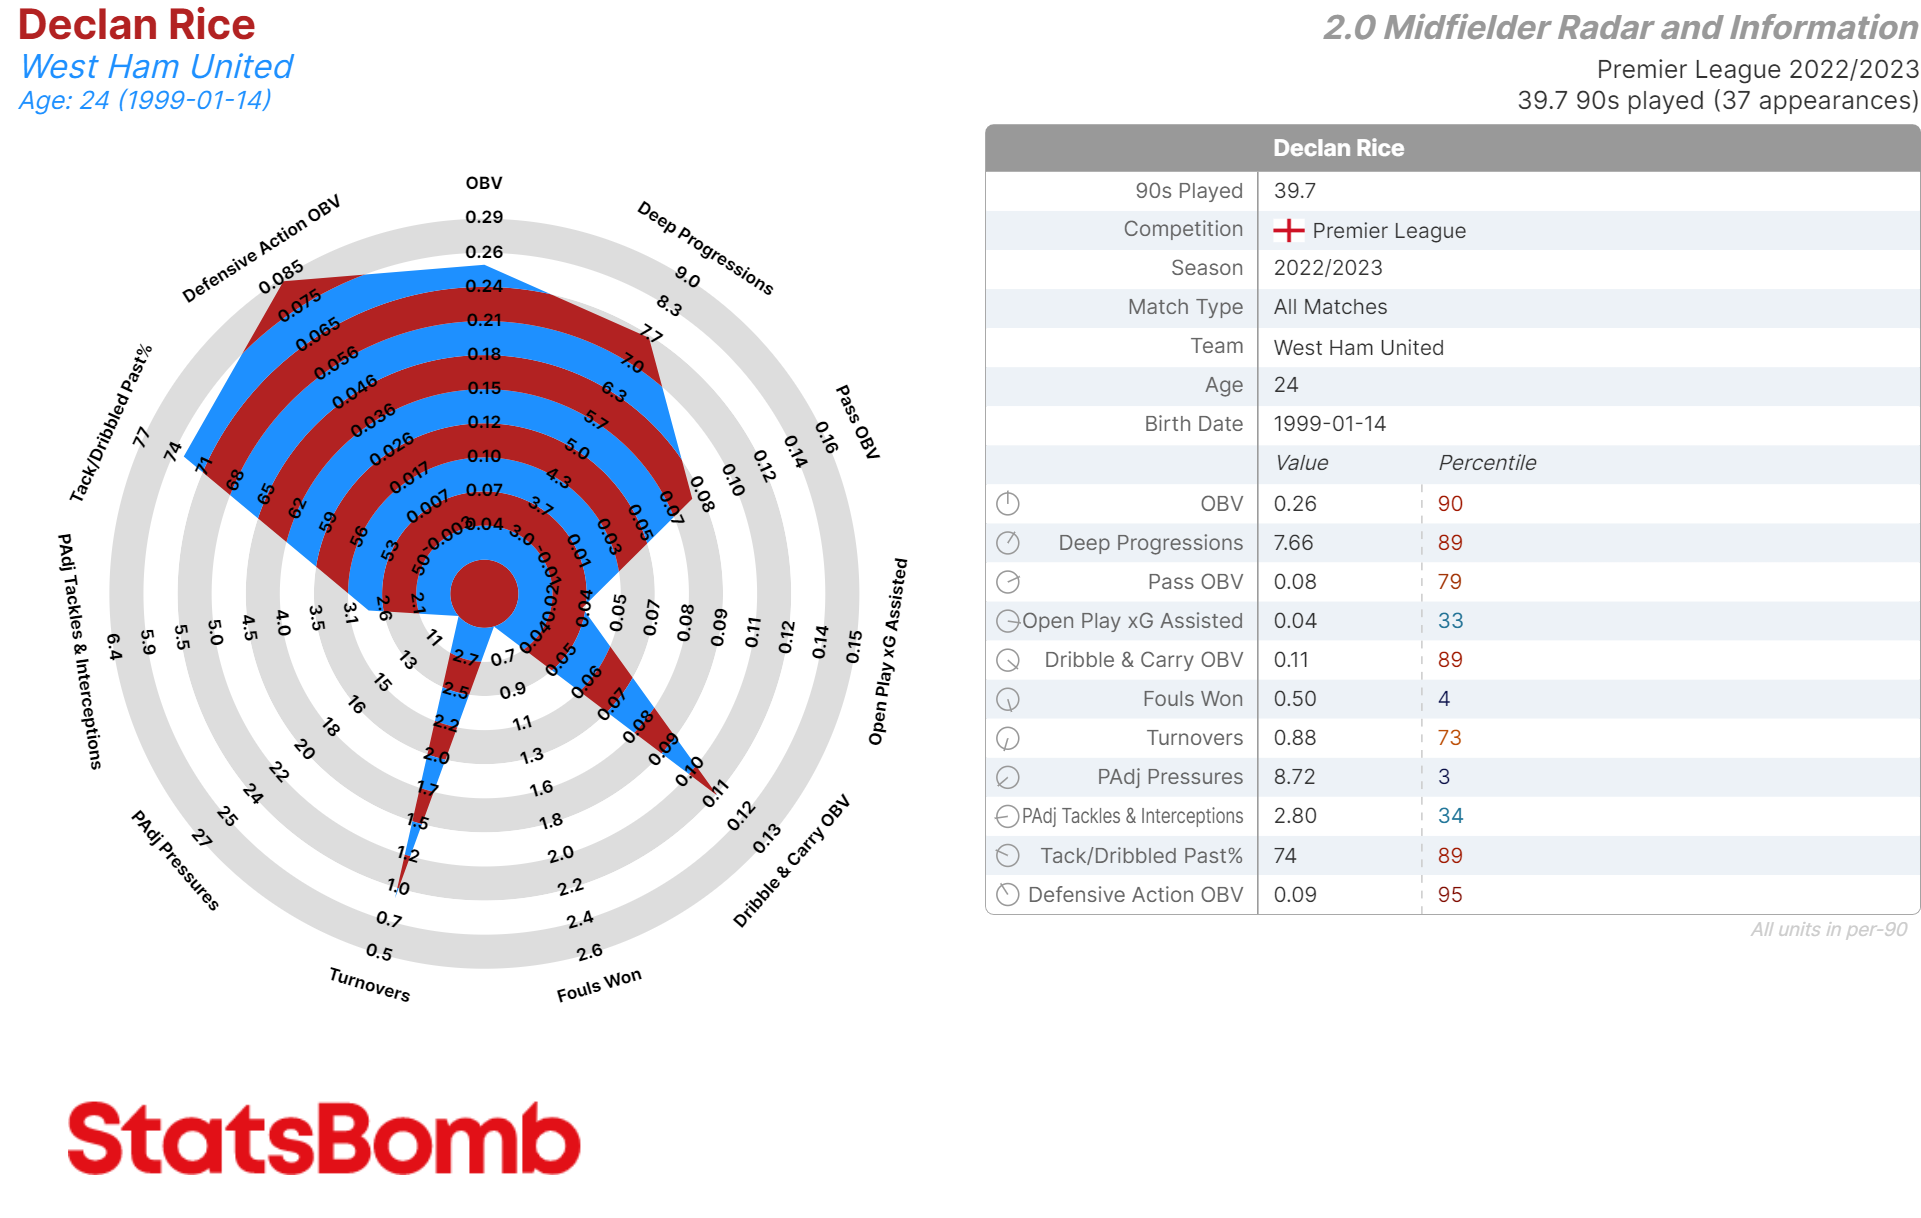
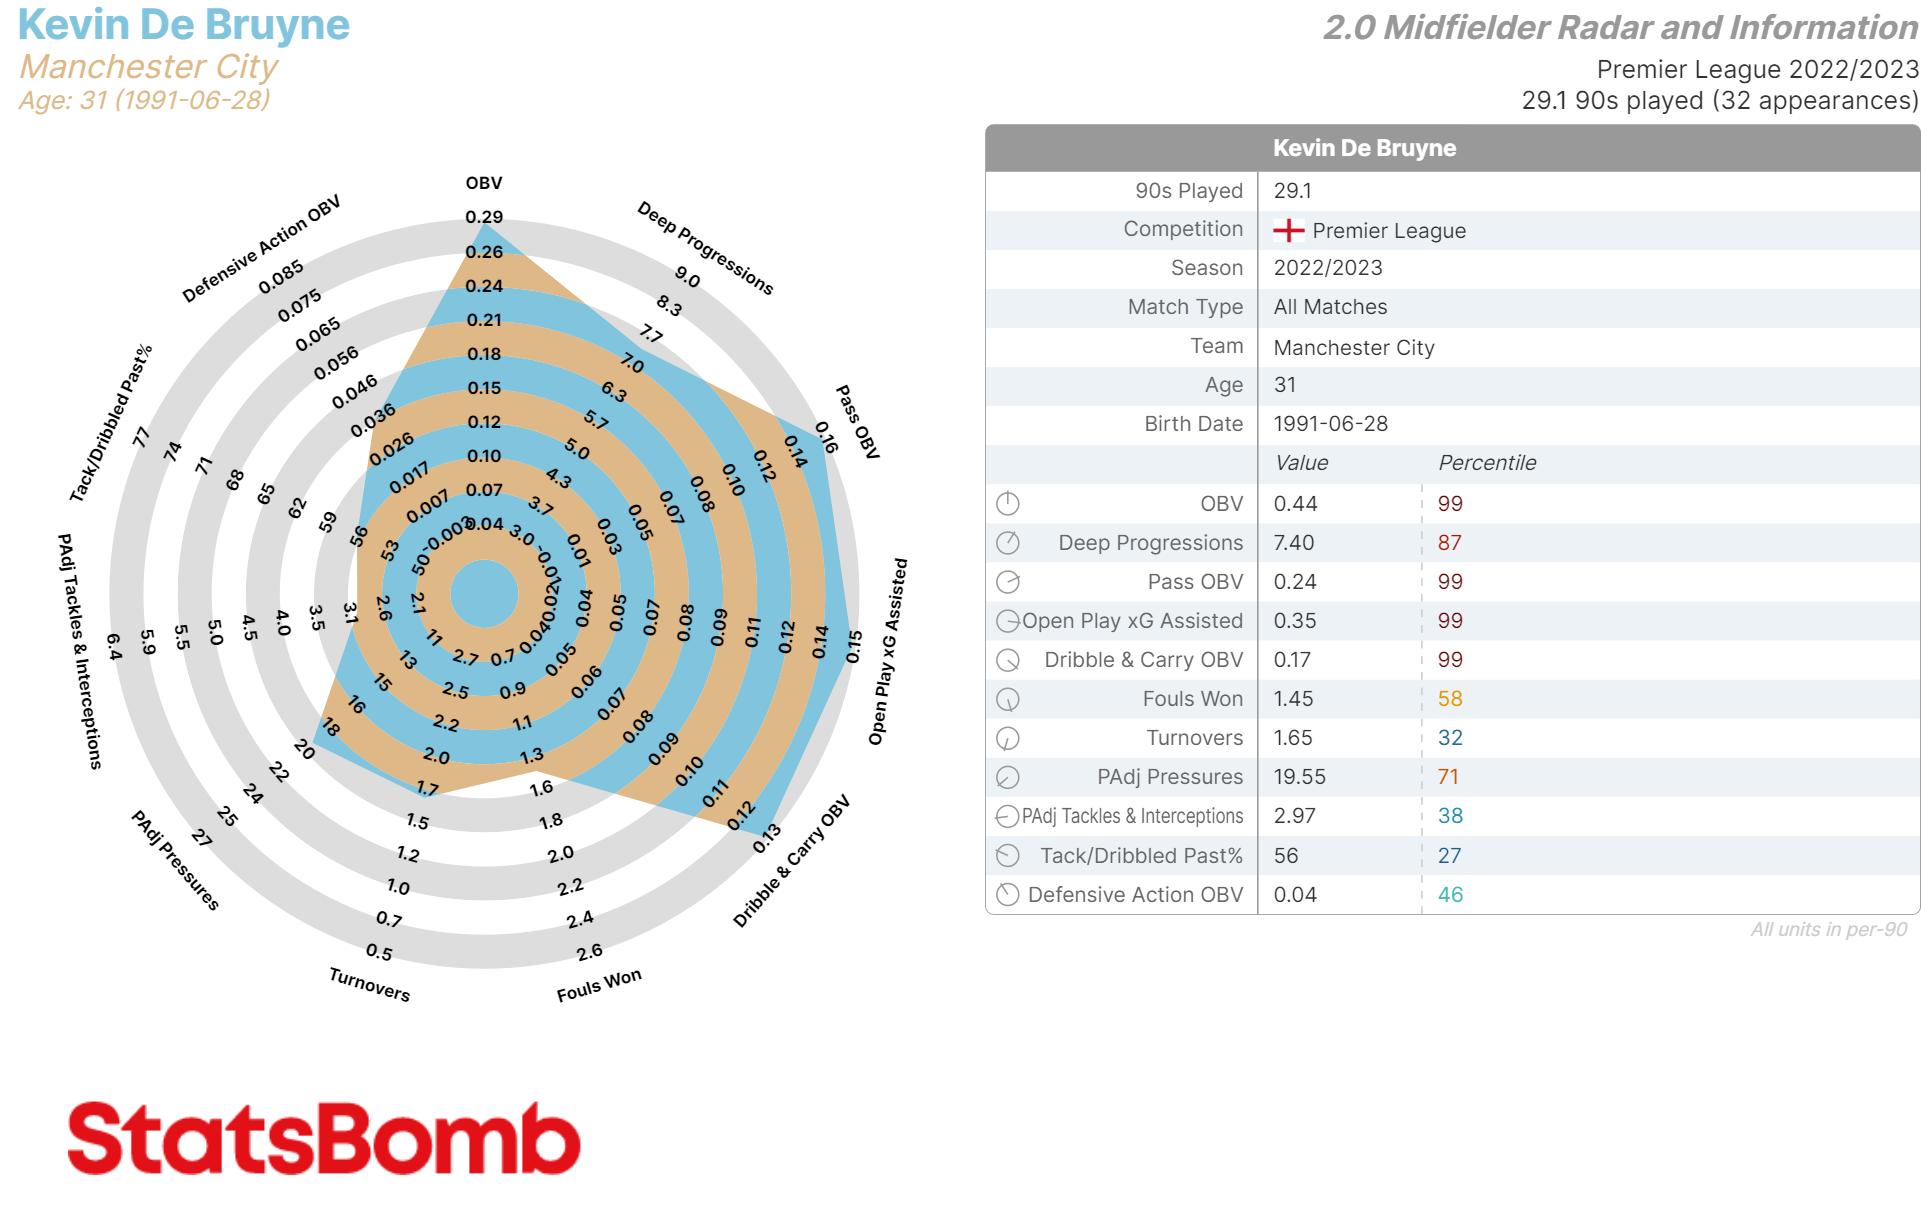
Midfielders
Passing % has gone?
*crowd cheers*
Forever?
*louder cheers*
We admit this probably took us longer than it should have.
Tackles and interceptions had separate spokes on the old template, but we’ve combined them on this one to make room to add in both Defensive Action OBV and Tackle/Dribbled Past %. This way, we have a more value-added/skill-based measure of a midfielder's defensive contributions. This highlights players like Declan Rice, who aren’t necessarily high-volume defenders but whose quality of defensive actions is high.
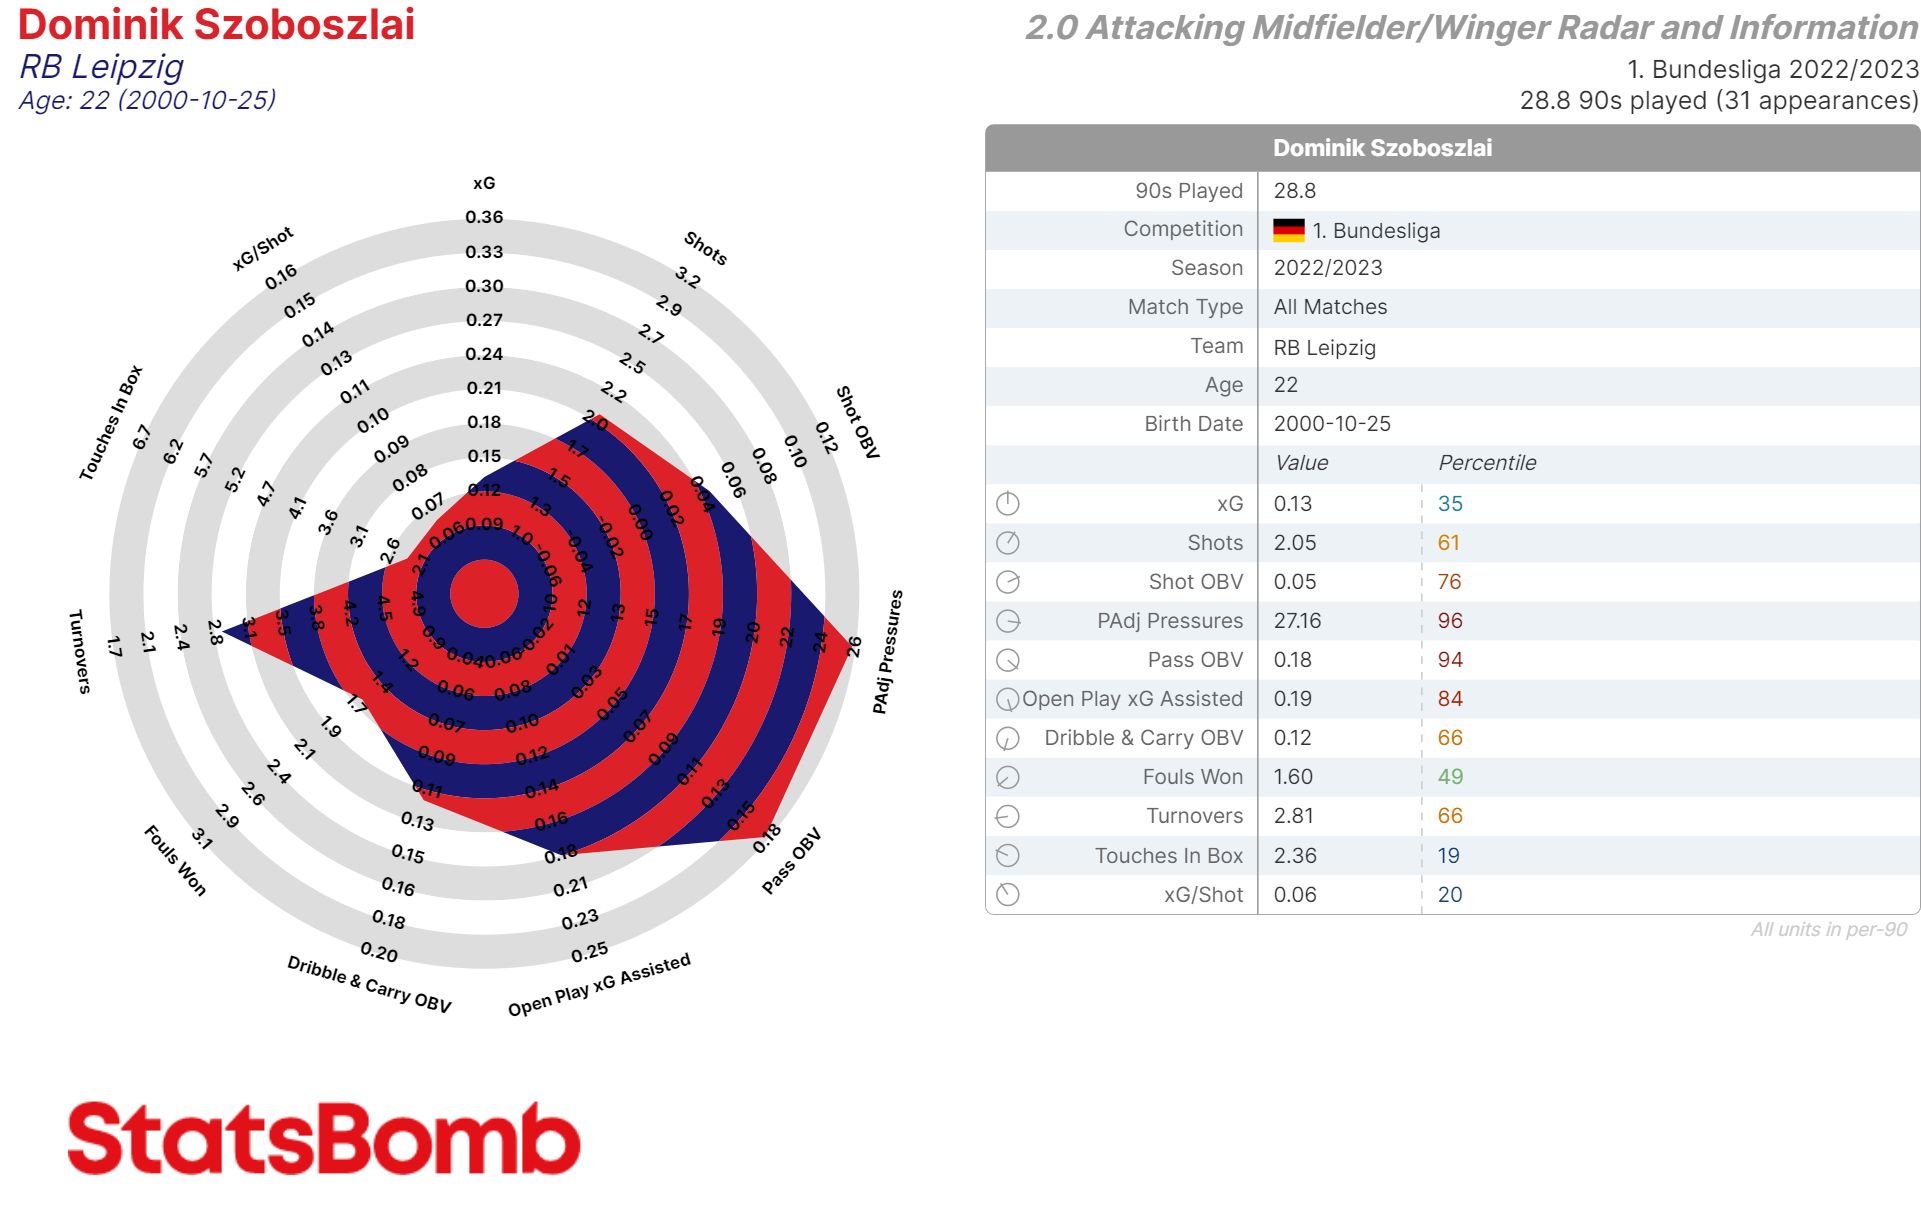
Attacking Midfielders & Wingers
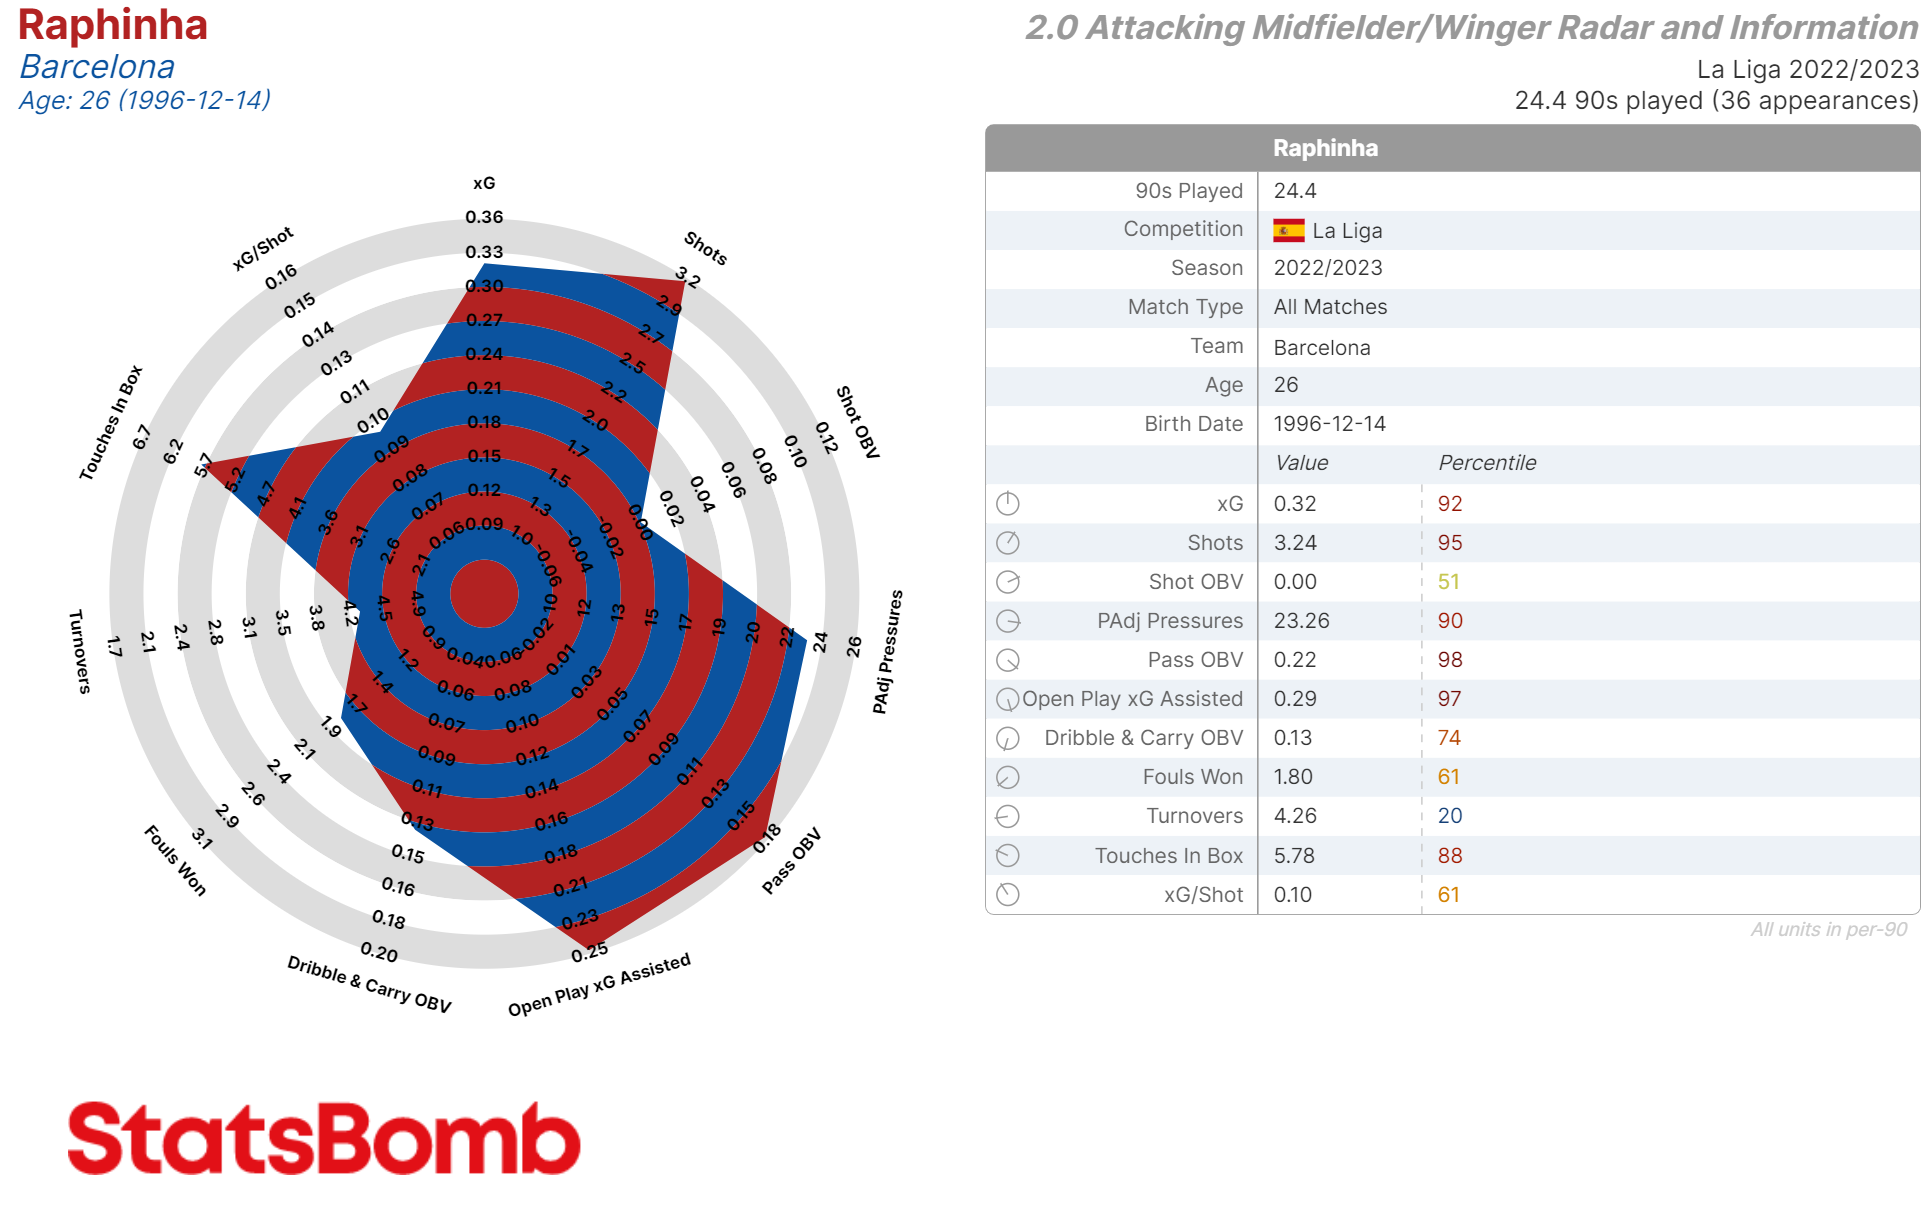
The most significant change here is the dropping of Successful Box Cross %, a stylistic metric that measured the percentage of a player's passes into the box that came from crosses – essentially to identify wingers that go wide versus cutting inside to play passes.
This was a tricky decision, but in its place is Shot OBV, which we feel is a strong upgrade in the quality of information provided. We’ll explain the metric in detail in the following template.
The basic read of the Attacking Midfielder/Winger template: goalscoring wide forwards will light up the top of the radar, creators and dribblers the bottom.
Strikers
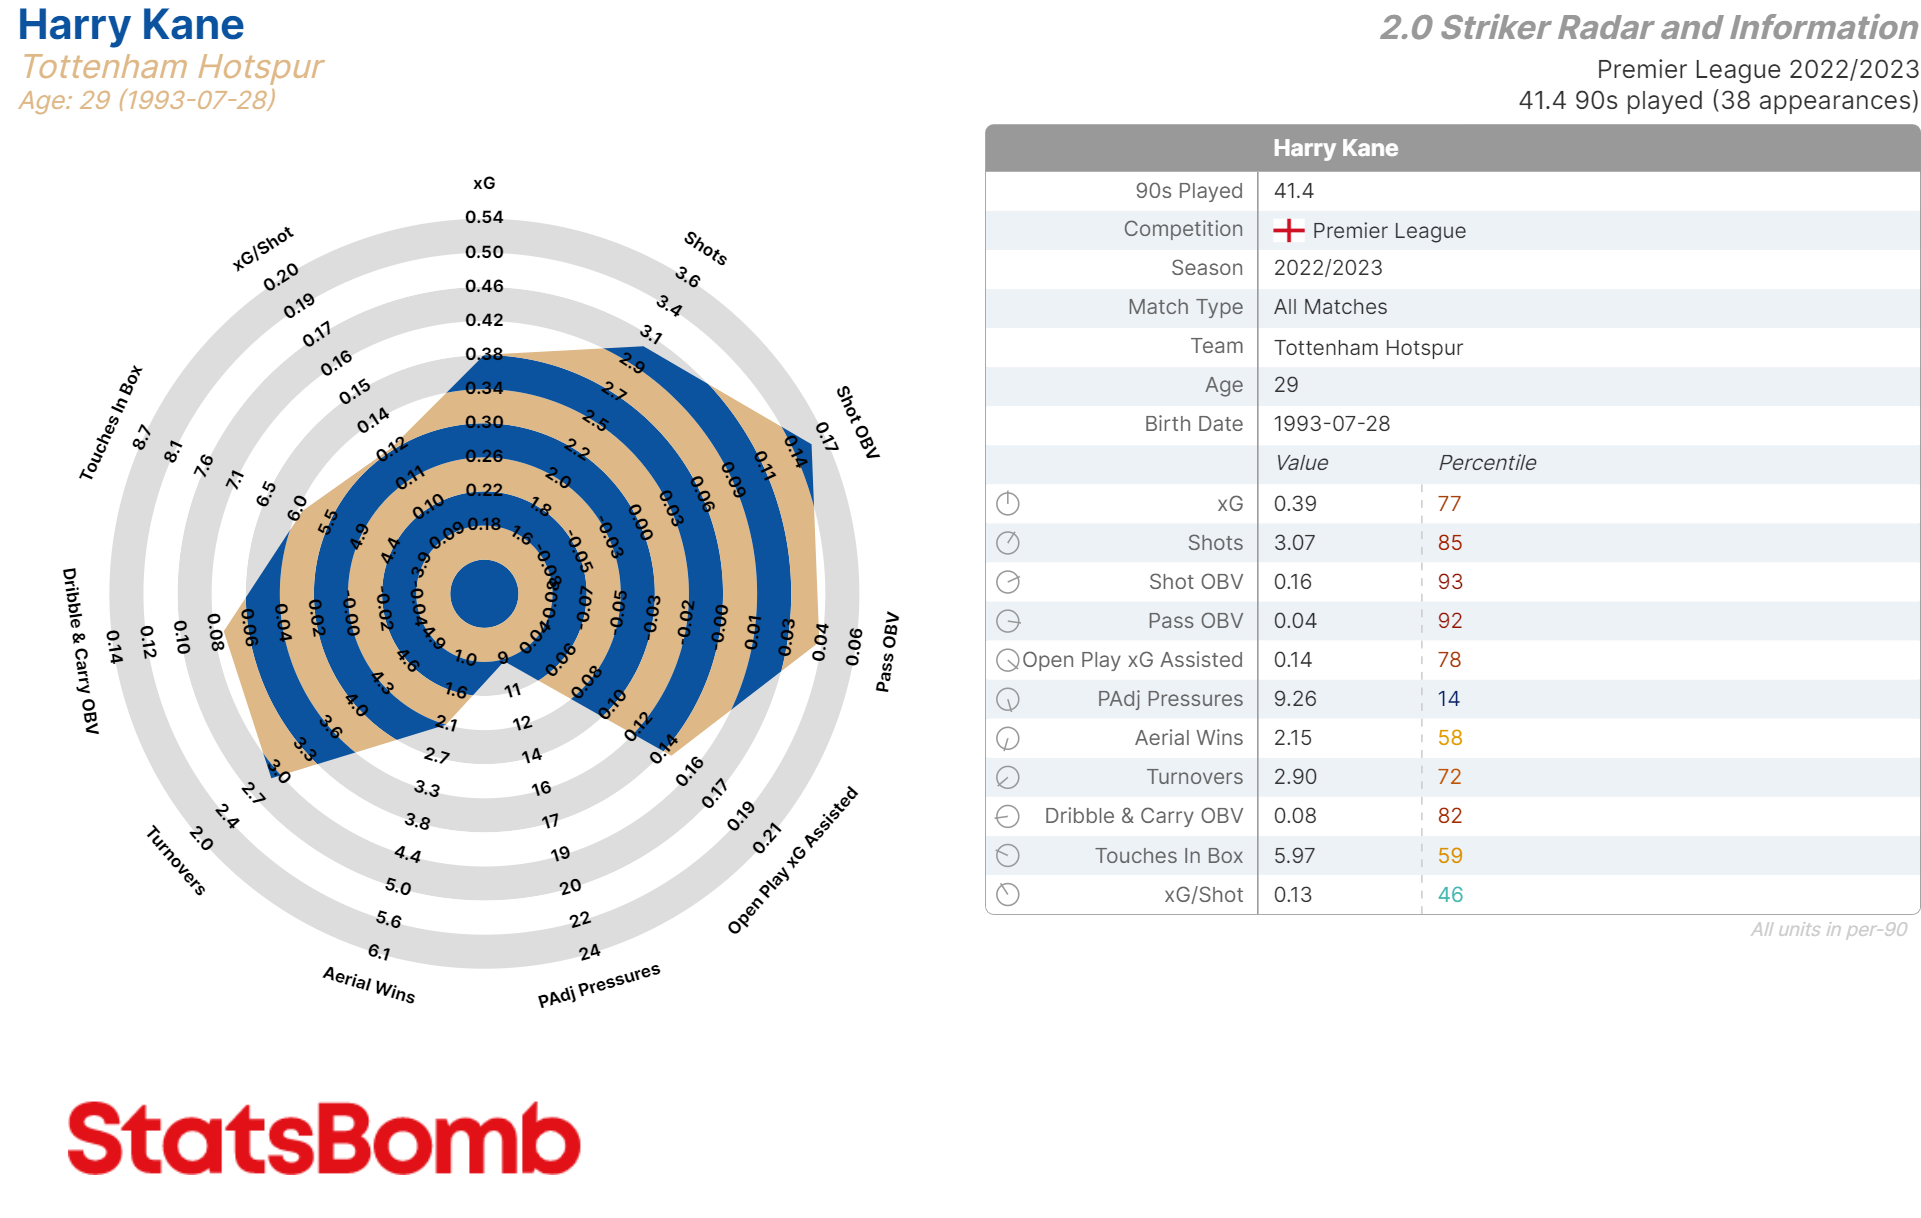
Let’s talk Shot OBV.
Shot OBV contains both decision-making information and shot execution information on a player.
The decision-making aspect comes from whether the player has added value by taking the shot at that particular moment in the possession.
Imagine Mohamed Salah cutting in from the right, beating a defender and taking a clear shot on goal from the right side of the penalty box. The xG value of the shot is 0.30 – or an expected 30% conversion rate – but the OBV model estimates that, on average, we’d expect a team with the ball in that position to score 25% of the time in that possession. Therefore, Salah is credited with +0.05 OBV due to realising he’s in an advantageous position and picking a good moment to take a shot on.
The shot execution information comes from what happens after the shot.
We know Salah’s chance has an xG value of 0.30. But what about the quality of the shot? He hits the ball hard and precisely inside the far post, reasonably close to the top corner. Our post-shot xG model factors in the location the shot is taken from and the velocity and placement of the shot. It gives the shot a post-shot xG value of 0.50. Salah is then credited with +0.20 OBV because he has increased the likelihood of the goal being scored from 0.30 xG to 0.50 post-shot xG.
Add this up over every shot a forward takes and you get a lot of information on their finishing and decision-making ability. It’s a brilliant development by our data science team, led by Dinesh Vatvani, and we’re delighted that it’s available to customers to evaluate players at all levels of the game.
The Future
The new and improved radars are available now to customers via our Analysis Platform. But we’ll continue to innovate and produce new and better information to evaluate players, and we'll continue to improve the radars – likely as soon as next season. We’ll talk about that more in good time.
Look out for an avalanche of radars and request lines next week as the 2023/24 leagues start to hit a sizeable sample of games to start drawing early conclusions from.
And as always, get in touch if you feel our products or services can help your team or organisation achieve your goals. Or, if you want to improve your understanding of football analytics, our range of courses are always available.
Thanks for listening.
Metric Definitions
Goalkeepers
- Goalkeeper OBV: On Ball Value Added (net) from goalkeeping actions
- Long Ball %: Percentage of attempted long balls that are actually completed
- Pass Into Danger %: Percentage of passes made where the recipient was deemed to be under pressure or was next engaged with a defensive action
- Claims - Crosses Claimed Above Average (CCAA) %: A measure of how likely the goalkeeper is to attempt to claim a "claimable" pass, versus the average goalkeeper attempted claim rate
- Goalkeeper Aggressive Distance: An average value of how far from the goal the goalkeeper is coming forward to perform defensive actions
- Positioning Error: How far from the optimal position for facing a shot the Goalkeeper is (on average)
- Shot Stopping %: The measure of goals saved above average, as a percentage of shots faced by the goalkeeper
Centre Backs
- Aerial Win %: Percentage of aerial duels a player enters that they win
- Aerial Wins: Number of aerial duels a player wins
- OBV: On Ball Value Added (net) total (all event types)
- Pass OBV: On Ball Value Added (net) from Passes
- Being Pressured Change in Pass %: How does passing % change when under pressure? This is calculated as Pressured Pass % minus Pass %
- Dribble & Carry OBV: On Ball Value Added (net) from Dribbles and Carries
- Fouls: How many fouls a player commits
- PAdj Clearances: Number of clearances adjusted proportionally to the possession volume of a team
- Blocks/Shot: Blocks made per shot faced
- Tackle/Dribbled Past%: Percentage of time a player makes a tackle when going into a duel vs getting dribbled past
- Defensive Action OBV: On Ball Value Added (net) from Defensive Actions
Full Backs
- PAdj Tackles & Interceptions: Number of tackles and interceptions adjusted proportionally to the possession volume of a team
- Deep Progressions: Passes and dribbles/carries into the opposition final third
- Pass OBV: On Ball Value Added (net) from Passes
- Open Play xG Assisted: xG assisted from open play
- Dribble & Carry OBV: On Ball Value Added (net) from Dribbles and Carries
- Turnovers: How often a player loses the ball via a miscontrol or a failed dribble
- Aerial Win %: Percentage of aerial duels a player enters that they win
- PAdj Pressures: Number of pressures adjusted proportionally to the possession volume of a team
- Fouls: How many fouls a player commits
- Tackle/Dribbled Past %: Percentage of time a player makes a tackle when going into a duel vs getting dribbled past
- Defensive Action OBV: On Ball Value Added (net) from Defensive Actions
Midfielders
- OBV: On Ball Value Added (net) total (all event types)
- Deep Progressions: Passes and dribbles/carries into the opposition final third
- Pass OBV: On Ball Value Added (net) from Passes
- Open Play xG Assisted: xG assisted from open play
- Dribble & Carry OBV: On Ball Value Added (net) from Dribbles and Carries
- Fouls Won: How many times a player is fouled
- Turnovers: How often a player loses the ball via a miscontrol or a failed dribble
- PAdj Pressures: Number of pressures adjusted proportionally to the possession volume of a team
- PAdj Tackles & Interceptions: Number of tackles and interceptions adjusted proportionally to the possession volume of a team
- Tackle/Dribbled Past %: Percentage of time a player makes a tackle when going into a duel vs getting dribbled past
- Defensive Action OBV: On Ball Value Added (net) from Defensive Actions
Attacking Midfielders/Wingers
- xG: Non-penalty expected goals produced by the player
- Shots: Number of non-penalty shots a player takes
- Shot OBV: On Ball Value Added (net) from Shots
- PAdj Pressures: Number of pressures adjusted proportionally to the possession volume of a team
- Pass OBV: On Ball Value Added (net) from Passes
- Open Play xG Assisted: xG assisted from open play
- Dribble & Carry OBV: On Ball Value Added (net) from Dribbles and Carries
- Fouls Won: How many times a player is fouled
- Turnovers: How often a player loses the ball via a miscontrol or a failed dribble
- Touches In Box: Successful footed touches inside the box (including shots)
- xG/Shot: The average non-penalty expected goal value per shot a player takes
Strikers
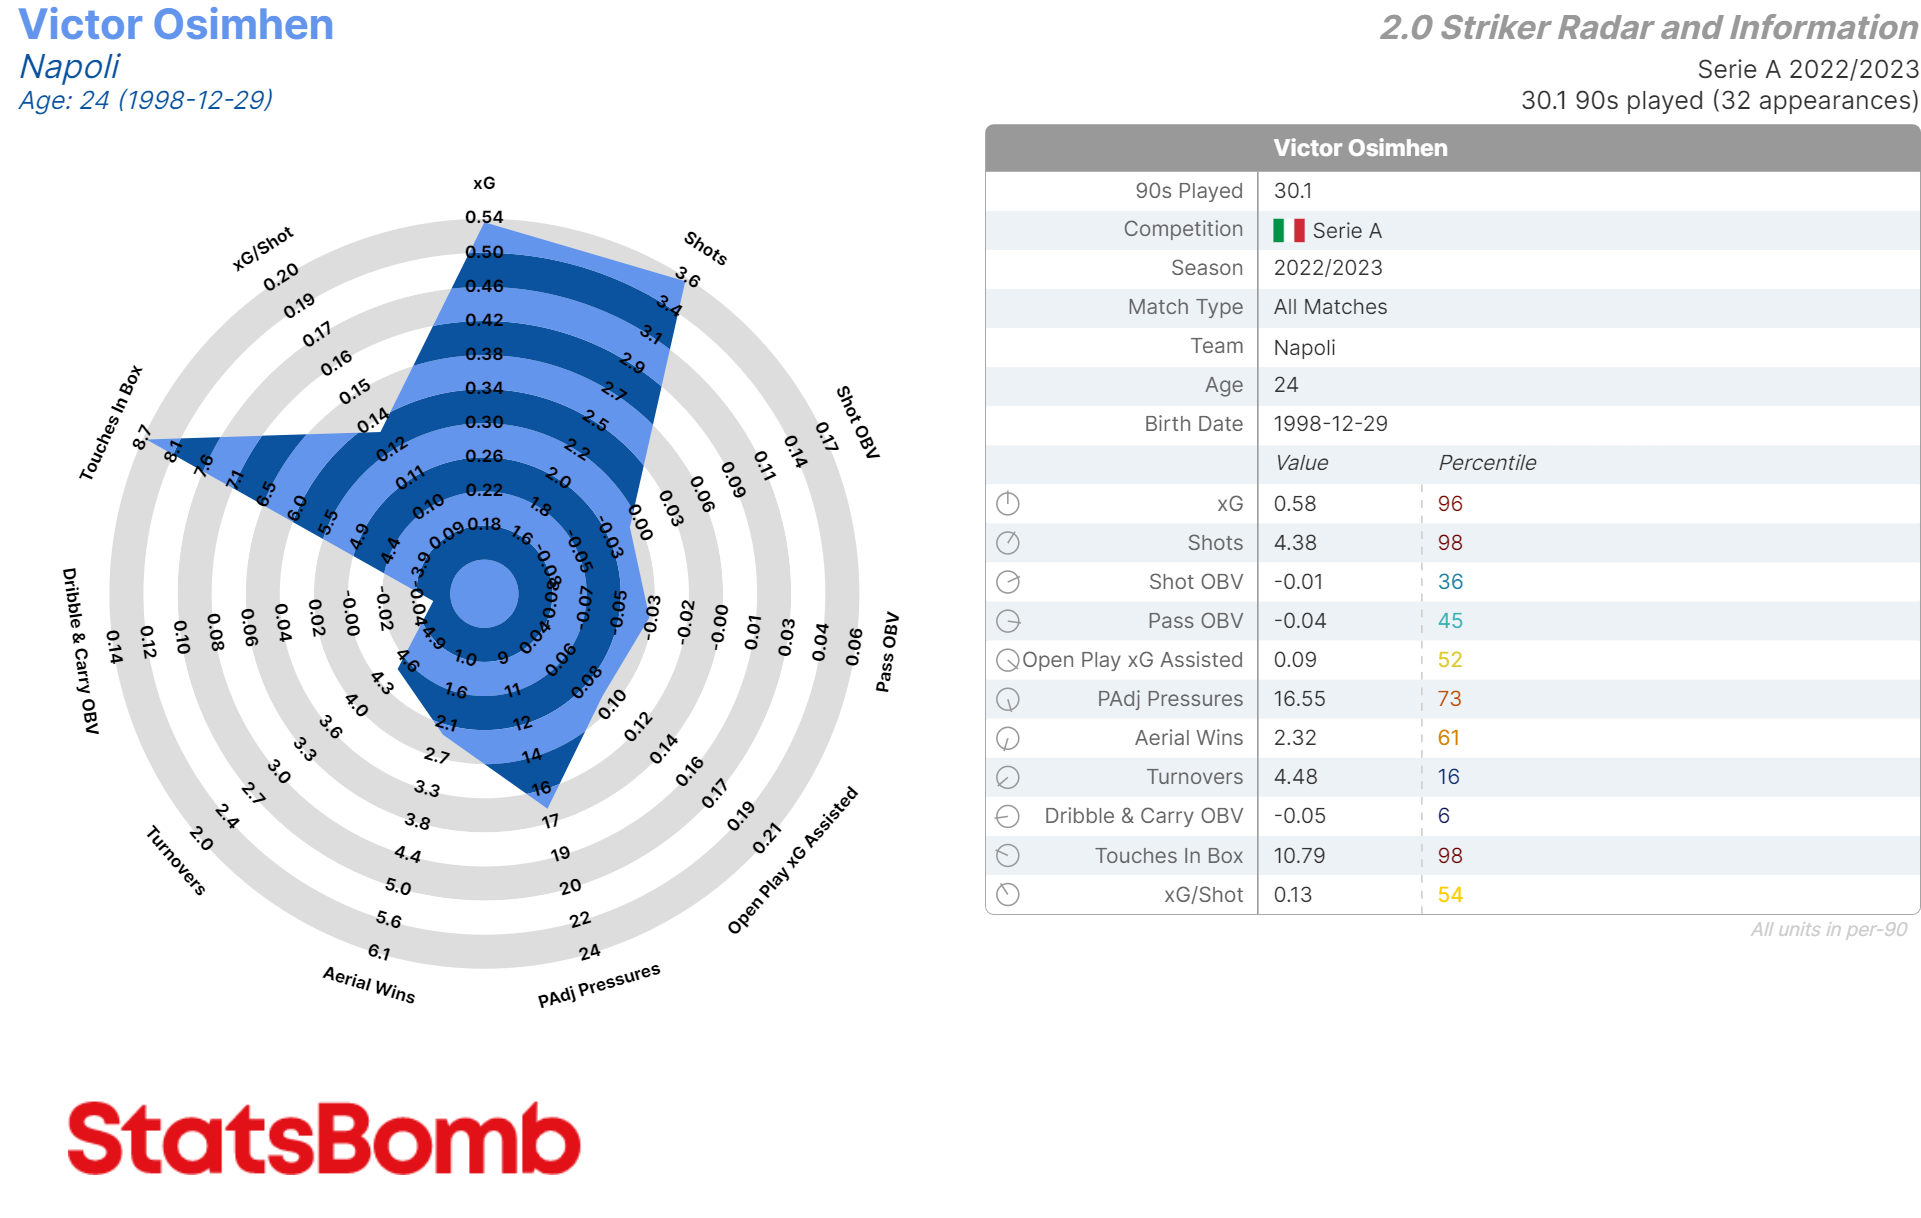
- xG: Non-penalty expected goals produced by the player
- Shots: Number of non-penalty shots a player takes
- Shot OBV: On Ball Value Added (net) from Shots
- Pass OBV: On Ball Value Added (net) from Passes
- Open Play xG Assisted: xG assisted from open play
- PAdj Pressures: Number of pressures adjusted proportionally to the possession volume of a team
- Aerial Wins: Number of aerial duels a player wins
- Turnovers: How often a player loses the ball via a miscontrol or a failed dribble
- Dribble & Carry OBV: On Ball Value Added (net) from Dribbles and Carries
- Touches In Box: Successful footed touches inside the box (including shots)
- xG/Shot: The average non-penalty expected goal value per shot a player takes
