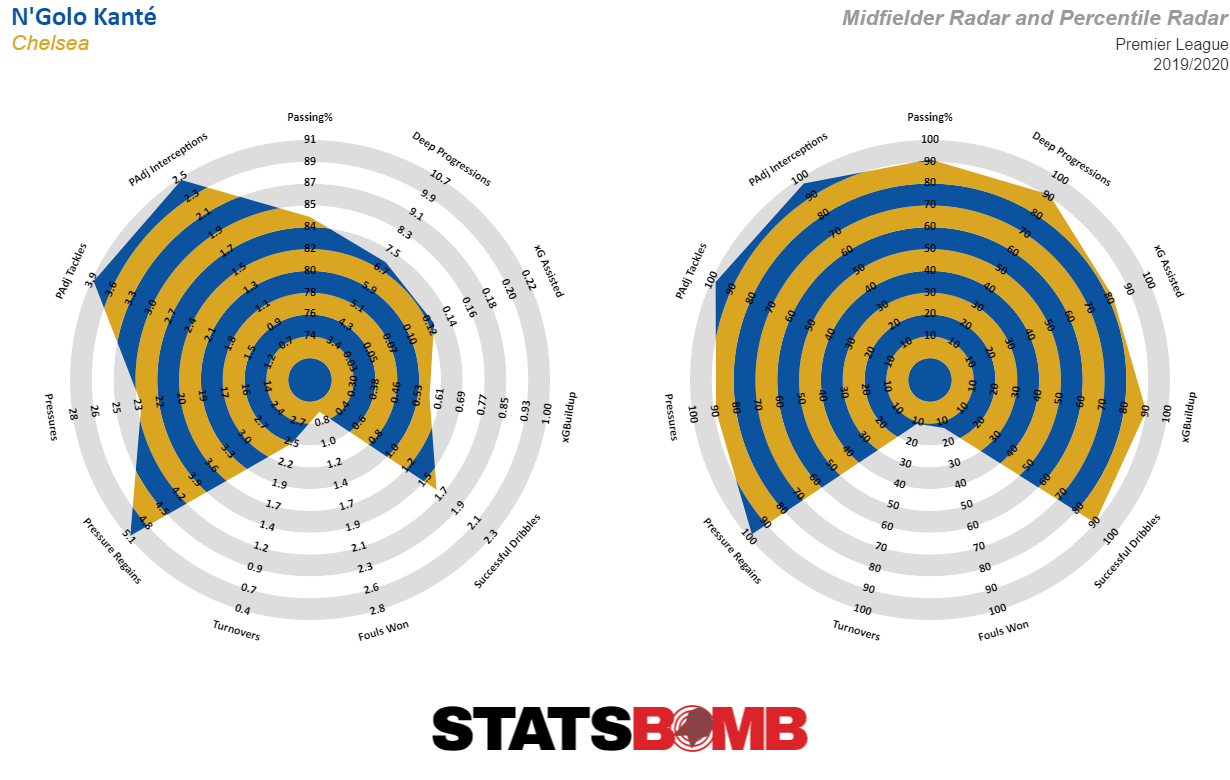
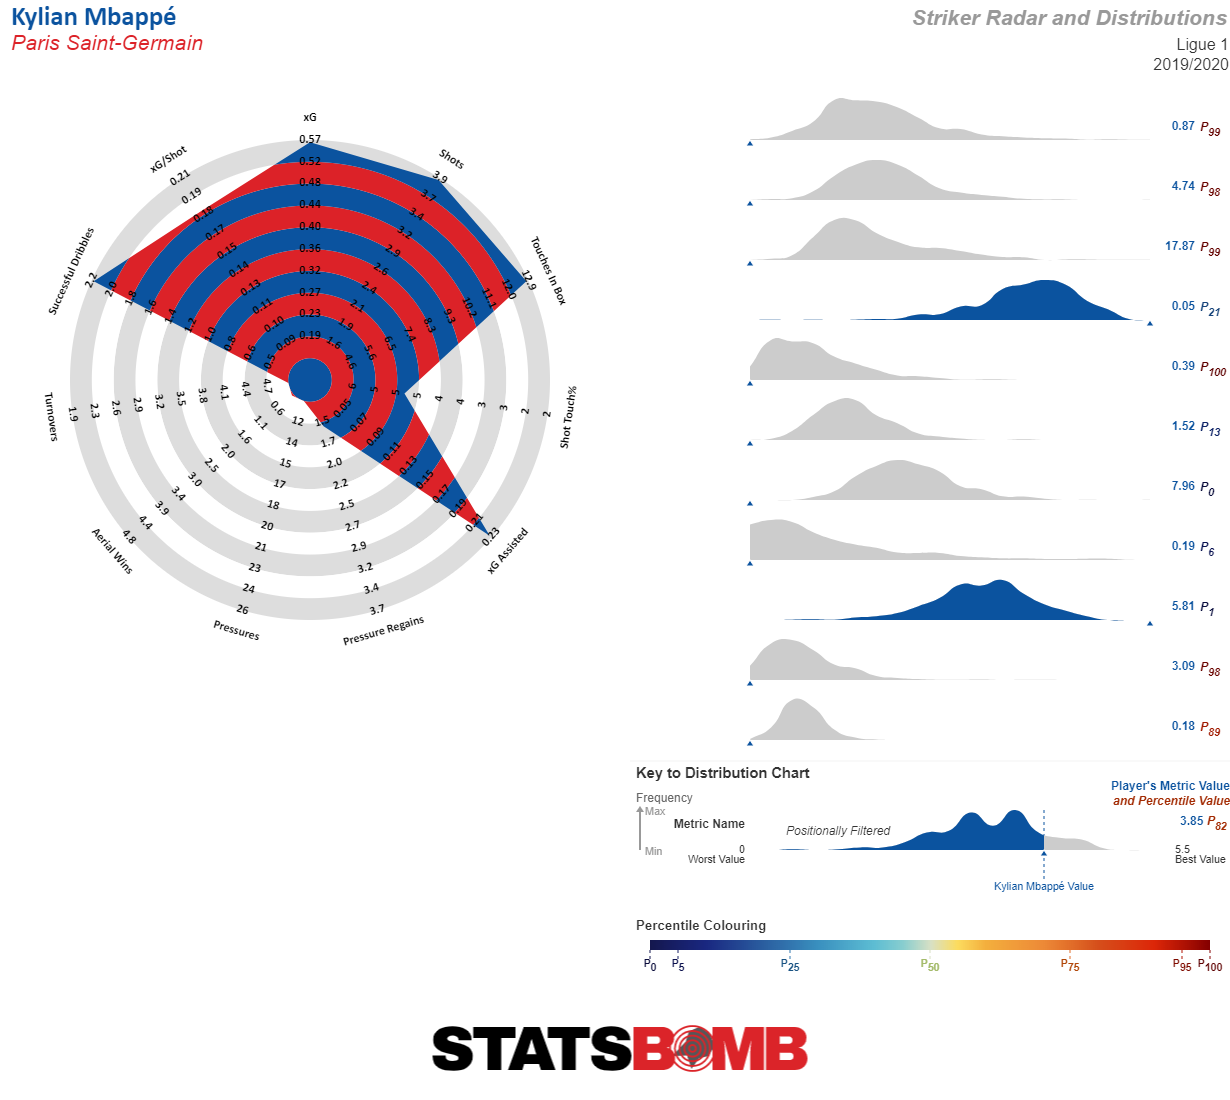
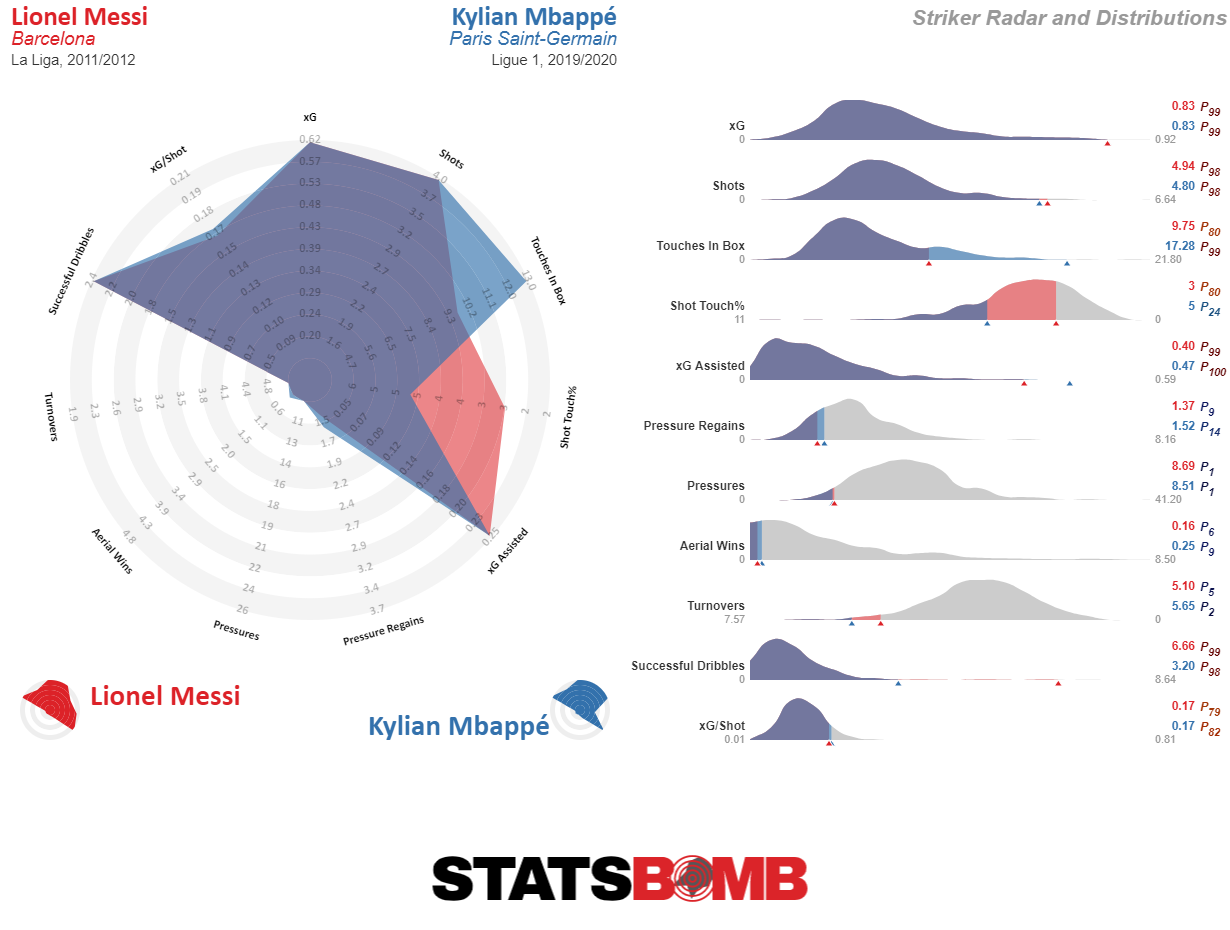
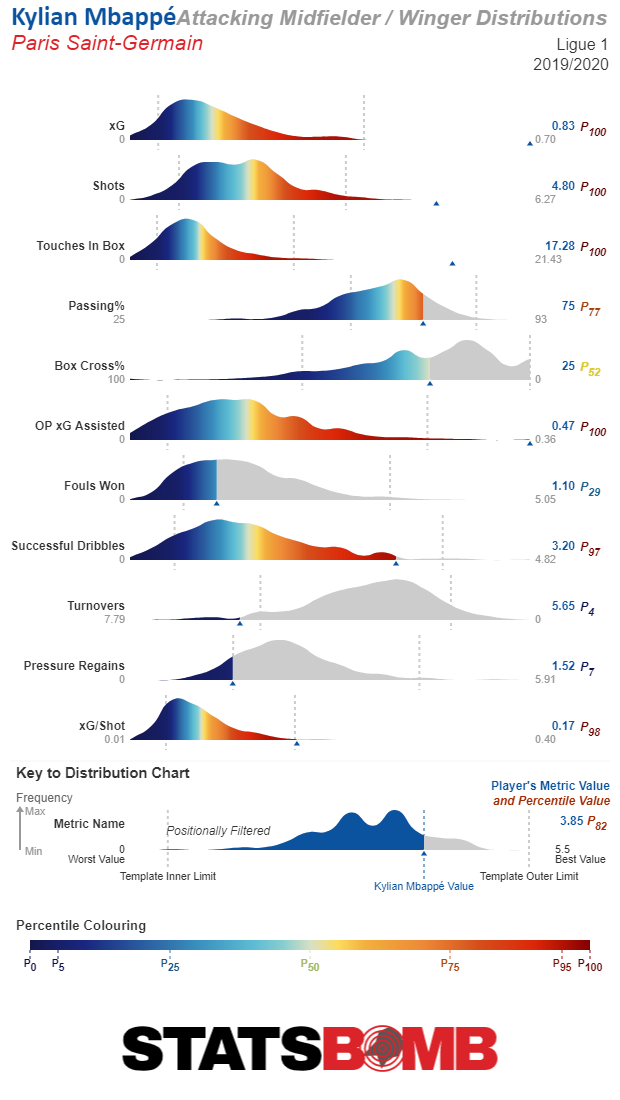
At StatsBomb, radars are our iconic way of visualising player and team stats. There has been a ton of development and research put into them since 2014, and if you are interested, you can read about various updates here and here.These days they are seemingly ubiquitous in the football landscape.
However, we know that radars are not the only way to visualise data. Radars are actually quite good at serving their purpose, but StatsBomb IQ is mature enough to deliver other options. Today’s StatsBomb IQ updates did the following:
1. Update radar position specific stat boundaries with new data from the past year.
2. Add percentile radars as a visualisation option.
3. Update the information provided on radars into a new panel.
4. Add distributions as a visualisation with many different options for use cases. (Which I will explain in detail below.)
5. Comparisons happen in the radar screen now rather than saving to compare -> going somewhere else. We feel this offers a cleaner UI than what we had before.
6. Using distributions you can now explore team and player stats as percentiles in the league pages.
We wanted to release these updates to allow customers to become comfortable with the changes and new features before moving to the next step of the Customisation project. That step will allow customers to build their own templates for radars and distributions from scratch, which is probably the most requested new functionality we have had.
First things first though…
Template Boundaries Have Been Updated
We update these about once a year as more data comes into the system. They remain based on positional populations for each stat in the big 5 leagues across multiple seasons. However...
New Positional Population Distributions
One element we are working on is creating new population distributions to compare against. In our email to customers, we explained that they should read the detailed WARNING included on the website before making changes to the distribution settings.
And then, as if by magic, we proved exactly WHY you would want to be careful messing with the default settings ourselves by accidentally including all the historic La Liga data we collected for the Messi Data Biography in with the default population calculations.
The problem? Those league seasons only include games from Barcelona, where they are typically trouncing 19 other opponents, and nothing else. Barcelona and the 19 cream puffs then made their way into the team data set, where for some reason defensive stats went kind of crazy as 13 * 20 additional funhouse mirror La Liga seasons were included in the population. It was now weirdly normal for teams to concede 3 xG a match on the defensive side of the ball.
So uh… we’re fixing that bug ASAP.
And thanks Messi!
Percentile Radars
In addition to normal stat radars, you can now choose to show stats as percentiles for the position. This gets rid of the 5%/95% cutoffs from the normal templates and replaces calculated stats with percentiles for the entire population of output at that position. Depending on your use case, these may be strictly better ways to display player skill sets than the traditional value radars.

Information Display Updates
We have changed how we display information quite a bit with this update. The new table contains the basic statistical output per 90 as well as the percentile for that stat.

New Display Option: Distributions
I have wanted to add non-radar, sciency ways to display player and team data for a long time. We researched (actually, I say we, but Nat James did most of the work on this) and tested a variety of potential options and these were the ones we felt matched what we wanted to accomplish in terms of information display and statistical precision.
They also have a number of selectable display options under “Distribution” on the left hand menu. We’ll work through each option and the use case below.
Plot Type: Area/Violin
Area is selected by default. Violin mirrors the area plot.
Distribution Displayed: Positionally Filtered/Any Position/Both
In the distro plots, we allow you to choose your options. Positionally filtered cuts the distribution of that stat to only players who have played significant minutes at that position. Any Position shows the distribution of that stat for all players.
Both… this is where things get a bit more complicated. If you have Area chosen for Plot Type, then choosing Both here displays the full population distribution as a dotted line.

However, if you have Violins for plot type, the top distribution will show the position filtered distro and the bottom one will show the full population.

Distribution Colouring: Radar Colours/Percentile Gradient/Metric Distinction
These are just preferences for how to colour the distros. Percentile Gradient offers some colour clarity to what percentile a player comes in at, but those values are also contained at the end of the vis.

Template Limits: Not Displayed/Dotted/Notches
In case you want to keep some grounding to the old radar style, you can choose to add either Dotted marks at the 5%/95% boundary of the population or you can add notches for each part of that distribution.

Comparison UI
Comparisons now happen on the front page. There is a drop down that loads your favourites for comparisons, or you can type to search for new ones. On any radar, clicking the star in the top left will add a new favourite. These can then be managed under the favourites menu that loads when you click the person icon in the top right of the IQ screen.
Both radars and distributions now offer overlays for comparing players and teams.

It's a big update to our platform and one where explaining the design choices and showing the new vis doesn't really encompass how much new stuff there is for customers to explore. And, as noted earlier, this is the first phase in a multi-phase release that will allow customers massive customisation options in how they choose to visualise and analyses information in StatsBomb IQ.
Thanks for listening!
--Ted Knutson CEO, StatsBomb
