
There isn’t just one way to win a football match.
Despite the fact that I think there are superior strategies and inferior ones (heavy crossing), football remains a complex sport filled with tactical matchups, strategies and counters, and above all, humans.
Most of whom are fallible. And one of whom is Sergio Busquets. (Check Honigstein’s mentions from yesterday for more about that one.)
Bayern Munich play significantly differently than Barcelona, who are quite a bit different than Manchester City, who are way different Atletico Madrid, who are different from Juventus, who are again different from Borussia Dortmund. Yet all of those teams are among Europe’s elite this season, and will have a fighting chance in the knock out stages of the Champions’ League, should they make it that far.
However, even with a diversity of strategy and plans available, at the end of the day the most likely way to produce winning football is to take more good shots than your opponents.
Note: A year ago, that likely would have said “more shots than your opponents,” but we’ve advanced a bit and now understand that getting into good positions before shooting dramatically affects goal likelihood. Barcelona and Fergie's Manchester United were big triggers for it, and now AVB's Spurs are a bizarro world case study. Baby steps. These days most of our analysis uses ratios of shots or shot effectiveness to examine how good teams actually are, and those are both damned interesting and useful. However, they don’t tell the complete story. 2:1 4:2 6:3 8:4 10:5 Those numbers all produce the same ratio. They do not, however, produce the same likely outputs in a football match. Confused? Bear with me.
What Is Shot Pace?
I wrote about this topic in the first football analytics piece I wrote waaay back in January *ahem*. Pace is a shorthand way of quantifying how quickly the ball travels up and down the pitch. I haven’t taken an updated look at this season’s numbers, but in general, EPL has the highest pace of all the leagues and Ligue 1 has the lowest. Scoring numbers don’t directly correlate to pace because shots on target percentages matter quite a bit, but I still like the concept and it’s simple to calculate.
So uh… why do we care about pace?
Alright, take the ratios above again, and think about that in terms of how games play out. A team with a 2:1 ratio is a highly defensive team that grinds out results, but they have to make those good shots count in order to score goals. (For what it’s worth, a ratio that low is pretty rare and I’m using it mostly as an example, but 4:2 is fairly common).
Now take the other end of the scale and the 10:5 team. It’s hard to get 10 good shots a game, and even the best teams probably only do this about half the time. Giving up 5 good shots a game is pretty high, but shooting twice as much as your opponents indicate a team is among the best in Europe, and the better team still has a fairly comfortable chance of winning despite what would be considered a loose defense by some standards. The 10:5 team plays quickly (remember, these are good shots, not all shots).
Margin for Error
So we have one dominant-but-grindy team and one dominant-and-fast team. What happens when they go a goal down early in the match? The grindy team probably has to make significant changes to their game plan in order to not only come back, but still try to win.
This can cause all sorts of problems for clubs that are used to controlling everything and suddenly have to pick up the pace in order to get a result. Shots become much less deliberately chosen, and the defense will likely struggle because it has less protection from players who are now forced to throw themselves into the attack.
The team with the fast pace… doesn’t have to change anything. So they gave up a goal… so what? They can still expect to score a bunch more throughout the course of the match if they play their normal gameplan. Obviously they don’t want to give up another goal, but they play in such a way as to mean conceding an early goal doesn’t affect the game plan at all. Mike Goodman noted in the past that Manchester United never changed their pace of play when they went down a goal – in fact, they actually seemed to slow down a bit.
If you know your normal game plan is going to score you a ton of goals anyway, why would you change? In short, despite the same general dominance in shot ratio, the team with the faster pace has a much better margin for error built in to their strategy than the team whose strategy involves grinding. Because of this, we can expect dominant teams with a faster paced strategy to perform much better over the course of a season than those who post similar ratios but play more slowly.
A Real World Example Back in August, the shot dominance for two top teams in Brazil looked like this:
Team A: 1.40
Team B: 1.46
There’s almost nothing in those numbers, and with just that information, you’d probably conclude the two teams were about equal. Now here are the actual shot counts involved in the dominance figure.
Team A: 11.6 : 8.3
Team B: 17.8 : 12.2
That is a massive difference.
The one trait I would definitely expect Team A to exhibit compared to Team B is far more draws. Despite the same ratios there, giving up a goal for Team A is far more crippling than doing so far Team B. Team A was Corinthians. Team B was Cruzeiro. Constantinos Chappas was kind enough to provide me with what the table looked like as of the date when those numbers were first pulled. At the time, Cruzeiro’s record was 5-3-2 and Corinthians was 3-5-2 (5 draws).
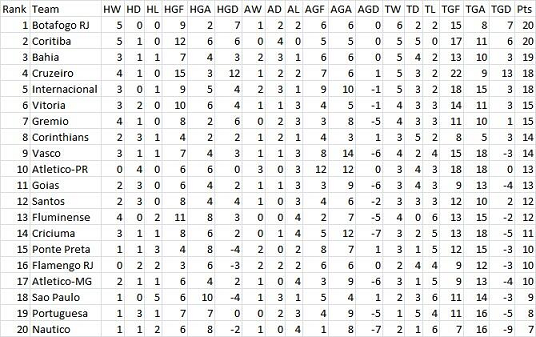
Fast forward to the current day and with two matches left in the season, Cruzeiro sports a 1.29 shot dominance and Corinthians has 1.19, so they stayed fairly close together in this metric throughout the season. Cruzeiro now has 23 wins, 6 draws, and 7 losses. They have also won the league and lead the second place team by 14 points, scoring 75 goals and conceding 34. Corinthians has 11 wins, 16 draws, and 9 losses.
SIXTEEN DRAWS and only two more losses than Cruzeiro. They reside in 10th place, having scored 27 goals and given up 21. With wins worth 3 points and draws worth 1, draws are suboptimal. A lot of draws coupled with a normal amount of losses will kill a team's title chances.
Conclusion and Further Research
I haven’t crunched the numbers yet across all my data, but there’s a fairly strong indication that pace will be highly correlated with draw percentages. Additionally, teams in a particular band of Shot Dominance (say 1.15 to .85) and a lower pace will also likely be monster outliers compared to league average in draw frequency.
However, draw percentages can be heavily influenced by manager strategy (Pace is as well). If managers shell when trying to protect a lead and don’t have an effective counter attack out of it, they probably draw more than a team that stays aggressive in searching for the second goal. It will be interesting to see what future research turns up here.
A fun final morsel before I go from the current Ligue 1 season.
Average league pace: 23.5 Montepellier Pace: 21.9 Montpellier Shot Dominance: 1.03 Montepellier Record: 2 wins, 9 draws, 3 losses. Goal Difference of 1. Current draw percentage of 64%.