End of my Hiatus
First things first. Although I never publicly announced it at the time, I’ve spent the last 12 months consulting for a Premier League football team. My engagement ended at the end of the 2015/16 season and so now I’m able to pick up my virtual pen and begin writing again. It’s been about 18 months since I’ve done this so please be gentle...
Player Aging
Player aging is a thing. We know that people get physically stronger as they mature from a teenager into an adult and then some time later they begin to lose some of their physical edge. That much is a fact, but what is open to some debate is when exactly those transitions happen, what is the extent of the improvement and subsequent decline and also whether players’ increasing tactical knowledge and “game sense” as they gain experience can help offset some of their loss in physical edge.
There have been other pieces written on player aging. Michael Caley has written about this, as he has done with just about everything else to do with football analytics, but while most of the current writings tend to focus on the share of player minutes at each age I wanted to have a more detailed look at how some individual components of players’ performances are impacted as they age.
Data Rules and Explanations
As always, Opta is the source of the data that I’m using in this study and I’m looking at the Big 5 Leagues for the 6 seasons from 2010/11 to 2015/16. I wanted to take a look at each position separately as the skills required for each position may be different.
I used the Opta starting formational information and included players who started the games, dividing them into the following positions:
- Full Backs
- Centre Backs
- Midfielders (Central: defensive or attacking)
- Wingers
- Forwards
I undertook the analysis at a game by game level, so in the games where, for example, Christian Eriksen started centrally his numbers went into the Midfielder grouping, whereas when he played on the left side of midfield his numbers went into the Wingers grouping. There may be an amount of arbitrary decision making around the position assigned to the players by Opta, but I think my method should ensure that players are broadly assigned to the correct positional grouping.
I then excluded any players that didn’t play at least 540 minutes in a given position and analysed the remaining players through the use of a few summary season metrics. The hope is that we get an idea of how the individual components of a player’s game are impacted by their aging.
I grouped all players together who were younger than 20 (identified in the “Teen” group in the charts below) and at the other end of the scale I grouped all players that were older than 32 in the “Old” group. At my stage in life, 32 actually seems quite young, but that’s probably a discussion for another day!
The player’s age for each season is taken as his age as at the 31st December in the season, and the individual metric value generated for each age group is the median value of its population. As there will likely be some variation across leagues I initially analysed each of the five leagues separately, but there was quite a bit of noise as some of the bins were too small so I decided to combine all the leagues to maximise my data size as I want to be able to identify the general trends.
In this first part of my look at Player Aging I will concentrate on the attacking positions, Wingers and Forwards. Other positions should / may follow this article.
OK, so now on to the good stuff………
Wingers – Key Metrics
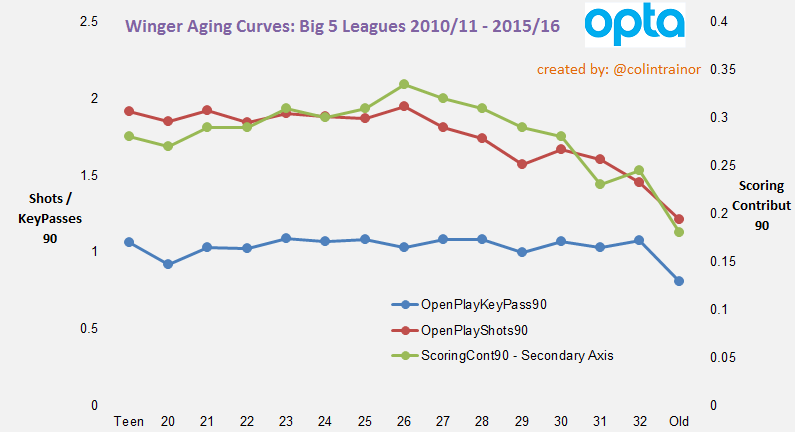
Let’s go straight in and look at the key attacking output of wingers; namely Open Play Shots, Open Play Key Passes (regardless of whether those KPs were converted or not) and Scoring Contribution. Scoring Contribution is defined as Non-Penalty Goals and Assists, and as you are reading this on StatsBomb all three metrics are shown on a Per90 basis.
The secondary axis (the one on the right side of the chart) is the axis for Scoring Contribution, whilst the main axis displays the Shot and Key Pass numbers.
Open Play Shots
The red line represents Open Play Shots per 90 minutes and there is a very tiny increase in this level until players reach the age of 26 (1.95 at 26yo vs 1.85 at 22yo). After the age of 26 there is a very clear drop off in shot volume for wingers and by the time they reach 29 years old their shot volume has dropped to about 1.6. There is then a small uptick at 30, but the pattern is clear; Shot volume for wingers reduces after they reach 26 years old.
Open Play Key Passes
Immediately we can see that for the blue line (Open Play Key Passes) the change in output for wingers as they age is not as severe as that observed in their change in shooting volumes. There is a slight increase from teenage years until players reach the age of 23, and then it flattens until 28 when it begins it’s very slow decline.
One hypothesis for this almost (but not quite) horizontal line is that there are many different ways to play a Key Pass, for example, they can be created through a burst of speed or through the playing of a well-timed, accurate pass. The former of these methods is more likely to happen with younger players, whereas the latter may be suited to a more experienced player and so we don’t really see age having much of an impact on how creative wingers are.
Scoring Contribution
The green line, which represents Scoring Contribution, is the absolute key one in terms of final output for attacking players as it represents how many Non-Penalty goals they either score or directly assist. The pattern here for wingers is very clear as it steadily increases from their teenage years until they reach 26, at which point it begins its steady decline.
In absolute terms, the median Scoring Contribution value for 21 year old wingers is 0.29 Per90, and this increases to 0.34 by the time they reach 26 years old, and then decreases to 0.28 by the time they reach 30. Those differences may sound small, but over a 38 game season the difference in the output between one 26 year old and one 30 year old winger comes to almost 2.30 goals.
Forwards – Key Metrics
We’ll now run the same analysis for Forwards as we did for Wingers.
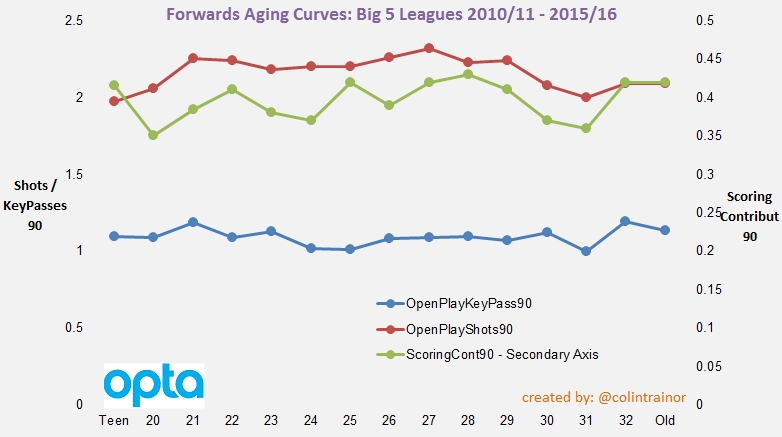
It’s probably no great surprise to see that the lines on the Forwards key output charts following similar patterns as those seen in the Wingers’ chart. Shot volume increases until it peaks at 27 while Key Pass volume broadly remains fairly flat throughout the career of a forward.
In terms of the composite metric, the green Scoring Contribution one, there is an anomaly with 32 years and older forwards performing very well (notably in Italy). I assume there will be a large element of survivor bias in this number as any 32 year old (or older) that is playing is more likely be doing so because they are performing whereas the same probably can’t be said for the average 30 year old forward. However, leaving this wrinkle aside we can see a general increase in Scoring Contribution for forwards until they reach 28 years of age, at which point their numbers can expect to decline.
The extent of the decrease in Scoring Contribution between a 28 year old forward and a 24 or a 30 year old forward is similar to what we seen when looking at wingers. The median 28 year old clocks up 0.43 Scoring Contribution Per90, compared to 0.37 for both a 24 year old and a 30 year old. This lack of a peak age forward leading the line for a team again equates to an expected shortfall of 2.30 goals over a full season.
Wingers - Other Metrics
Apart from the key output metrics I wanted to look at how a few other metrics reacted, across the population as a whole, depending on the age of the winger.
Dribbling
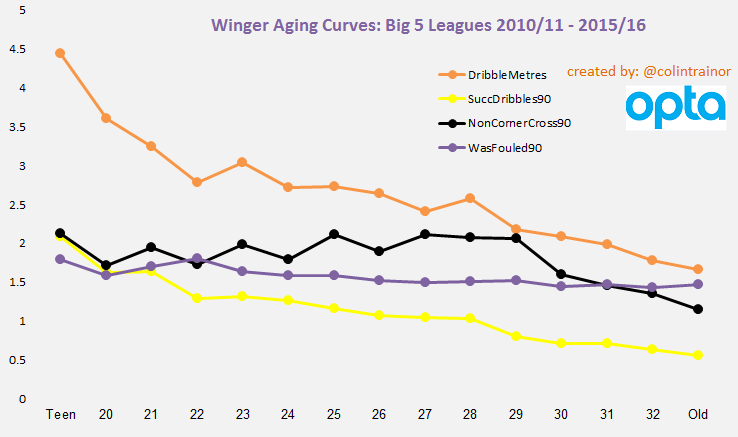
Two of the metrics on the above chart relate to dribbling. The yellow line is the traditional Successful Dribbles stat as provided by Opta while the orange line is one of my processed metrics. The orange line represents the number of metres that the player dribbles the ball closer to the goal than from where they picked it up; so this shows how much progress towards the goal the player makes when carrying the ball.
These two dribble metrics follow a very clear and similar pattern, albeit a somewhat surprising one. On the whole, wingers will dribble the ball less with each passing year. Unlike the shooting and Key Pass metrics that we read about earlier in this piece, players do not carry the ball further or more often in their mid to late twenties than they do in their younger years.
To me, this is really interesting. We have seen that wingers’ attacking output (as defined by shots and assists) increase from their early twenties until they reach 26 years old yet we see that they are carrying the ball less often and over shorter distances. The median winger will have 1.1 successful dribbles when they are 26 years old compared to 1.6 when they are 20 or 21 but their decreased ball carrying does not seem to have an adverse impact on ultimately how creative they are.
One hypothesis for this is that they simply become smarter footballers as they mature. They make better choices as perhaps they no longer feel that they have to prove themselves by beating their man like they did when they first broke into the team. Perhaps they learn to lift their head and look for better options instead of simply carrying the ball for its own sake.
The takeaway from this discovery: So while we look at (for example) a 19 year old Raheem Sterling and marvel at his numbers we should bear in mind that, whilst his end product should increase until he reaches his mid-twenties, we should expect his ball carrying numbers to reduce.
Fouls Won
The purple line displays the number of fouls won or drawn by the median winger at each age of his professional life. Although the line looks fairly flat on this chart there is a slight consistent reduction in fouls won from 22 years old (from 1.8 to 1.45 by the time the winger reaches 30). Despite the existence of this slight decrease in fouls won as the winger ages it’s clear that the pace of decline is nowhere near as sharp as that shown in the main dribble metrics.
Once again, that’s an interesting result.
Does this suggest that it demonstrates players becoming cuter or more “game smart” as they develop in years because they can draw a foul comparatively easier (when controlling for how much they carry the ball) than when they were younger? Or does it mean that fast players can’t or don’t win free kicks as often as we think they should?
Non-Corner Crosses
The last remaining line on the chart, the black one, shows us how many non-corner crosses the median winger plays. There is a blip at 25 that otherwise distorts a fairly clear increase in the number of crosses wingers play until they reach 27 to 29 years old, after which point the output sharply decreases. As the value of a cross is pretty marginal I’ll not spend any more time on this one but just wanted to mention it as I pulled the data to get to this point.
Forwards – Other Metrics
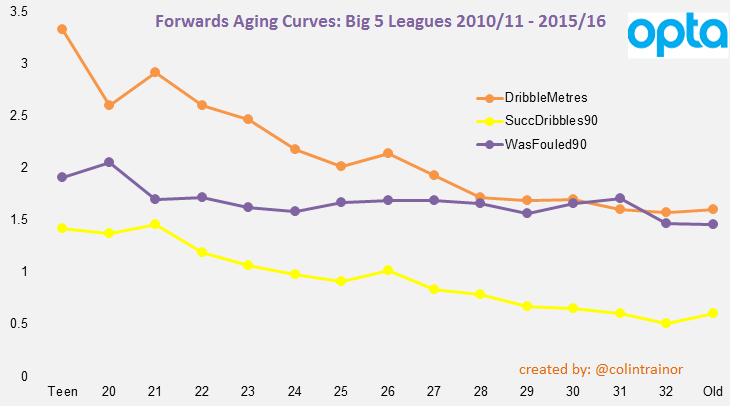
No comment required here as the lines for the dribbling metrics and fouls won for forwards are almost a carbon copy of the wingers’ numbers produced earlier. This in itself is encouraging as the emergence of similar patterns across two totally distinct data sets gives us confidence that there is signal in what we are looking at.
Conclusion
For most readers, this won’t be the first time they have read about Player Aging in football, and as a concept it is quite straightforward. However, the reason that I undertook this research was that I was unable to quantify the impact that playing a 24 year old or a 30 year old player instead of a player at peak age (assuming both have achieved similar percentile achievements in their age bracket) for its position would have on a team’s expected output.
Balancing a squad from an age perspective is difficult; buying to improve your chances of immediate success will have a negative impact on your future chances and buying young talent to maximise resale value means that the team won’t be at their absolute peak for the forthcoming challenges. It’s undoubtedly a tough line to walk successfully but now when teams make decisions around the age structure of their squad (here’s looking at you, Man City) we can be a little more knowledgeable around quantifying the potential impact of the decisions that are made.
Although the charts contained in this piece relate to the median number posted by each each group for each metric I also looked at the 80th percentile and, while the curves were obviously higher than the median ones, the drop off from the peak was roughly a similar amount to those displayed here.
Based on the data that I have analysed it looks like the peak age for a winger is 26, whereas a forward peaks a year or two later when they reach 27 or 28 and the expected impact of playing the 24 or 30 year old instead of your peak age player on an ongoing basis will shave approximately 2.30 goals from your attacking output over the course of a season.
