
The latest destination on our traverse around the Big 5 European Leagues sees us land in England. The Premier League pendulum could be swinging back across the North-West, it's halcyon days if you wear claret-and-blue, whilst a couple of yo-yos appear to be unwinding at the bottom.
It's been four seasons since the top of the Premier League table has been this close after 22 games. There was a 25-point gap between 1st and 4th at this stage in 2019/20, it's just seven points in this campaign. Both Liverpool and Manchester City have taken it in turns to race ahead of the pack in recent seasons - some title races have been processions as early as January - but, for now, things remain congested.
With heavy recency bias, the current prevailing narrative is that Liverpool may well have ceded their title defence already. We all know how unrelentingly good they were last season (they were 21-1-0 at this stage) and maintaining those otherworldly standards was always going to be tricky - and that's even before you factor in the injury to Virgil van Dijk (and Joe Gomez, and Joel Matip...) as well as the issues in negotiating a pandemic-condensed fixture list.
It'll raise eyebrows, but there’s virtually nothing between Liverpool’s metrics last season and this. Their attack is identical, creating 1.8 xG per 90 and, ok, shots have risen from 15.4 to 15.6, whilst their defensive metrics have also seen a slight improvement, knocking 9 shots per game down to 7.7, and xG conceded from 1.0 xG to 0.9 xG.
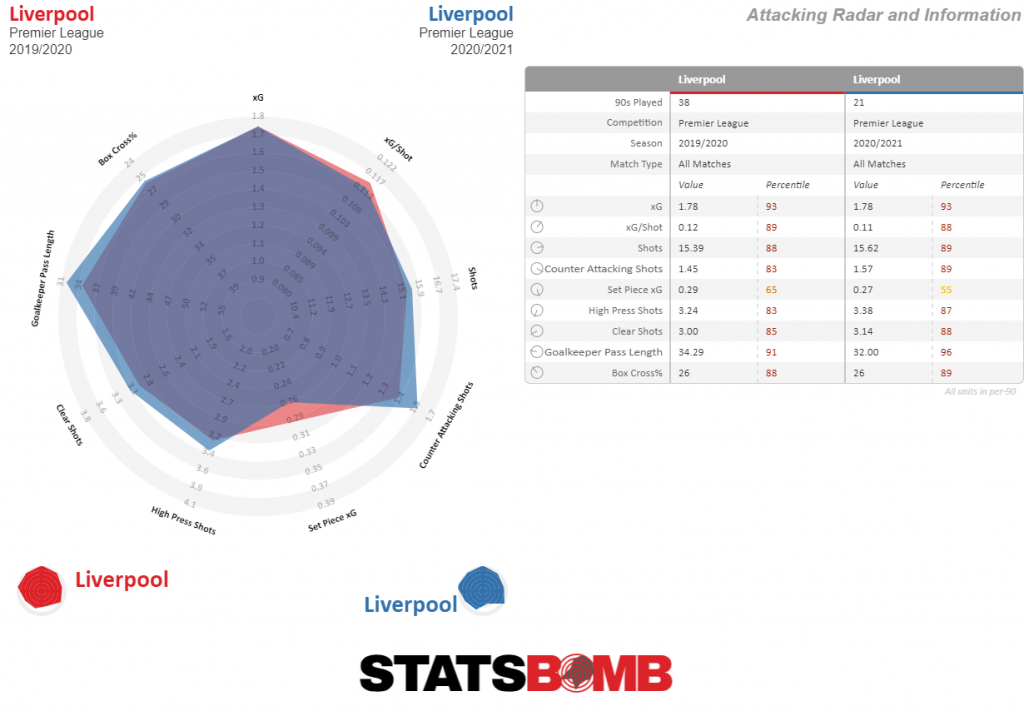
The metrics may be the same, but obviously the results are not. Why the big difference in outcomes?
More detailed analysis on their title win can be found in their season preview by James Yorke, but it boils down to this. Liverpool were extremely good at taking the lead in games last season, scoring first in 16 consecutive wins between November and February, for example. Not only that, they were also very good at doubling their lead once they were ahead. And what happens when you’re 2-0 ahead? You stop attacking as much and your opponents start attacking you more. Your chance creation decreases, your opponents chance creation increases.
This would’ve kept a ceiling on their metrics last season, and therefore those metrics may not actually be a true reflection of how good a team they really were.
This season, they’ve spent far less time ahead and haven’t opened the scoring as regularly, meaning they’ve had to keep their foot on the accelerator more often and their opponents have sat back to try and soak up the pressure - conditions under which you’d expect the metrics to skew more in Liverpool’s favour. So, whilst season-to-season the numbers may look the same, they're the product of very different game scenarios.
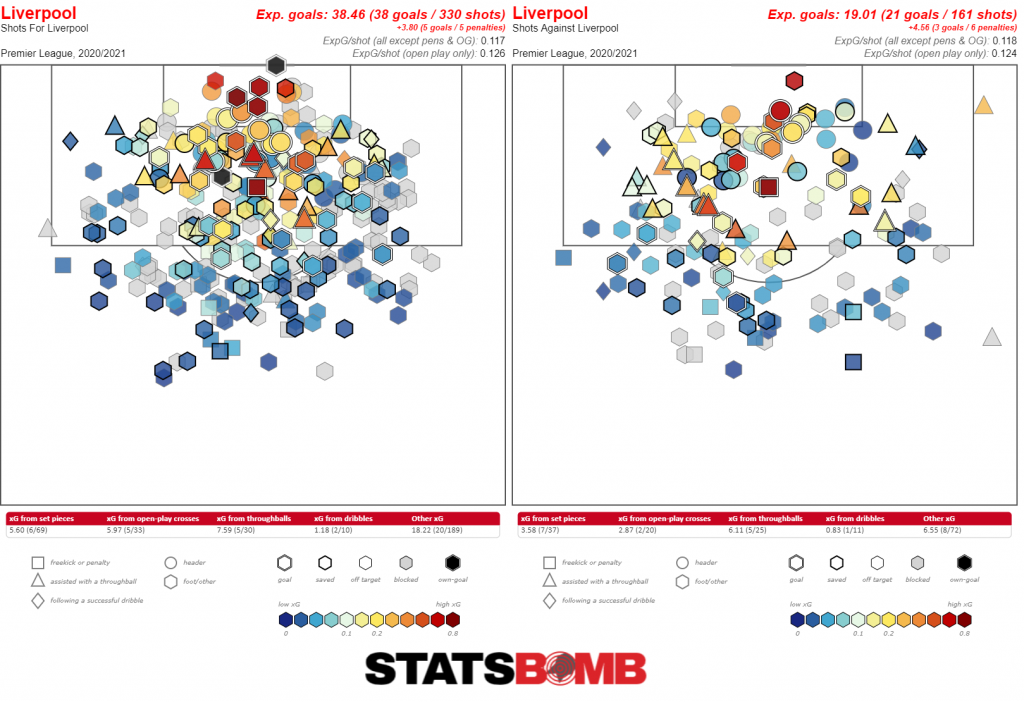
Another factor is that Liverpool are scoring slightly behind expectation in both attack and defence in 2020/21. Turns out this team is from Planet Earth after all, despite their near-perfect showing last time out suggesting otherwise.
For all that’s gone wrong at Liverpool, relatively speaking, let’s talk about what’s gone right at Manchester City. The pendulum swung away from City last season as they finished a distant second, but right now it’s looking like it might be their time again. City are top, with the best goal difference, a game in hand, and have just won nine games on the spin.
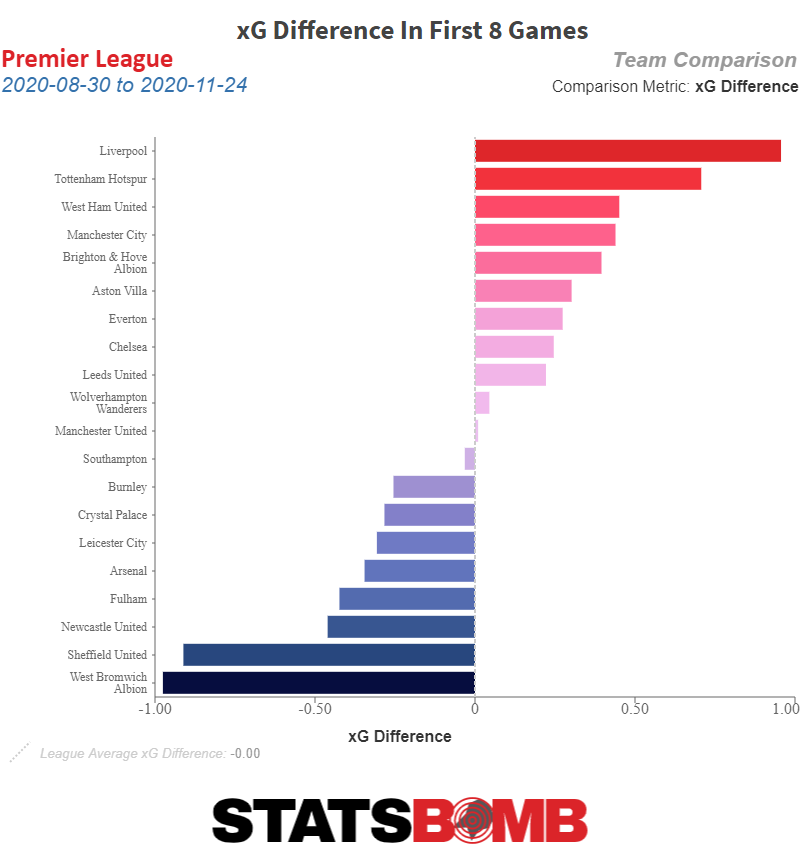
Which means that their start to the season is already an imperceptible spec in the rear-view mirror. Just 12 points from their opening eight fixtures suggested City might fall short again, but that reaction now looks like it may've been premature, both with hindsight and when you consider they had to face Liverpool, Leicester, Spurs and Arsenal in a tricky set of opening fixtures.
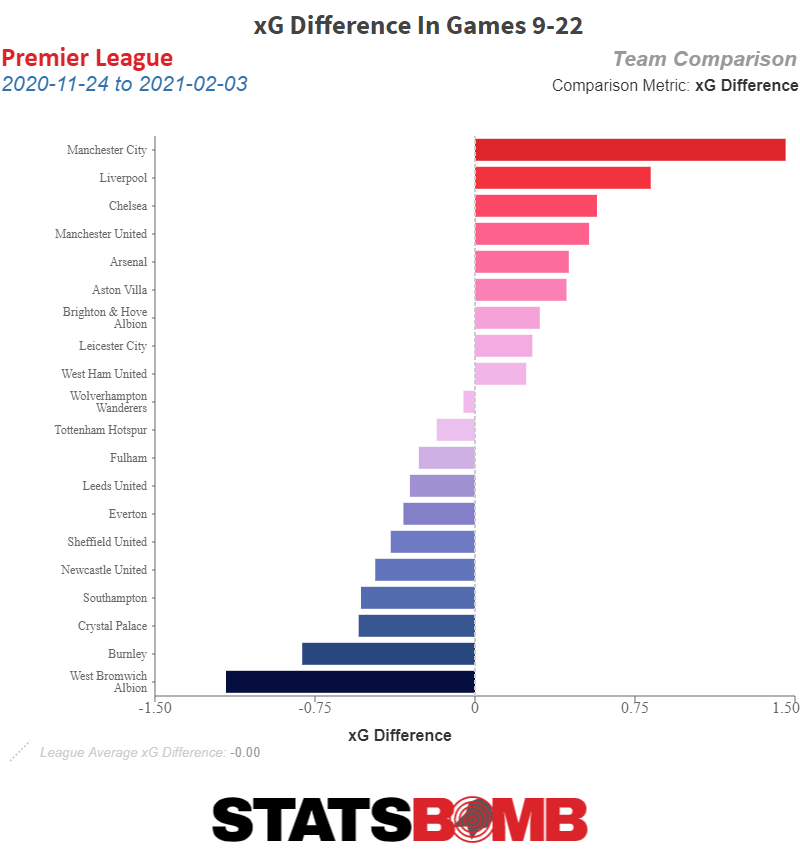
A run of 11-2-0 from their next stretch has seen them muscle their way to the front.
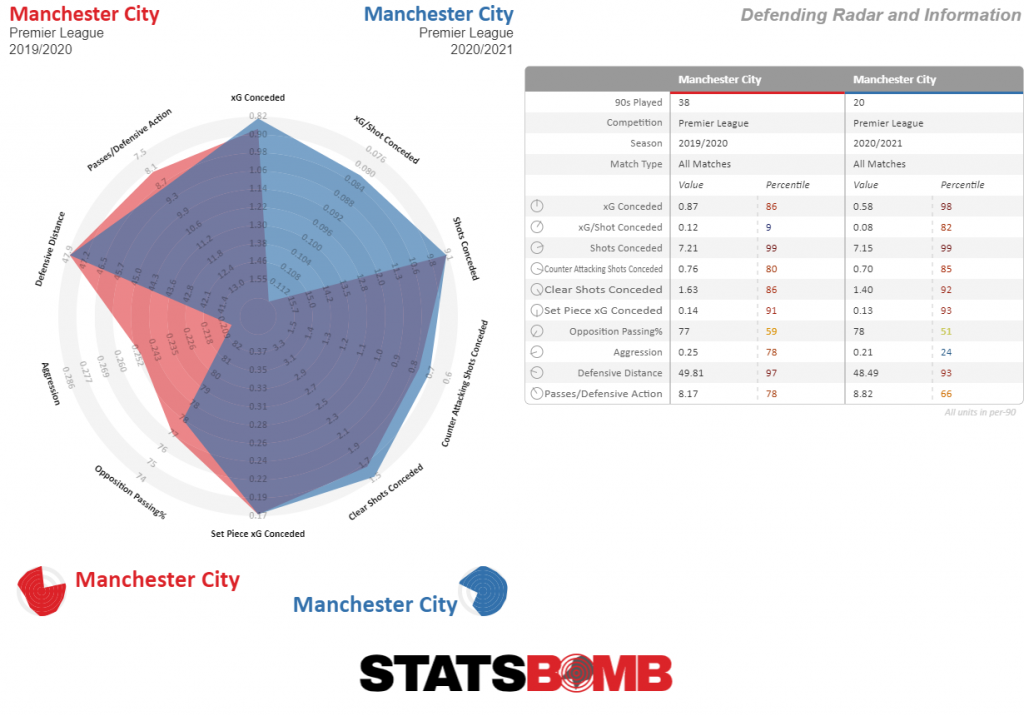
What may've been underplayed is that this is a different Manchester City team to the relentlessly attacking one we've been accustomed to in recent years. Their insatiable desire for goals has been replaced by an insatiable hunger for clean sheets. They're creating less in attack compared to previous seasons, but this is also the tightest they've been defensively in a long time. The trendline below shows the single-game xG values for each fixture and illustrates how consistent they've been at the back. They've conceded more than 1.0 xG on just one occasion.
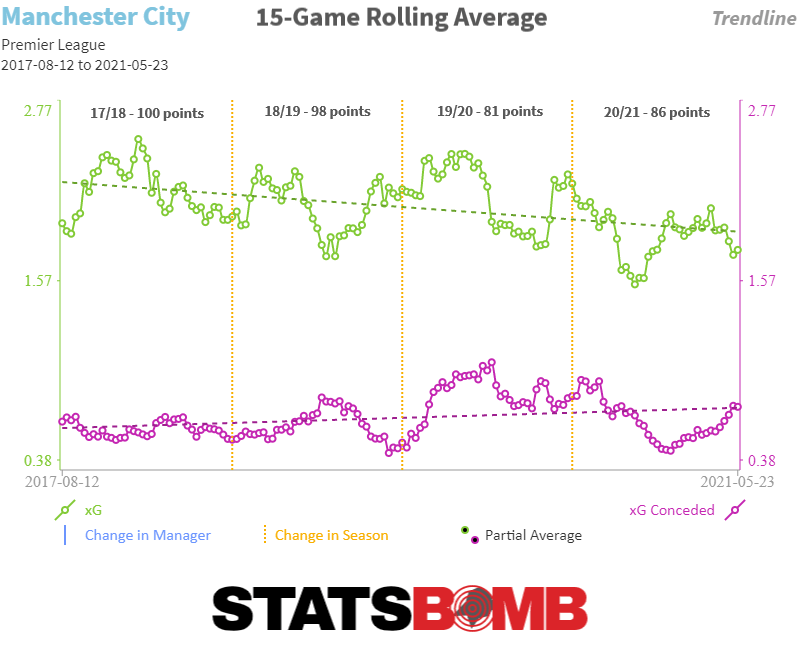
They're successfully limiting the number of shots their opponents are able to generate, but it's mostly a very noticeable decline in the quality of chances that City are giving up that has driven this improvement - this is the lowest xG per shot conceded that City have recorded in four and a half seasons of StatsBomb data.
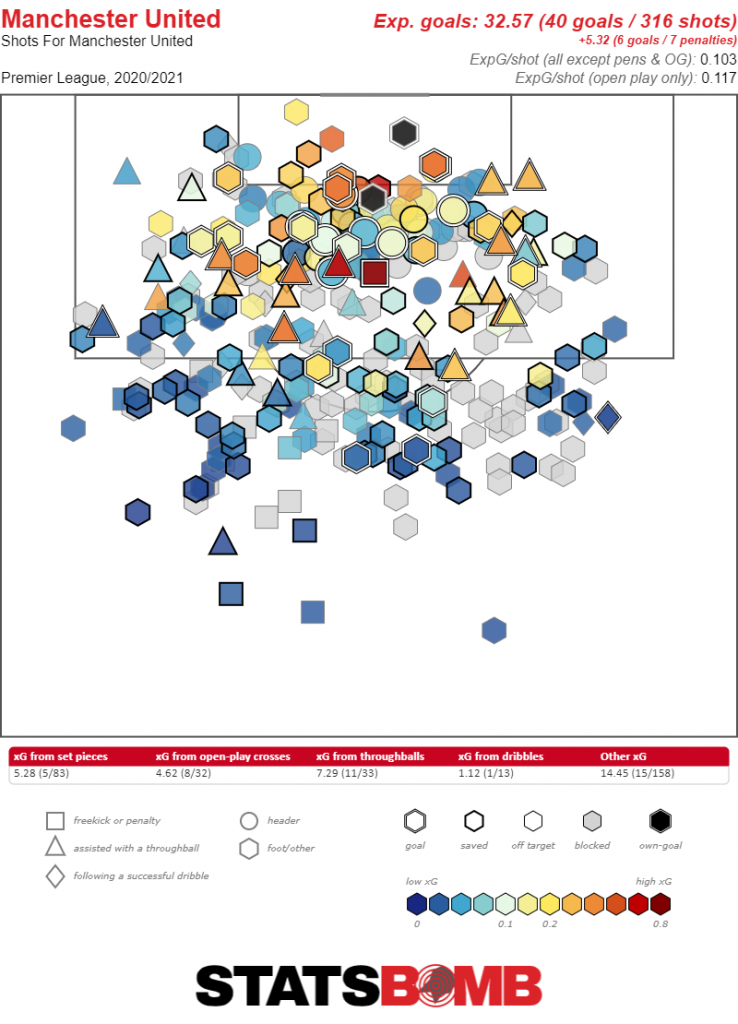
The title appears to be City's to lose at this stage, but the red half of Manchester are very much in this race as well. Manchester United are 2nd in the league and are also top scorers with 46 goals. The entire United squad appear to have to magic finishing touch right now with the exception of Anthony Martial and, perhaps surprisingly, Mason Greenwood. Greenwood blazed his way to 10 goals from 3.6 xG last season, but it's just 1 goal from 2.5 xG this. Fortunately, his teammates have taken on the mantle to leave United as a whole ahead of expectation.
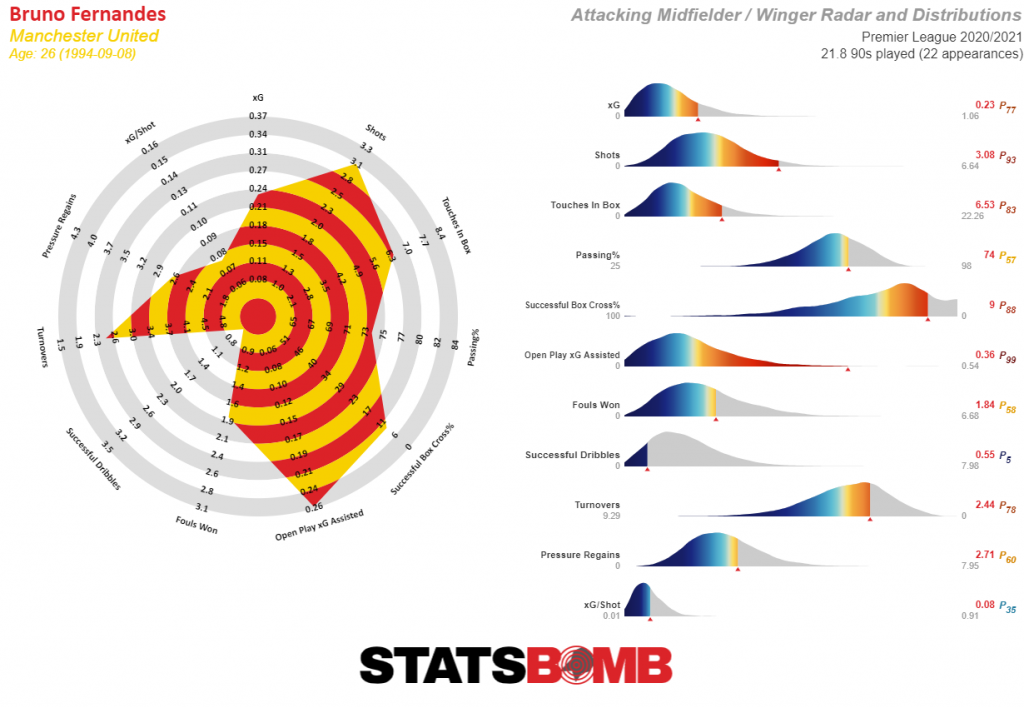
Bruno Fernandes has continued his excellent form since signing in January last year, serving up chances for the United attack with the regularity that Marcus Rashford serves half-term dinners. Fernandes has been the creative cog and link player between the midfield and attack that had been missing from the United side for years, and his performances have put him firmly in the conversation for the end-of-season player of the year award.
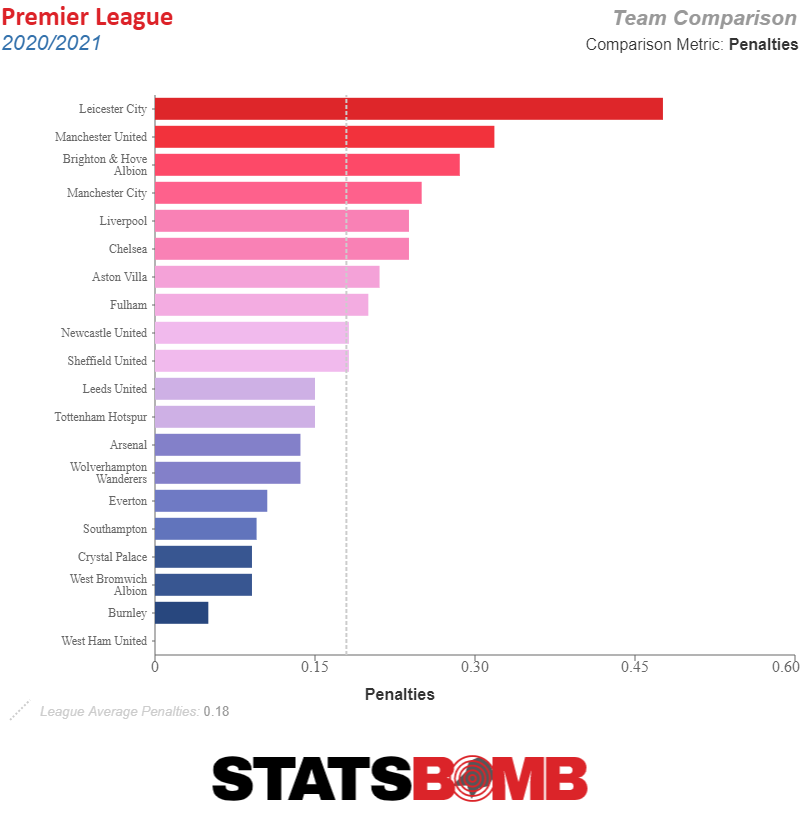
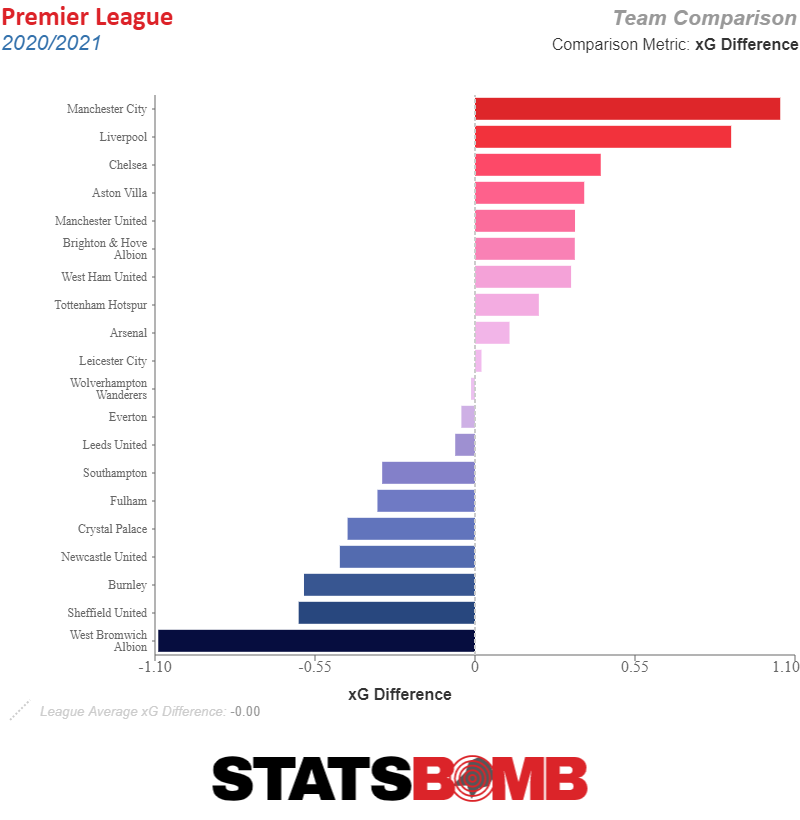
Leicester are third and at the speed they’re picking up points are rightly considered contenders, though they’re coming off less impressive metrics than their competition. Their expected goal difference is just above zero without penalties, but that comes with the caveat that they haven’t had to be as productive in open play due to their rate of winning spot-kicks, which at a 1-in-every-2-games rate is currently the highest in the Premier League and also the highest since the 2016/17 iteration of Leicester City.
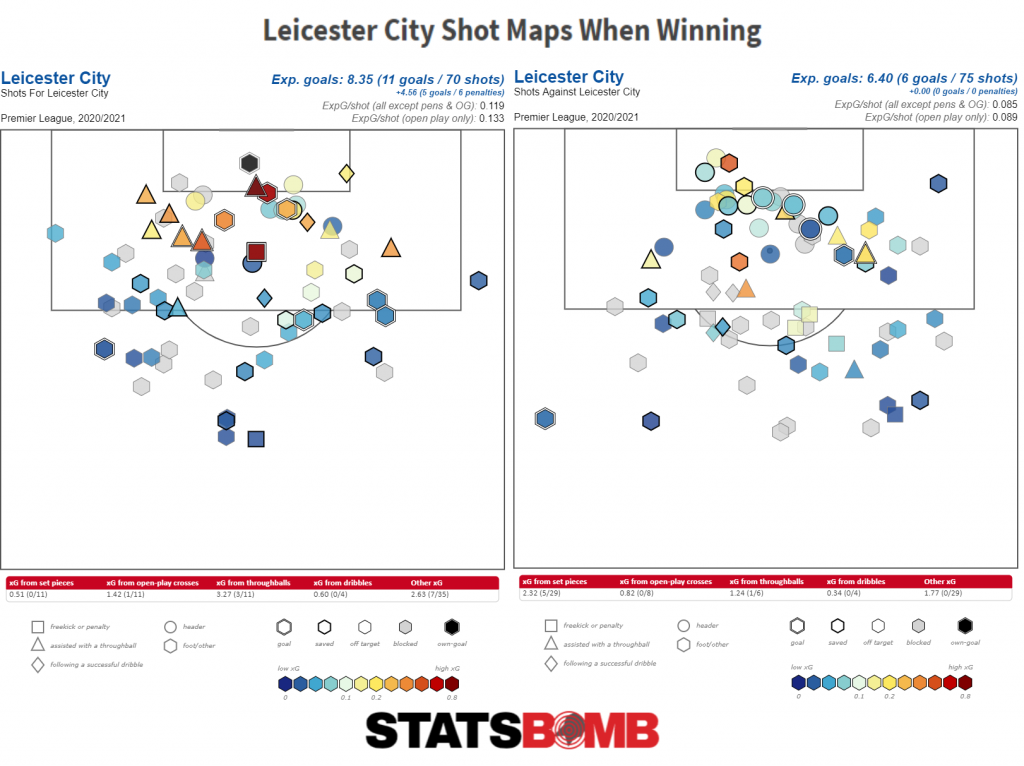
What Leicester do have in their favour, and the secondary explanation for their strong points tally despite the average metrics, is their record when taking the lead. The Foxes have gone in front 15 times in matches this season and conceded equalising goals on just two occasions. They’re at their best when ahead in games as seen in the positive-game-state shot maps below. They still create more than the opposition despite having a lead to hold onto. It’s also notable that six of their ten penalties have been won when they're ahead, allowing them to settle nerves and secure victories.
A collection of over and underachievers exist in the smörgåsbord between 5th-10th. Even now, ignoring pre-season expectations, if I asked you to put Arsenal, Aston Villa, Chelsea, Spurs, and West Ham in order of where you think they lie in the xG difference table, I bet it wouldn’t be this:
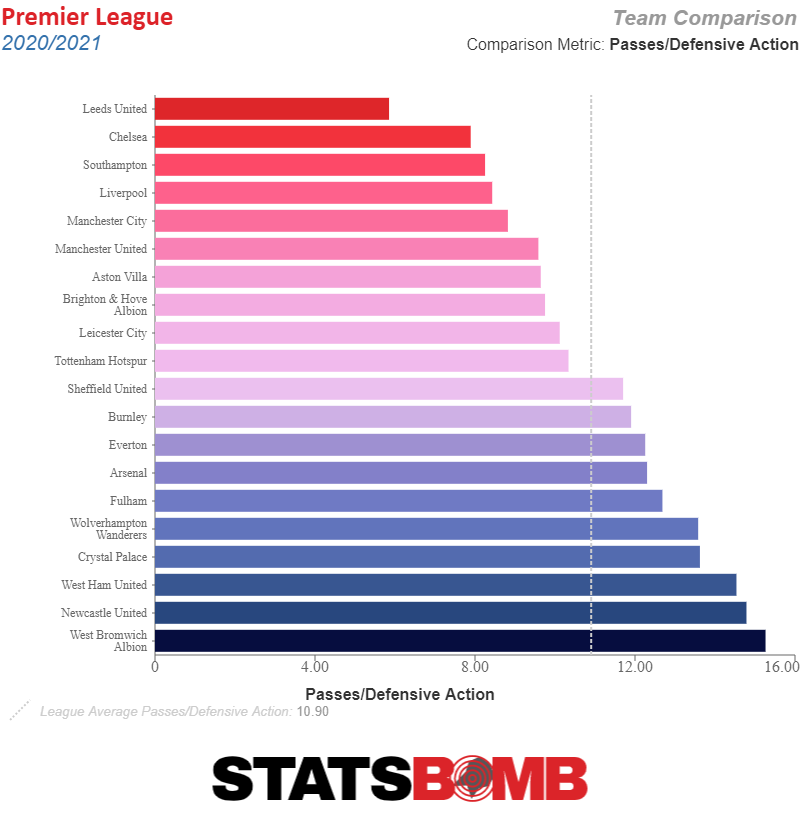
There’s also a deserved word to be said on Leeds too. People can’t seem to stop talking about Marcelo Bielsa's side this season and it’s not hard to understand why: they've come up from the Championship, changed nothing, and the result is the fourth-best attack and the second-worst defence by xG. Leeds games are box office; their press like a 90-minute swarm of angry Yorkshire bees, with a regular flow of chances at both ends of the pitch. Leeds' PPDA of 5.9 is a Premier League low in the last four seasons.
Lastly, the bottom of the table where three teams find themselves cut adrift of the pack. Just three points separate Fulham, West Brom, and Sheffield United between 18th-20th, though that gap was larger before Sheffield United picked up three wins in their last five.
There was talk of the Blades’ possibly becoming the Premier League’s worst ever side before that renaissance, but it’s newly-promoted West Brom who would be the strongest candidates for that dishonour on current showing, had they not already surpassed 2007/08 Derby County’s points tally. The Baggies currently have the worst xG difference per game and the worst xG conceded of the past four and a half seasons of StatsBomb data. And as the ancient football proverb goes: what yo’s up, must eventually yo down.
Join us at StatsBomb Evolve on March 17th 2021 to discover how we're going to change the football industry, including the launch of our new data product, StatsBomb 360. To find out more, click here.