It’s nearly two years since the StatsBomb site was relaunched in its current form, and I’ve been writing about the Premier League here for most of that time. With no football until God knows when, now is the best time to take stock and look at what we’ve learnt over the past couple of seasons. Expected Goals catch up to you... eventually It’s May 2018 and Manchester United are flying high-ish. A second place finish with 81 points is comfortably the best they’ve done in the post-Sir Alex Ferguson era, even if Pep Guardiola’s Manchester City look a long way off. The usual rumblings with Jose Mourinho are going on in the background, but with the right signings there’s no reason why this positive trajectory can’t continue, right? Unfortunately for Man Utd, the rot had already set in some time ago. The 2017/18 season saw them concede nearly 14 goals fewer than expected, while scoring an extra 10. The data suggested the most likely outcome was a decline in results, and guess what? Well, you’re reading a football analytics website in the middle of the coronavirus pandemic, so you probably know Mourinho was sacked by Christmas. It’s true that the side did decline in other ways, but the xG overperformance coming to an end was paramount. United actually conceded 3.5 more goals than expected in 2018/19, and though they scored an additional 4.4, we’re not talking about hugely significant finishing gains. 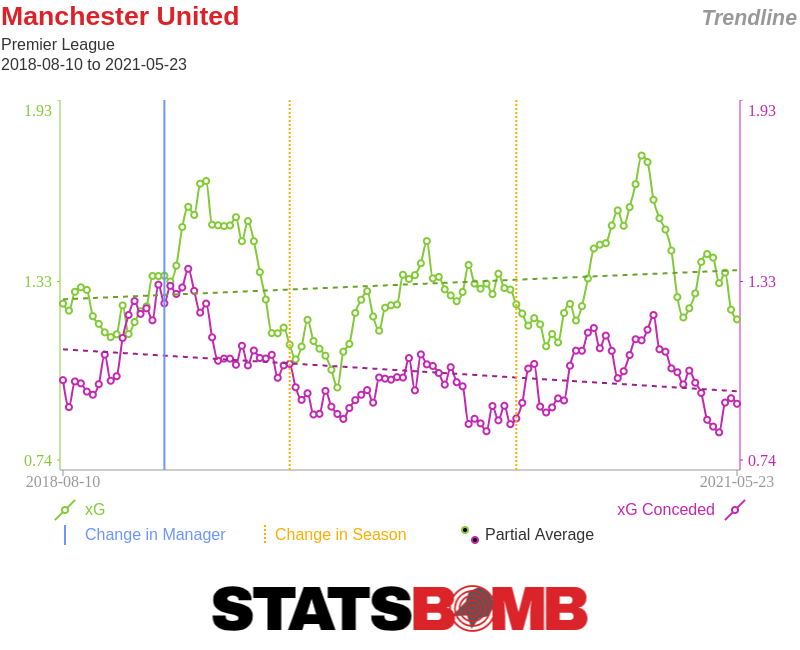 The same story came true for Mauricio Pochettino at Tottenham, although it took its time. If we look at the xG trendlines, it’s pretty startling how much Spurs start to decline in both attack and defence around spring 2018 and never recover.
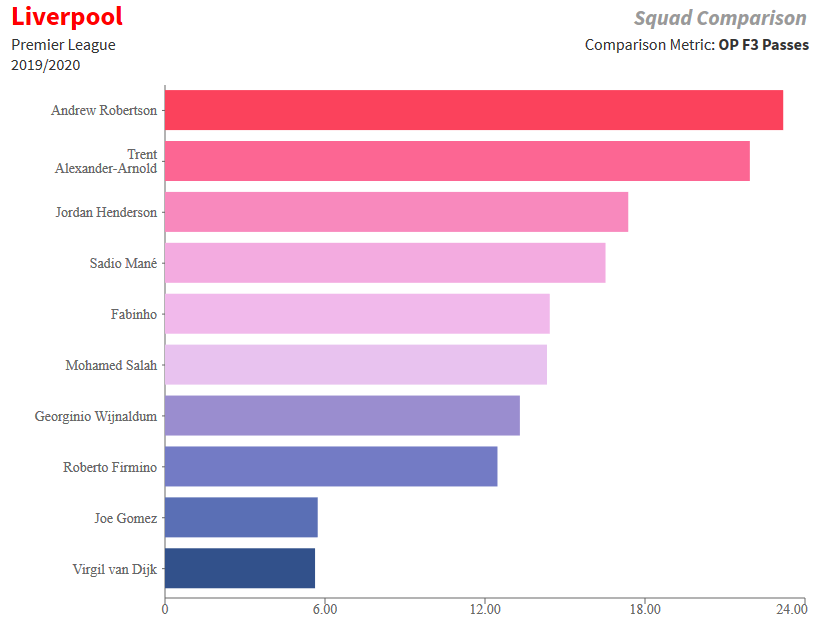
 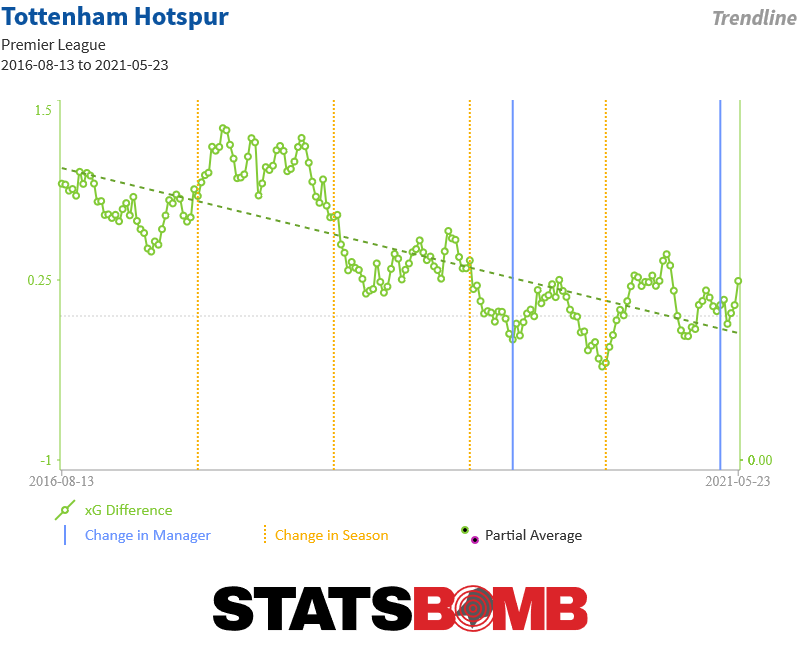 Spurs spent calendar year 2018 beating xG at both ends of the pitch, scoring nearly 17 extra goals and conceding almost 9 fewer than expected. A number of reasons were put forward to explain this: good goalkeeping from Hugo Lloris, elite finishing from the likes of Harry Kane and Son Heung-min, or even Pochettino’s tactics. It’s entirely possible that some of those factors were in play, but ultimately you can’t outrun xG forever. Different ways to get it forward Liverpool are 25 points clear at the top of the Premier League table. If we ever play the rest of the season out, it will be a coronation process for the Reds. The biggest stats story with Liverpool is in how they move the ball forward. Looking at the graph below, we can see the players most used in moving the ball both into the final third (x-axis) and then into the box (y-axis) are the two full backs, Trent Alexander-Arnold and Andrew Robertson.
 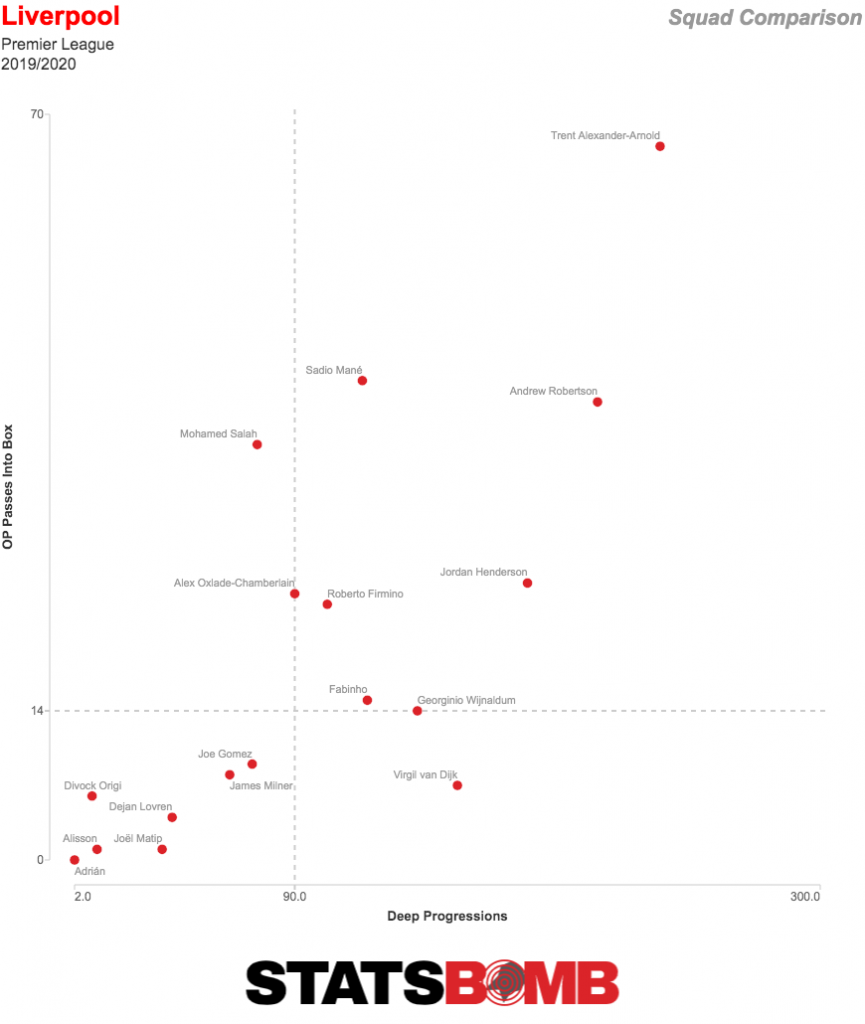 But then we take a look at second placed Manchester City, and a different story emerges. It’s Kevin De Bruyne town, with the full backs a much smaller part of the picture.
 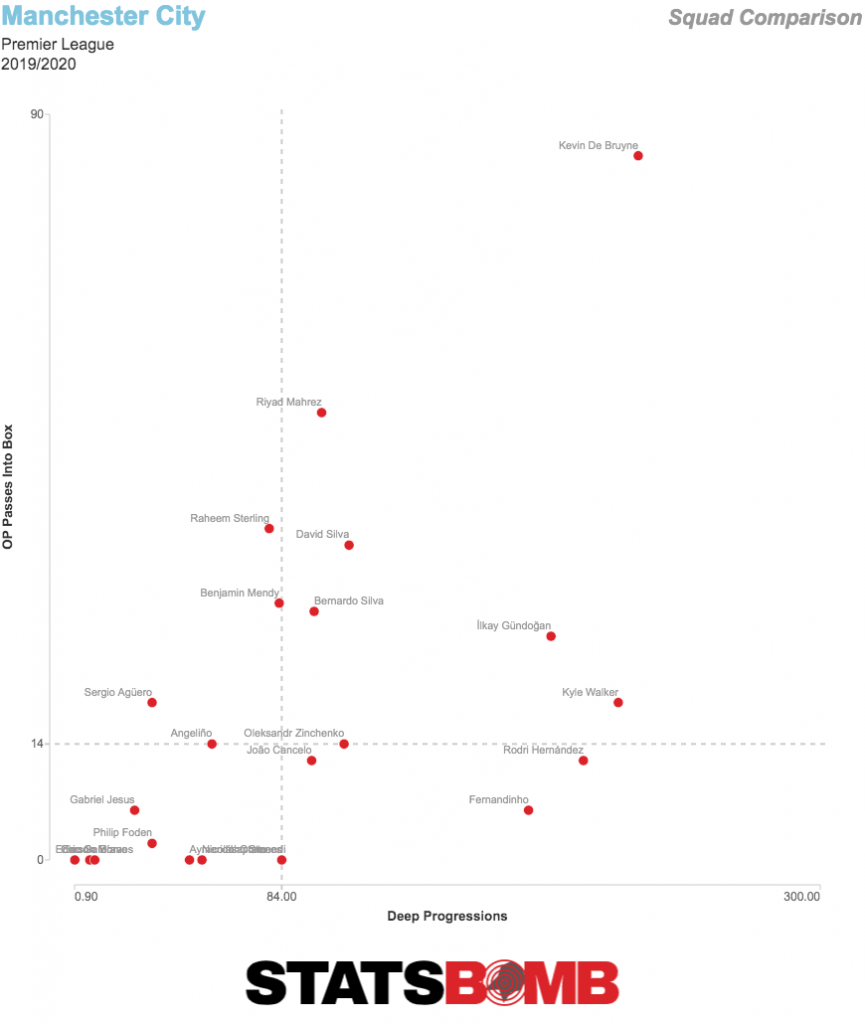 The top of the Premier League has two entirely different models for how a team should be able to get the ball forward without sacrificing solidity. There’s the Jürgen Klopp model, which takes the view that midfield should be kept as tight and ugly as possible, but then giving the full backs freedom to roam and become key players in the attack. The Pep Guardiola model, conversely, uses the full backs as facilitators in the midfield areas to make the side more solid, then allowing some of the nominal midfielders to be more involved in the final third. Both “work”, but it helps show the greater tactical variance in the league from 20, 10 or even 5 years ago. High pressing works, but there are other ways There has not historically been an obvious way of measuring "pressing", and a raw count of StatsBomb's pressure data does not instantly show a solution. When we look at the teams making the most pressures, we see a list that doesn't really correspond to most people's ideas of the Premier League's high pressing sides.
 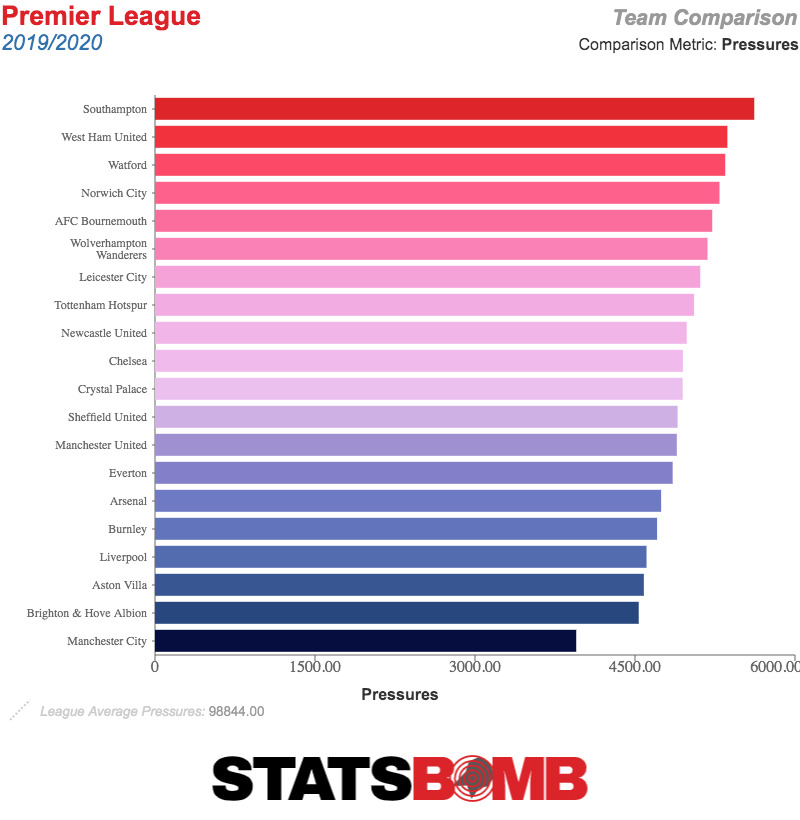 Man City at the bottom! That includes a lot of chaotic defending in teams' own third, so let's strip it down just to pressures in the opposing half. There's a little more of a pattern here.
 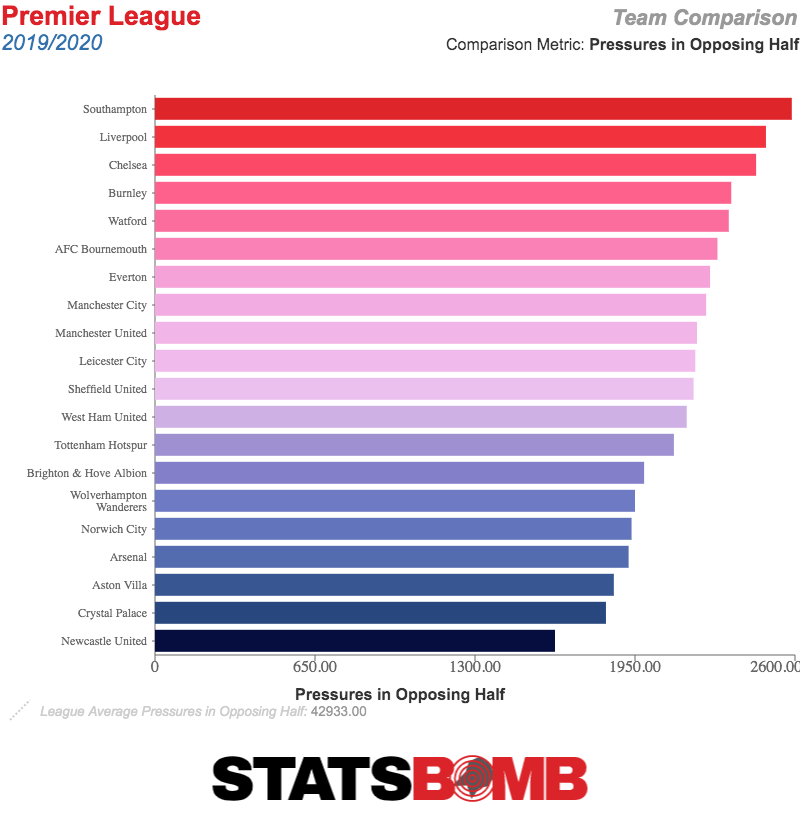 Man City still look like a middling pressing team, which obviously isn't what most people see with their eyes. They have so much possession that they're rarely having to make many pressures, which is the issue here. Raw numbers of pressures don't seem to tell us much of note. If we just look at the percentage of all pressures made in the opposing half, then guess what? City shoot up to the top of the table.
 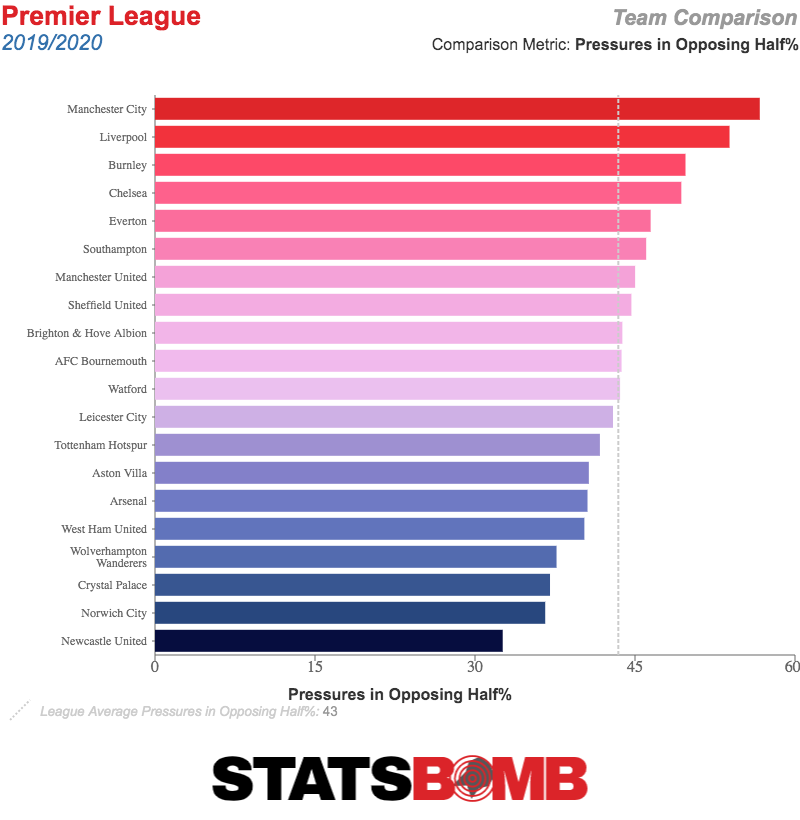 The obvious surprise towards the top here is Burnley. We all know at this point that Sean Dyche’s side do things differently, so it does make some sense to see them statistically stand out like this. At the bottom we have mostly less capable sides, but third placed Leicester sit in midtable. So do teams that defend high do a better job of it? Let’s compare this number to sides' xG conceded.
 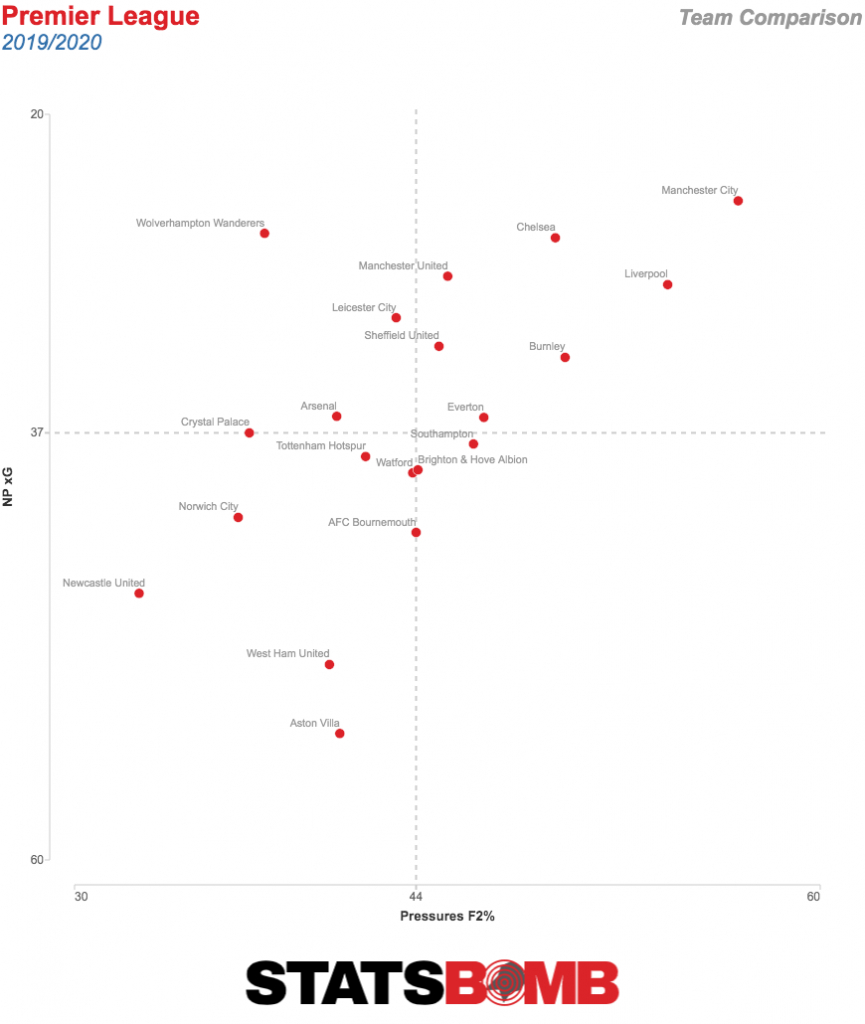 The obvious thing here is that the bottom right square is near empty. There isn't a team in the Premier League that offers an effective high press but just cannot defend at all. In terms of the sides that do actually defend well, there's a significant contrast. You have high pressers Man City and Liverpool, yes, but also a very solid Wolves outfit staying compact. The better sides do generally press more, but otherwise it isn't totally obvious that a particular pressing approach leads to better defending. David McGoldrick still can’t score goals Sorry, David. It feels mean at this point, but we can still gawk at your shot map one more time. Who knows, maybe your first attempt after football returns will go straight in the back of the net.
 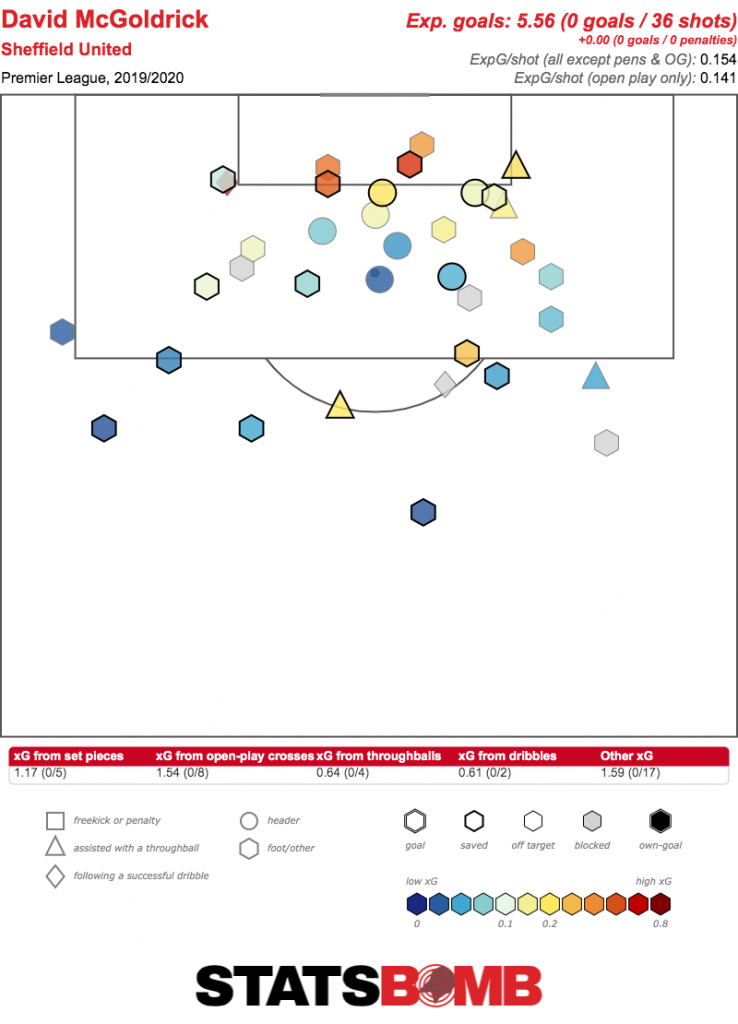 Next time, we’ll discuss some things we don’t know about the Premier League.
2020
What Do We Know About the Premier League?
By admin
|
April 27, 2020