One of the things I enjoy doing is building statistical profiles for football labels. By labels, I mean things like “What do AVB’s teams look like?” or “What performance in certain metrics is likely to get a team relegated?” Today I want to do that for teams that qualified for the Champions League across the big European leagues. At the end, I’m also going to drop some league-adjusted team rankings for all the Euro leagues I have data for this year, which may be of interest for those of you looking to place wagers on the Champions League in the next couple of days. Or might just be too ridiculous to take seriously. Don't blame me... blame the math. Or the meth. One of those. Champions League Stats As mentioned above, one of the things I wanted to do was look at how previous teams that qualified for the Champions League performed in certain metrics. Unfortunately, my detailed stats database isn’t very deep outside of the last twelve months or so, but we do have a few decent predictive metrics to investigate including Passing%, Possession, and Shot Dominance. For those who are unfamiliar with Shot Dominance, it’s a way of looking at the struggle to take more shots than your opponents. If a team consistently shoots more often than their opponents, they should end up doing well in the league table. If a team takes exactly as many shots as their opponents, they will have a ShDom value of 1. If they take twice as many shots as average opponents, they will have a ShDom value of 2, if they take half as many, the value will be .5. Since we are only looking at CL teams today, you generally expect that ShDom values to be above 1. Anyway, I grabbed information from as far back as WhoScored had data (Season End 2010, so 4 years from the Big 5 Euro leagues), and then plugged the Excel spreadsheet into Tableau to produce this. The numbers alongside the team name are passing percentages, the colors represent the various leagues, and the axes are shot dominance and possession. Teams in the bottom left have comparatively poor shot dominance and low possession values. Teams in the top right have really good shot dominance and possession numbers. As you probably noticed, Barcelona have some extreme outliers. Shot Dominance of about 1.4 seems to be the halfway point for CL teams, and above there teams are breaking into elite territory (usually on pace for the CL final 8 or so). Anyway, I don’t have much more to say about this now, but I thought the visualization was pretty interesting overall. Euro Rankings – Oct 22, 2013 As most of you who read the site know, we’ve been producing rankings for various leagues across Europe, based on my predictive model. It occurred to me that it could also be interesting to lump all the teams we are tracking together, and get sort of a Big 6 ranking (since that’s all the leagues I have data for right now). However… Not all leagues are created equal. Eredivisie is not remotely the same quality as the English Premier League. Thus I needed to take the model coefficients and adjust them based on league. If an elite team faces lower quality opponents, they will produce better stats. If your league is solely populated by crappy teams with a few powerhouses on top, those teams will dominate. However, if even those “lesser” teams are producing good players regularly… what does that mean? Here are the adjustment values I finally ended up with. EPL: 1.08 Bundesliga: 1 LaLiga: .95 SerieA: .95 French: .85 Eredivisie: .8 Quibble with these all you want – they are less science and more art. The Premier League is insanely deep this year, and they have used the money their TV deal is raking in to buy more and more talent from around the world. I wouldn’t have ranked it this highly last season, but there are just a crazy number of good teams floating around this year. La Liga has been marked down this season due to the exodus of talent from the second tier teams. Serie A has been marked up because they are deeper and better than in recent seasons, and French and the Dutch league are trailing the rest of Europe in depth of quality by some distance. Realizing that some of you might not like my adjustments, I have also included the raw rank as a column in the graphic below. 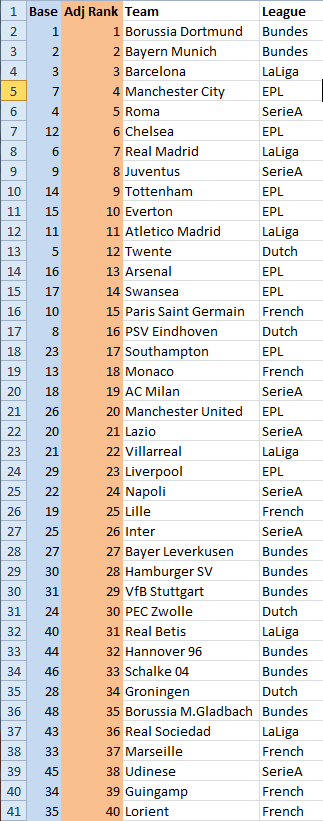 Dortmund are playing the most statistically dominant football in Europe by a surprising margin. That said, Bayern aren't that far behind. Pity all the rest of the teams in Germany, because once again these two clubs are juggernauts. Barcelona are mashing their league again this season, and despite some troubles away, Manchester City look like the top team in England so far. Then comes a team that isn’t even qualified for the Champions League in Roma. The stuff Rudi Garcia has them doing is special on both ends of the pitch. They aren’t super deep, but they should end up competing for the Serie A title right until the end. After Roma, you have Chelsea (still learning Mourinho’s system), Madrid (who got a big bump after an utterly dominant performance against Malaga this weekend), and another non-CL team in Tottenham. Everton round out the Euro-wide Adjusted Top 10. … I’m sorry, can you repeat that? Everton. Euro-wide. Top 10. And on that note, we’re finished! Good night, everybody! Enjoy the Champions League! All I can say is that it’s still early in the season and maaaaybe the EPL quality bump should perhaps be a little smaller. They rank 15th in the non-league adjusted metric, which is still damned high. They are also shockingly good on the defensive end for a Roberto Martinez team. I am sooooo going to end up eating crow re: their crazy loan deals, aren’t I? Conclusion I don’t know what to think about this Euro-wide stuff. The predictive model is built to evaluate teams against each other inside the league, but it successfully would have predicted the final 4 of the Champions League last year, especially once Juve got paired against Bayern. I’ll try and track this once a month from here out and see what we end up with at the end of the season. Whatever the case, these are just out here because I had a CL piece I wanted to write and figured I might as well use all these data for something as well. Thanks for listening, --TK
2013
What Does It Take To Qualify For the Champions League?
By admin
|
October 22, 2013