Intro
Although pass completion rates may still be a mainstay of football analysis on TV coverage, they are no longer considered an accurate representation of player passing skill by many analysts. As we know, not all passes are created equal, and expecting them to be completed at an equal rate is therefore unreasonable. Instead, expected pass (xPass) models have gained popularity due to their ability to consider the execution difficulty of the passes players attempt. Hudl Statsbomb released our xPass model in early 2023, but we’ve decided now is the time for an upgrade.
Our current xPass model estimates the probability that any given pass will be successful using characteristics of the condition in which it was played, including:
- The pass location
- The pass length and angle
- The body part used to play the pass
- The pattern of play
- The defensive pressure on the passer
These are all very useful indicators of the likelihood that a pass will be successful. However, this feature set includes no notion of player locations, whether that be the availability of teammates to receive a pass or the presence of opponents who may intercept the pass. By leveraging Hudl Statbomb's 360 freeze-frames data,we’re able to encode the locations of all on-camera players to produce a more contextually-aware xPass model, allowing for more accurate model estimations and therefore higher quality analysis.
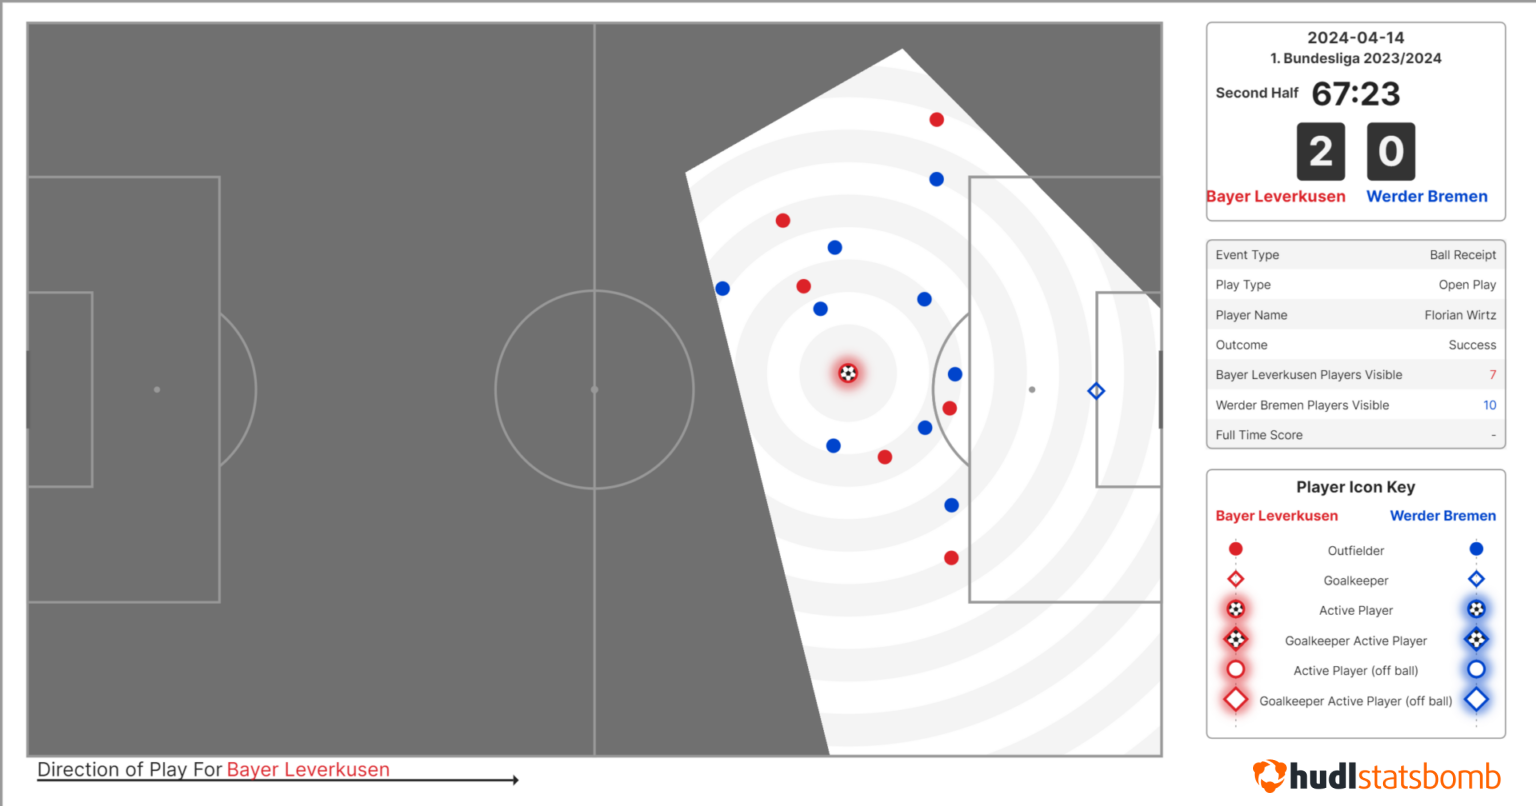
Including player locations in an expected pass model is by no means a new idea. The SoccerMap paper introduced a CNN (convolutional neural network) approach way back in October 2020, leveraging full tracking data. The tracking data provides the location, velocity, and direction of all 22 players 25 times a second. While this is an advantage over 360 freeze-frames, working with such a volume of data can be tricky and makes training models computationally expensive. The availability of full tracking data is also often limited, whereas Hudl 360 data is available across 40+ competitions, meaning model training and inference can be performed on a greater array of competitions. This, in turn, facilitates the analysis of a greater pool of players. We’ve found that, when training on the same competition seasons as SoccerMap, our feature engineering approach allows us to predict pass success more effectively than the CNN-based approach of SoccerMap.
The upgraded iteration of our xPass model, which we’re calling xPass 360:
- Utilises features derived from 360 freeze frames to provide more context to the model
- Provides substantial uplift over our current event-based version
- Better discriminates between easy and difficult passes
- Has better calibration across position groups
- Incorporates measures to actively mitigate potential information leakage issues
- And outperforms state-of-the-art xPass models that rely on tracking data, when using equivalent data preparation
Modelling Decisions
360 Features
There are a number of ways in which 360 freeze-frames can be represented. In previous Hudl Statsbomb conference presentations, we’ve seen examples of Graph Neural Networks and Convolutional Neural Networks. For our xPass model, we’ve chosen not to represent the full frame and instead focus on the information in the frame that is most likely to affect the chance of a successful pass. For this, we’re considering opposition presence around the passer, opposition presence along the path of the pass, as well as opposition and teammate presence at the target location.
Pass Segment Features
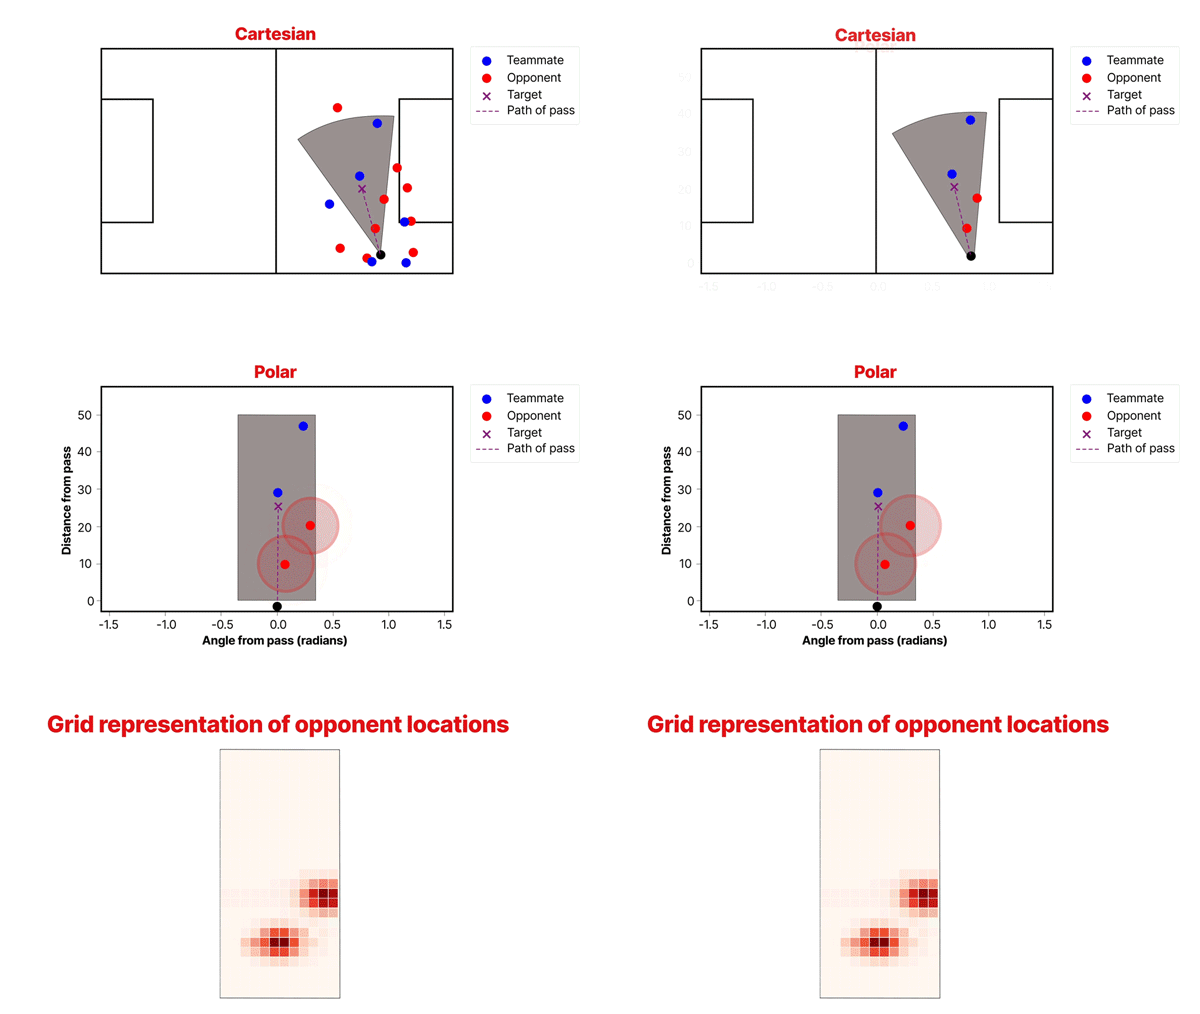
It’s fairly intuitive that the players with the greatest chance of intercepting a pass are those closest to its path. Therefore, we derive features representing the positions of defenders in the cone-shaped segment around the pass. A cone shape is chosen because the further we move away from the pass origin, the longer a pass will take to reach its target, and therefore defenders standing further away from the path of the pass have a greater chance of intercepting.
The location of each defender, relative to the passer and path of the pass, is transformed from Cartesian to Polar space (as seen in the gif below). This has the effect of stretching the cone shape into a rectangle. Each player is then converted to a 2D Gaussian, with the mean set to their location and a standard deviation that decreases as they move further from the passer. This represents the fact that players take up a larger proportion of the segment closer to the passer. We are left with an n x m grid representation of the segment, which is compressed into tabular features using Principal Component Analysis (PCA).
Soft Pressure Features
To represent the proximal presence of players relative to a fixed location, we use soft pressure features. They are derived by converting the locations of the players, the pass origin, and the pass target into 2D Gaussians and then taking the weighted sum of the overlapping regions. The greater the overlap, the closer the opponent is to the passer/receiver, and therefore, the more soft pressure they are applying. These features have the advantage of being continuous, allowing the model to discriminate between different magnitudes of pressure. However, we still retain the binary collector-tagged “pressured” features, enabling the model to differentiate between cases where the passer is being actively closed down and cases where an opponent is close by but not making an attempt to close down the passer.
The area each player is considered to pressure is controlled by the sigma parameter of the Gaussian distribution. By varying the sigma, the model can distinguish between a location being pressured by a single player who is very close or by multiple defenders at a moderate distance. Therefore, multiple soft pressure features with differing sigma values are used.
Mitigating the risk of Leakage
Information leakage is a machine learning phenomenon that occurs when information that is causally dependent on the outcome is used during model training, leading to inflated performance metrics and overconfidence in model performance. Most machine learning models in the football domain are vulnerable to leakage as we run inference on observations for which the outcome is already known, such as knowing the outcome of a shot in xG or pass in xPass models. Leakage doesn’t always occur so clearly though, some features may allow the model to cheat without directly revealing the outcome.
In the case of an xPass model, a possible cause of leakage are features representing the intended target location of a pass. While including some notion of the pass target location is crucial for estimating the execution difficulty of a pass, only the passer knows the intended target with 100% certainty. In lieu of this information, many public xPass models use the end location of the pass as the target location, but this is undesirable for several reasons. For example, it allows the model to learn that any pass ending off the side of the pitch must have been unsuccessful and that particularly short passes are very likely to have been blocked, thus also unsuccessful.
So how do we determine where a player was intending to pass?
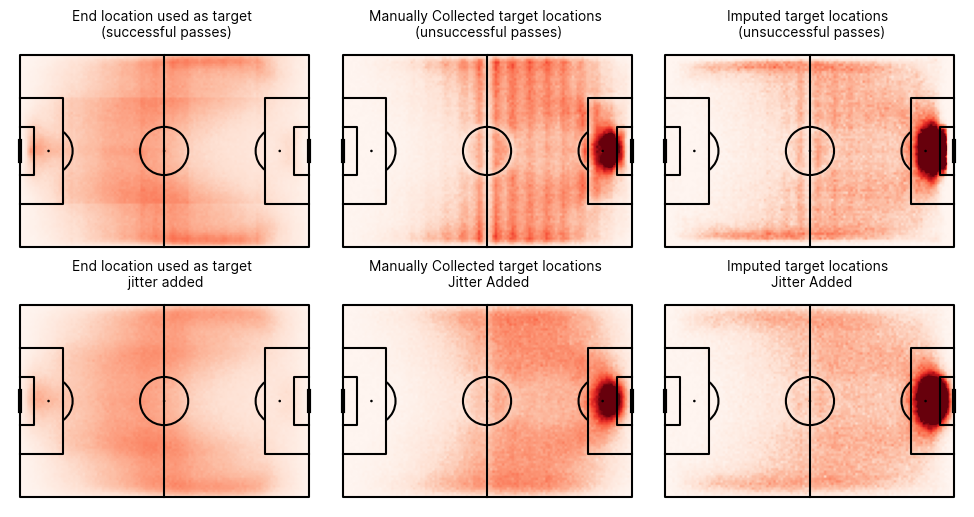
At Hudl Statsbomb, our data collectors tag the target location of unsuccessful passes when they are able to identify the intended pass location. This isn’t always possible, for example passes that are overhit or particularly wayward. This leaves a subset of unsuccessful passes with no target (5.8% of all passes). However, since we have a set of failed pass observations that do have collected target locations, we can train a machine learning model to predict intended locations and impute any missing values. For all successful passes, we simply use the location of the receiver as the target.
We've always used this approach when training our xPass models, but with the latest 360 version of our model, we’ve taken further steps to mitigate the risk of leakage. As we’ve discussed, there are three methods of deriving the target location of a pass, and these are conditional on the pass outcome. Therefore, if a model can learn which of the three sub-populations the pass belongs to, it can infer whether the pass is successful or not.
When plotted, the distribution of the three subpopulations look quite different, this is to be expected as the areas where passes are commonly successful differ from those where passes are commonly unsuccessful. However, we also see an undesirable striped pattern that appears to be due to the fidelity of collected locations or collectors' tendency to round. To prevent the model from learning that passes targeted at the high-density regions of these stripes are completed at a higher rate, we add a 2D jitter to the target location (and any downstream features) before training. This masks the undesirable patterns so they are not learned by the model meaning the raw target locations can be used at the time of inference. The difference in the distribution of the sub-populations when the jitter is added can be observed below.
Performance vs Event Based model
To assess the performance improvement resulting from using the 360-derived features, we've trained two models: one using event-only data and another with a combination of event and 360 data. These are trained using a dataset made up of passes from competitions of varying strength. On an unseen test set, the event-only model achieves a log loss of 0.314, while the 360 variant achieves a log loss of 0.274 (lower is better).
It’s worth noting that if we were to focus exclusively on the traditional "Big 5" leagues, we observe a significant performance improvement, as pass outcomes in these leagues are more predictable. However, by training on a broader variety of competitions, we accept the slightly lower performance to ensure the model's applicability to any league we may wish to analyse.
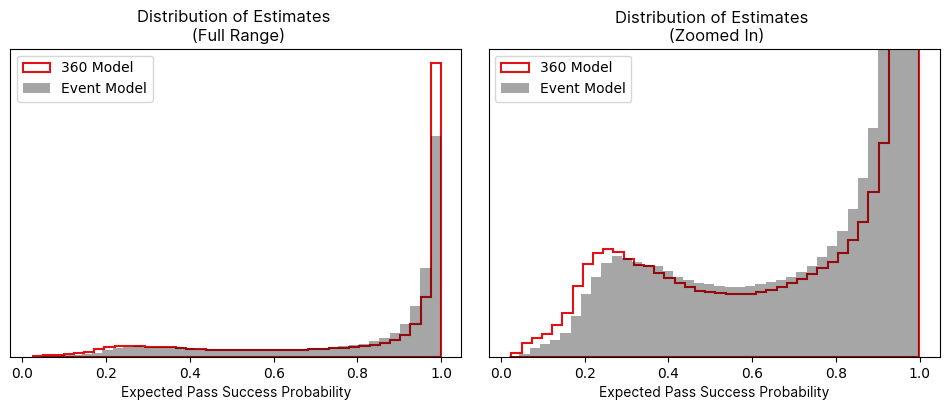
In practice, this performance uplift means the model better discriminates between easy and difficult passes. This is evident when comparing the distribution of estimates from the event-based model to those from the 360 model. The 360 model's predictions show a higher proportion in the tails of the distribution because it is more confident in its estimates more often.
SoccerMap Comparison
In the introduction, we alluded to the fact that the performance of the xPass 2.0 model surpasses that of the state-of-the-art tracking data xPass model when using an equivalent data preparation. The SoccerMap model estimates the probability of a successful pass based on the end location, not the intended target. For the fairest possible comparison, we trained a model using this approach. We also used 740 Premier League games for training, but from the 2022/23 and 2023/24 seasons instead of 2013/14 and 2014/15. On an unseen test dataset, the SoccerMap model achieved a log loss of 0.217, while the 360 model achieved 0.205.
This comparison is not intended to establish that one model is better than the other. The SoccerMap model prioritises producing interpretable pass probability surfaces, and while the ability to estimate pass success probability is an important component, it was secondary to the main objective of the paper. Therefore, modelling decisions for SoccerMap were likely made to prioritise surface interpretability. Although our model is capable of generating these surfaces, we focused on creating a model that delivers the most accurate estimates, allowing analysts to evaluate the passing efficiency of players. This is because we believe this to be the most valuable use case of our model.
Positional Effects
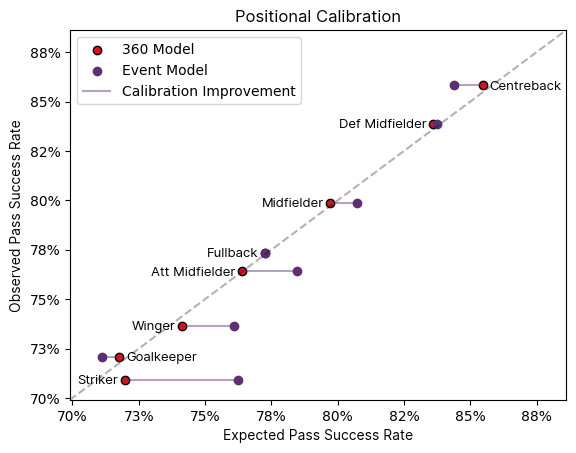
The additional context provided by features derived from 360 data becomes particularly evident when examining positional biases. This is due to the fact the locations of teammates and opponents is likely to change depending on the positional group of the player making the pass. For example strikers may be more inclined to execute passes in highly contested areas. However, an events-based model lacks awareness of these nuances and aggregates data across all similar situations. Presented below is a calibration plot segmented by positional group, illustrating that the calibration issues observed with event-based xPass models are largely mitigated. Consequently, the 360 model offers a more equitable evaluation of player passing efficiency compared to the event-based model.
Player Aggregates
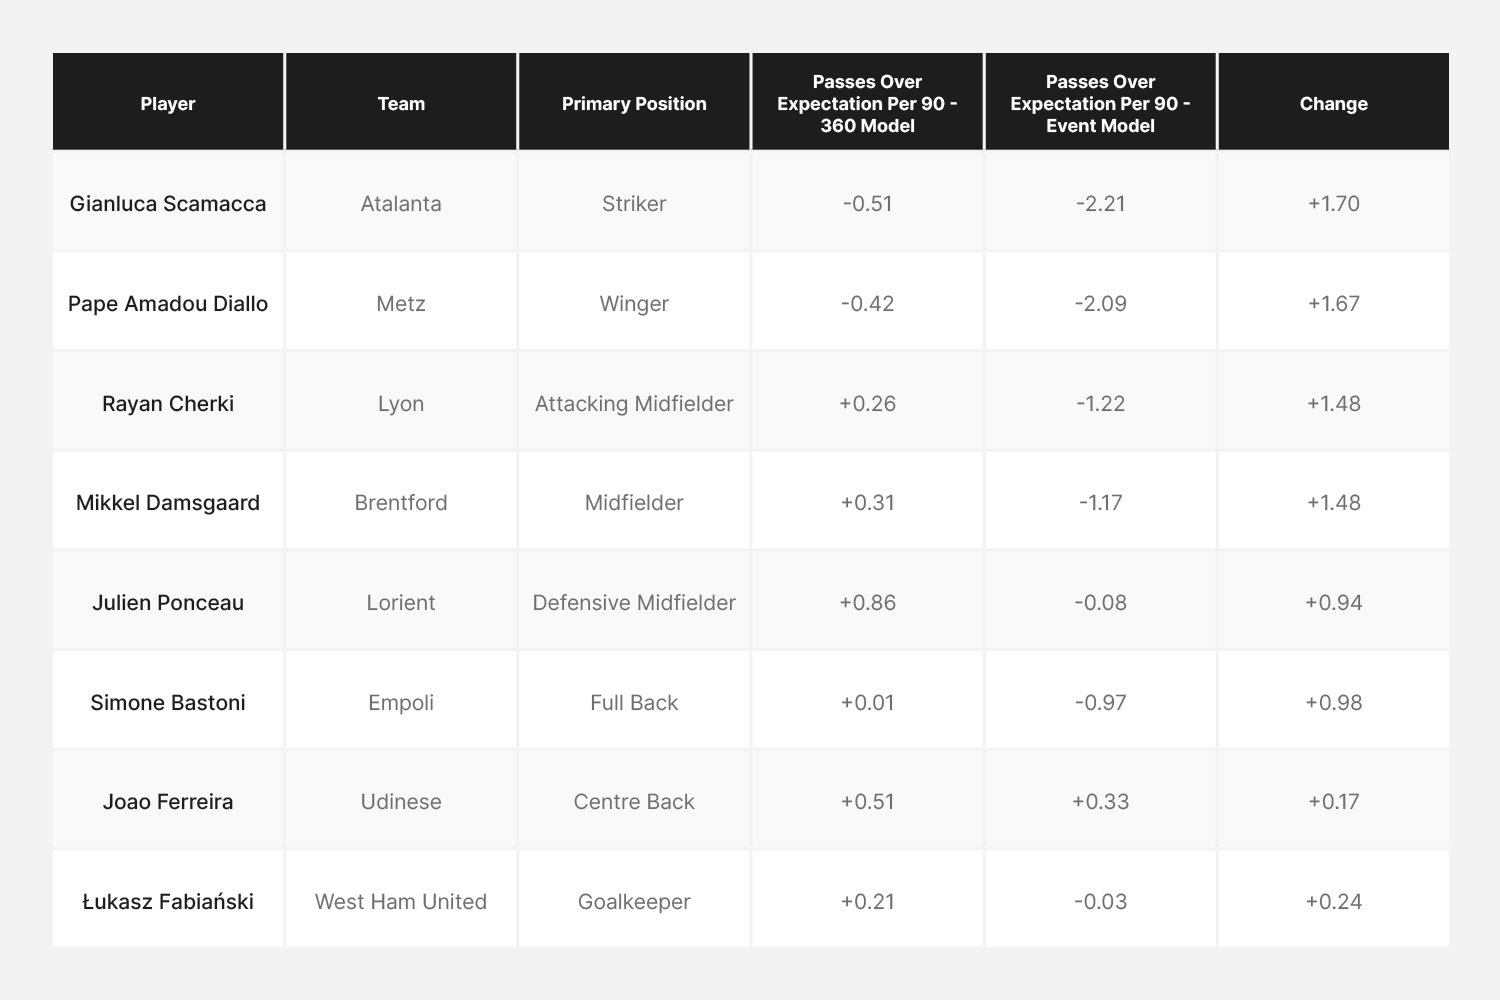
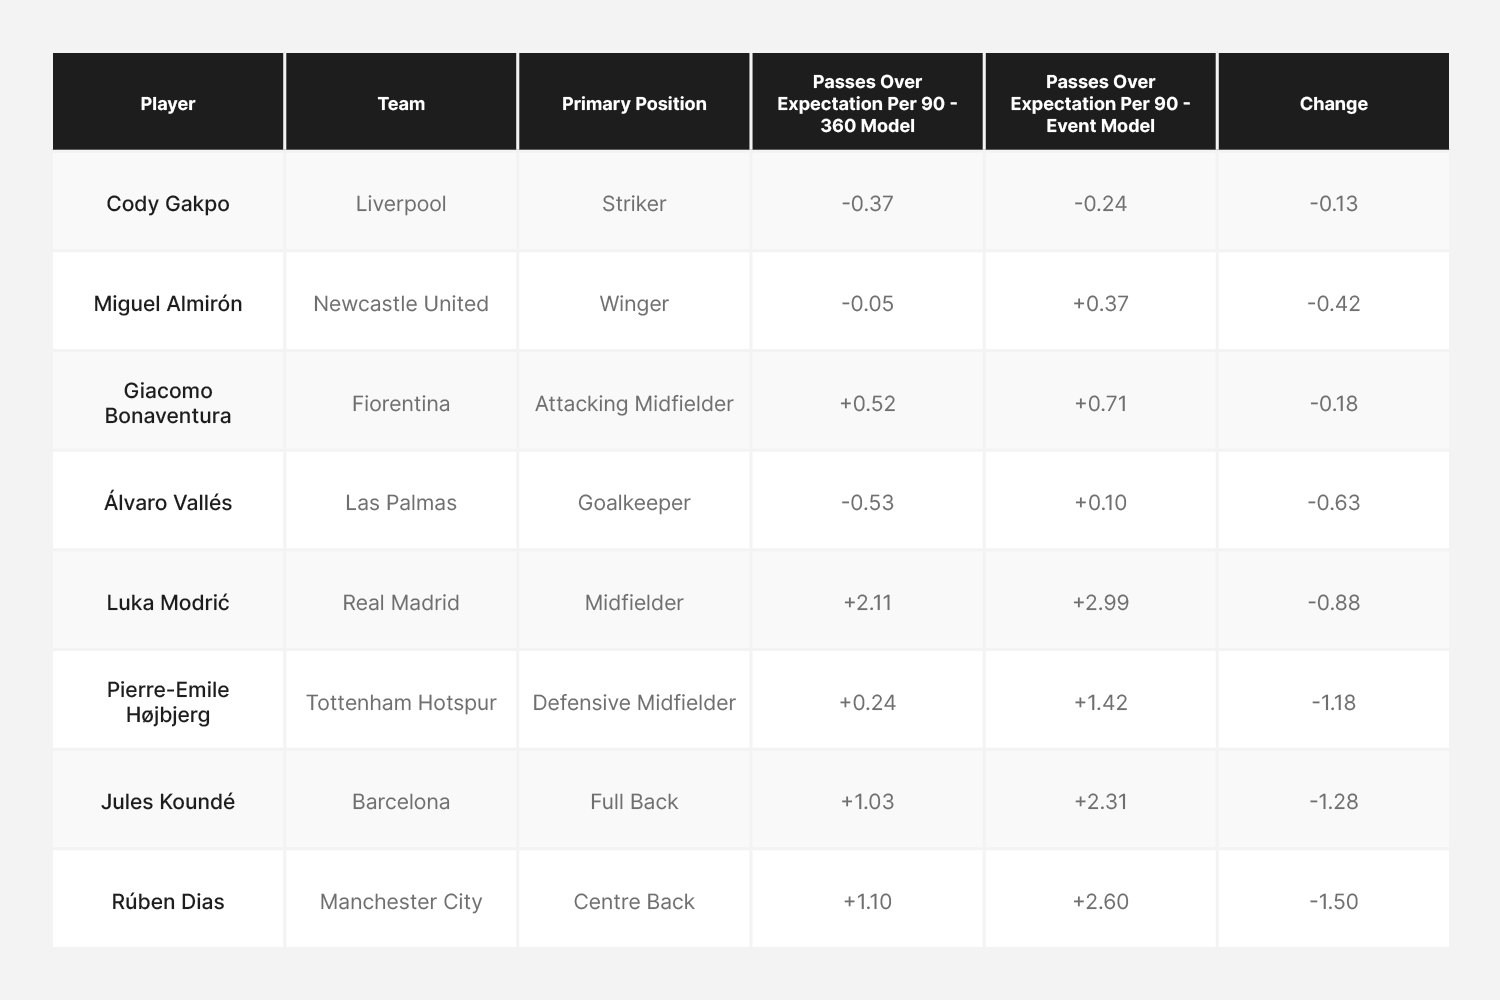
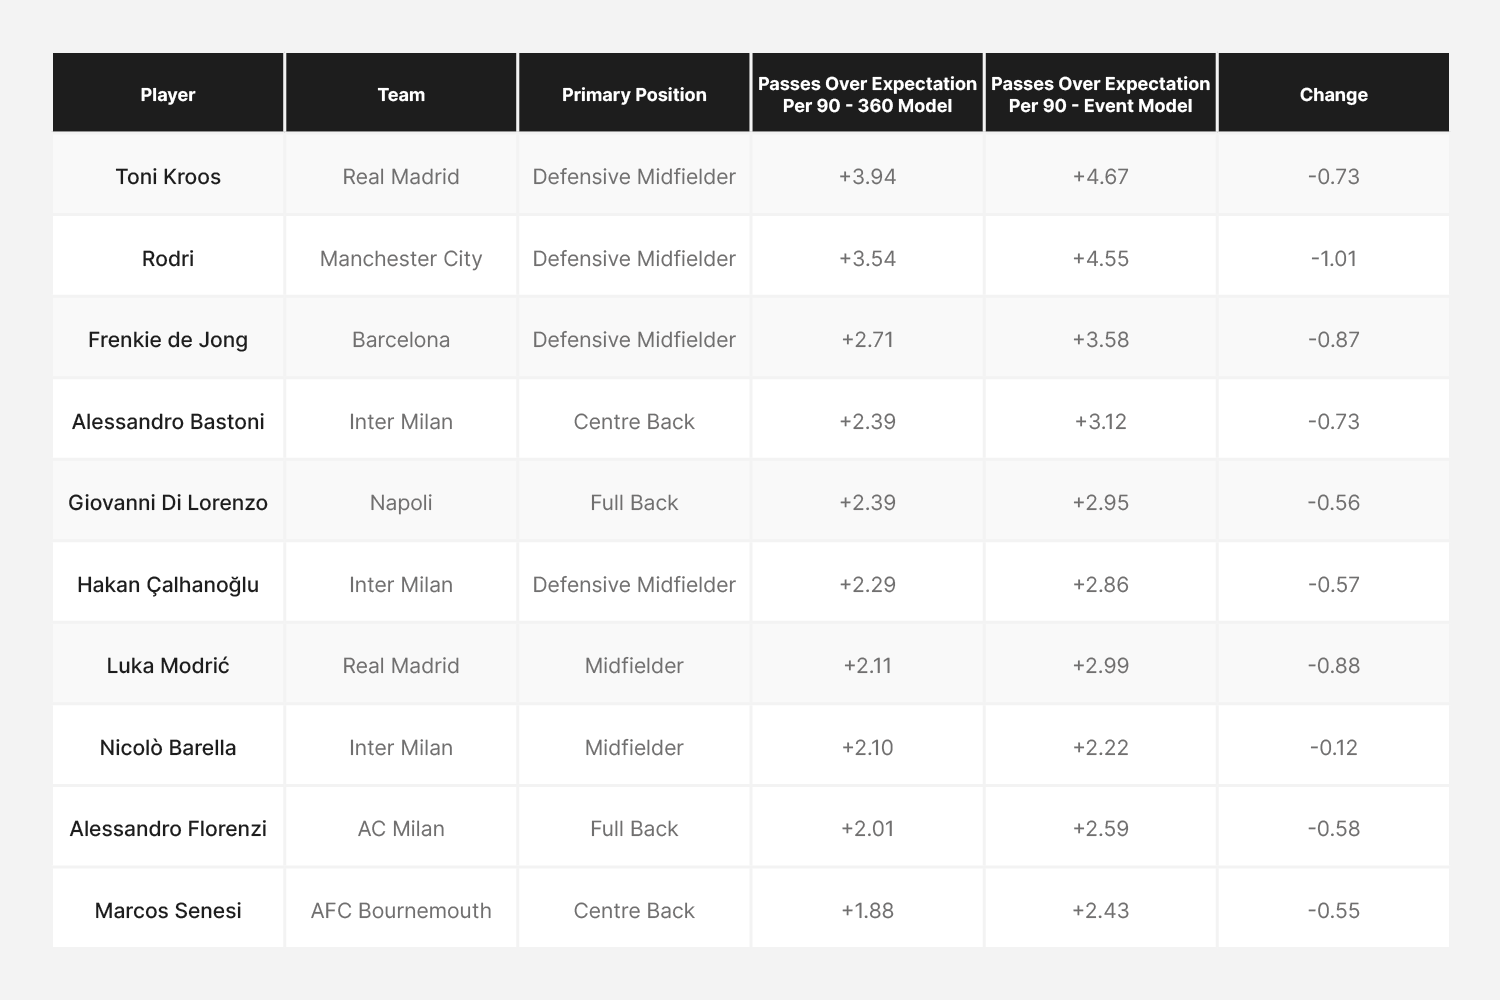
Having looked at the impact of the 360 model on the expected pass rate for different positional groups, we can also analyse how this impacts individual player’s performance relative to expectation. The players most impacted by the new model can be highlighted by finding the residual between the number of passes completed over expectation per 90 according to the event model vs the 360 model. The players with the most substantial changes in their passes over expectation for each positional group are shown below. These results are from the 'Big 5' leagues for the 2023/24 season.
Biggest Winners
This list predominantly features players from lower possession teams, who are more likely to have a higher proportion of their passes contested by the opposition. We see the most significant changes are observed in the attacking position groups, as these players more frequently perform passes under heavy defensive pressure.
Biggest Losers
This list predominantly includes players from teams near the top of their respective leagues. These teams typically have high possession rates, often resulting in their opponents dropping deeper defensively. Consequently, the passes performed by these players are generally easier to complete than what is estimated by the event-based model, which does not account for the positioning of opponents.
Top Performers
This list primarily consists of safe, volume passing players who operate in deeper areas of the pitch. The fact that the new model rates these players lower does not reflect negatively on their abilities. In fact, most people would consider this list of players among the best passers in the world. However, it does suggest that the ability to identify low-risk passes is itself a skill that is arguably as valuable as pass execution.
Conclusion
We’ve introduced our latest iteration of our xPass model which leverages 360 freeze frame data to provide substantial performance uplift over an event based model, specifically in positional calibration and in more accurately identifying pass difficulty, while also making active steps to mitigate the possibility of information leakage. The result is a new xPass model that, when using equivalent data preparation, outperforms state-of-the-art tracking data xPass models, and will be available to Hudl Statsbomb 360 customers soon.

